第2章極限
2.1 A Preview of Calculus2.1 微積分を見渡す
Learning Objectives学習目標
- Describe the tangent problem and how it led to the idea of a derivative.接線の問題と、それが微分という考え方につながった経緯を説明する。
- Explain how the idea of a limit is involved in solving the tangent problem.接線の問題を解くとき、極限の考え方がどのように使われるか説明する。
- Recognize a tangent to a curve at a point as the limit of secant lines.曲線上のある点での接線を、割線の極限として捉える。
- Identify instantaneous velocity as the limit of average velocity over a small time interval.瞬間速度を、小さな時間区間での平均速度の極限として捉える。
- Describe the area problem and how it was solved by the integral.面積の問題と、それを積分で解く方法を説明する。
- Explain how the idea of a limit is involved in solving the area problem.面積の問題を解くとき、極限の考え方がどのように使われるか説明する。
- Recognize how the ideas of limit, derivative, and integral led to the studies of infinite series and multivariable calculus.極限・微分・積分の考え方が、無限級数や多変数の微積分の研究につながったことを理解する。
As we embark on our study of calculus, we shall see how its development arose from common solutions to practical problems in areas such as engineering physics—like the space travel problem posed in the chapter opener. Two key problems led to the initial formulation of calculus: (1) the tangent problem, or how to determine the slope of a line tangent to a curve at a point; and (2) the area problem, or how to determine the area under a curve.
英語のヒント
微積分の学習を始めるにあたり、その発展が、工学や物理学などの実際の問題に共通する解き方から生まれたことを見ていこう。章の冒頭の宇宙旅行の問題も、その1つである。微積分の最初の定式化につながったのは、主に2つの問題だった。(1)曲線上のある点で接線の傾きを求める「接線の問題」と、(2)曲線の下の面積を求める「面積の問題」である。
The Tangent Problem and Differential Calculus接線の問題と微分法
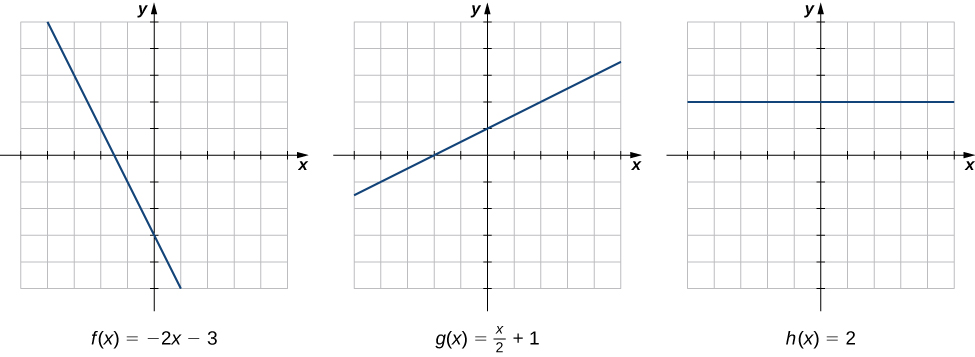
Rate of change is one of the most critical concepts in calculus. We begin our investigation of rates of change by looking at the graphs of the three lines and shown in Figure 2.2.
英語のヒント
変化率は、微積分で特に重要な概念の1つである。図2.2に示す3本の直線、およびのグラフから、変化率を調べ始めよう。
OpenStax, Rice University; Calculus Volume 1. · CC BY-NC-SA 4.0
Figure 2.2図 2.2
The rate of change of a linear function is constant in each of these three graphs, with the constant determined by the slope.
3つのグラフでは、いずれも関数の変化率が一定であり、その値は直線の傾きで決まる。
As we move from left to right along the graph of we see that the graph decreases at a constant rate. For every 1 unit we move to the right along the x-axis, the y-coordinate decreases by 2 units. This rate of change is determined by the slope (−2) of the line. Similarly, the slope of 1/2 in the function tells us that for every change in x of 1 unit there is a corresponding change in y of 1/2 unit. The function has a slope of zero, indicating that the values of the function remain constant. We see that the slope of each linear function indicates the rate of change of the function.
英語のヒント
のグラフを左から右へたどると、一定の割合で下がっている。x軸に沿って右へ1進むたびに、y座標は2減る。この変化率は、直線の傾き−2で決まる。同様に、関数の傾き1/2は、xが1増えるたびにyが1/2増えることを示している。関数の傾きは0で、関数の値は一定のままである。このように、直線のグラフを持つ関数では、傾きが変化率を表す。
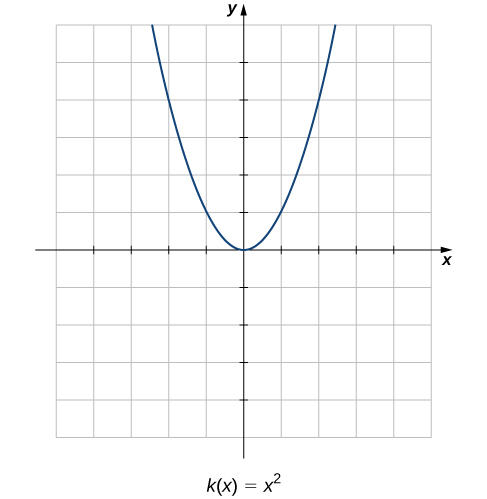
Compare the graphs of these three functions with the graph of (Figure 2.3). The graph of starts from the left by decreasing rapidly, then begins to decrease more slowly and level off, and then finally begins to increase—slowly at first, followed by an increasing rate of increase as it moves toward the right. Unlike a linear function, no single number represents the rate of change for this function. We quite naturally ask: How do we measure the rate of change of a nonlinear function?
英語のヒント
これら3つの関数と、のグラフを比べよう(図2.3)。は、左側では急に減少し、その減少が次第に緩やかになって、やがて平らになる。その後は増加に転じ、最初はゆっくり、右へ進むにつれて増加の割合も大きくなる。直線のグラフを持つ関数と違い、この関数の変化率を、1つの数で表すことはできない。では、直線ではない関数の変化率は、どのように測ればよいのだろうか。
OpenStax, Rice University; Calculus Volume 1. · CC BY-NC-SA 4.0
Figure 2.3図 2.3
The function does not have a constant rate of change.
関数の変化率は一定ではない。
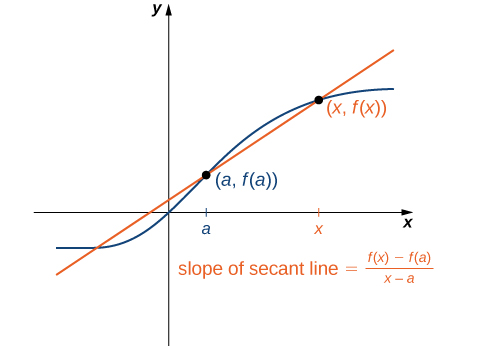
We can approximate the rate of change of a function at a point on its graph by taking another point on the graph of drawing a line through the two points, and calculating the slope of the resulting line. Such a line is called a secant line. Figure 2.4 shows a secant line to a function at a point
英語のヒント
関数のグラフ上の点での変化率は、次のように近似できる。のグラフ上にもう1つの点を取り、2点を通る直線を引いて、その傾きを計算するのである。この直線を割線という。図2.4は、関数の点を通る割線を示す。
OpenStax, Rice University; Calculus Volume 1. · CC BY-NC-SA 4.0
Figure 2.4図 2.4
The slope of a secant line through a point estimates the rate of change of the function at the point
点を通る割線の傾きは、点における関数の変化率を近似する。
We formally define a secant line as follows:
割線を、次のように正式に定義する。
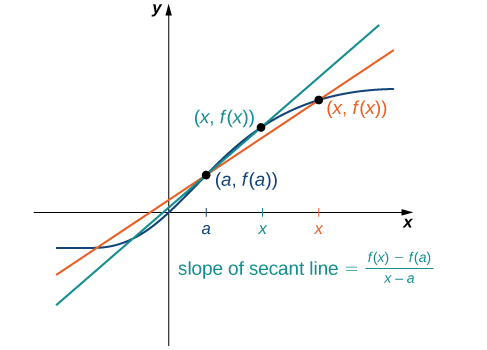
The accuracy of approximating the rate of change of the function with a secant line depends on how close x is to a. As we see in Figure 2.5, if x is closer to a, the slope of the secant line is a better measure of the rate of change of at a.
英語のヒント
割線で変化率を近似するときの精度は、xがaにどれほど近いかに依存する。図2.5に示すように、xがaに近いほど、割線の傾きは、aにおけるの変化率のよりよい近似となる。
OpenStax, Rice University; Calculus Volume 1. · CC BY-NC-SA 4.0
Figure 2.5図 2.5
As x gets closer to a, the slope of the secant line becomes a better approximation to the rate of change of the function at a.
xがaに近づくほど、割線の傾きは、aにおける関数の変化率のよりよい近似になる。
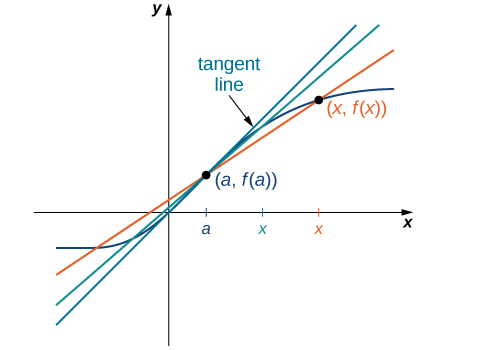
The secant lines themselves approach a line that is called the tangent to the function at a (Figure 2.6). The slope of the tangent line to the graph at a measures the rate of change of the function at a. This value also represents the derivative of the function at a, or the rate of change of the function at a. This derivative is denoted by Differential calculus is the field of calculus concerned with the study of derivatives and their applications.
英語のヒント
割線そのものも、aにおける関数の接線と呼ばれる直線に近づいていく(図2.6)。その接線の傾きが、aにおける関数の変化率を表す。この値は、関数のaにおける微分係数とも呼ばれ、という記号で表す。微分法とは、微分係数・導関数とその応用を研究する、微積分の一分野である。
OpenStax, Rice University; Calculus Volume 1. · CC BY-NC-SA 4.0
Figure 2.6図 2.6
Solving the Tangent Problem: As x approaches a, the secant lines approach the tangent line.
接線の問題を解く:xがaに近づくと、割線は接線に近づく。
Example 2.1 illustrates how to find slopes of secant lines. These slopes estimate the slope of the tangent line or, equivalently, the rate of change of the function at the point at which the slopes are calculated.
英語のヒント
例題2.1では、割線の傾きを求める方法を示す。その傾きは接線の傾きを、言い換えれば、その点での関数の変化率を近似する。
Example 2.1例題 2.1
Finding Slopes of Secant Lines割線の傾きを求める
Estimate the slope of the tangent line (rate of change) to at by finding slopes of secant lines through and each of the following points on the graph of
と、のグラフ上の次の各点を通る割線の傾きを求め、それを使ってにおけるの接線の傾き(変化率)を推定しなさい。
Solution解き方
Use the formula for the slope of a secant line from the definition.
定義にある、割線の傾きの公式を使う。
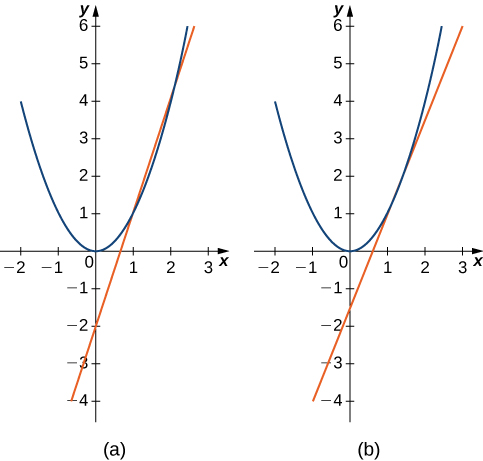
The point in part b. is closer to the point so the slope of 2.5 is closer to the slope of the tangent line. A good estimate for the slope of the tangent would be in the range of 2 to 2.5 (Figure 2.7).
(b)の点はにより近いので、傾き2.5のほうが接線の傾きに近い。接線の傾きは、2から2.5の間にあると見積もるのがよさそうである(図2.7)。
OpenStax, Rice University; Calculus Volume 1. · CC BY-NC-SA 4.0
Figure 2.7図 2.7
The secant lines to at through (a) and (b) provide successively closer approximations to the tangent line to at
を通るの割線が、(a)、(b)も通る場合。点を近づけるにつれ、におけるの接線への近似がよくなる。
We continue our investigation by exploring a related question. Keeping in mind that velocity may be thought of as the rate of change of position, suppose that we have a function, that gives the position of an object along a coordinate axis at any given time t. Can we use these same ideas to create a reasonable definition of the instantaneous velocity at a given time We start by approximating the instantaneous velocity with an average velocity. First, recall that the speed of an object traveling at a constant rate is the ratio of the distance traveled to the length of time it has traveled. We define the average velocity of an object over a time period to be the change in its position divided by the length of the time period.
英語のヒント
次は、関連する問いを考えよう。速度は位置の変化率と考えられることを思い出す。座標軸上を動く物体の任意の時刻tでの位置を、関数が与えるとする。同じ考え方から、時刻における瞬間速度を、妥当に定義できるだろうか。まず、平均速度で瞬間速度を近似する。一定の速さで動く物体では、速さは「移動距離÷移動時間」である。一方、ある時間区間における物体の平均速度は、「位置の変化量÷その時間区間の長さ」と定義する。
As t is chosen closer to a, the average velocity becomes closer to the instantaneous velocity. Note that finding the average velocity of a position function over a time interval is essentially the same as finding the slope of a secant line to a function. Furthermore, to find the slope of a tangent line at a point a, we let the x-values approach a in the slope of the secant line. Similarly, to find the instantaneous velocity at time a, we let the t-values approach a in the average velocity. This process of letting x or t approach a in an expression is called taking a limit. Thus, we may define the instantaneous velocity as follows.
tをaに近づけると、平均速度は瞬間速度に近づく。位置関数のある時間区間での平均速度を求めることは、関数の割線の傾きを求めることと、本質的には同じである。接線の傾きを求めるときには、割線の傾きの式でxをaに近づけた。同様に、時刻aでの瞬間速度を求めるには、平均速度の式でtをaに近づける。このように式の中でxやtをaに近づける操作を、「極限をとる」という。こうして、瞬間速度を次のように定義できる。
Example 2.2 illustrates this concept of limits and average velocity.
例題2.2では、極限と平均速度のこの考え方を具体的に示す。
Example 2.2例題 2.2
Finding Average Velocity平均速度を求める
A rock is dropped from a height of 64 ft. It is determined that its height (in feet) above ground t seconds later (for is given by Find the average velocity of the rock over each of the given time intervals. Use this information to guess the instantaneous velocity of the rock at time
高さ64フィートから石を落とす。t秒後の地面からの高さは、の範囲で、フィート単位のとして与えられる。指定された各時間区間での平均速度を求めなさい。その情報を使い、時刻での瞬間速度を予想しなさい。
Solution解き方
Substitute the data into the formula for the definition of average velocity.
平均速度の定義の公式に、値を代入する。
The instantaneous velocity is somewhere between −15.84 and −16.16 ft/sec. A good guess might be −16 ft/sec.
瞬間速度は−15.84 ft/secと−16.16 ft/secの間にある。−16 ft/secと推定するのがよさそうだ。