第2章極限
Infinite Limits無限大への発散
Evaluating the limit of a function at a point or evaluating the limit of a function from the right and left at a point helps us to characterize the behavior of a function around a given value. As we shall see, we can also describe the behavior of functions that do not have finite limits.
英語のヒント
ある点での極限や左右の極限を求めると、その点の周辺での関数の振る舞いを特徴づけられる。これから見るように、有限な極限を持たない関数についても、その振る舞いを表すことができる。
We now turn our attention to the third and final function introduced at the beginning of this section (see Figure 2.12(c)). From its graph we see that as the values of x approach 2, the values of become larger and larger and, in fact, become infinite. Mathematically, we say that the limit of as x approaches 2 is positive infinity. Symbolically, we express this idea as
この節の冒頭で紹介した3つの関数の最後、を考えよう(図2.12(c))。グラフを見ると、xが2に近づくにつれて、の値は際限なく大きくなる。これを「xが2に近づくとき、は正の無限大に発散する」といい、次のように表す。
More generally, we define infinite limits as follows:
より一般的に、無限大への発散を次のように定義する。
It is important to understand that when we write statements such as or we are describing the behavior of the function, as we have just defined it. We are not asserting that a limit exists. For the limit of a function to exist at a, it must approach a real number L as x approaches a. That said, if, for example, we always write rather than DNE.
英語のヒント
やと書くのは、今定義した関数の振る舞いを表すためである。「実数の極限が存在する」と主張しているわけではない。関数の極限がaで存在するには、xがaに近づくとき、ある実数Lに近づかなければならない。それでも、たとえばの場合には、 DNEとだけ書くのではなく、常にと書いて、発散の仕方を明示する。
Example 2.9例題 2.9
Recognizing an Infinite Limit無限大への発散を見分ける
Evaluate each of the following limits, if possible. Use a table of functional values and graph to confirm your conclusion.
可能なら次の各極限を求めなさい。関数の値の表とのグラフを使って、結論を確かめなさい。
Solution解き方
Begin by constructing a table of functional values.
まず関数の値の表を作る。
x |
x |
|||
|---|---|---|---|---|
−0.1 |
−10 |
0.1 |
10 |
|
−0.01 |
−100 |
0.01 |
100 |
|
−0.001 |
−1000 |
0.001 |
1000 |
|
−0.0001 |
−10,000 |
0.0001 |
10,000 |
|
−0.00001 |
−100,000 |
0.00001 |
100,000 |
|
−0.000001 |
−1,000,000 |
0.000001 |
1,000,000 |
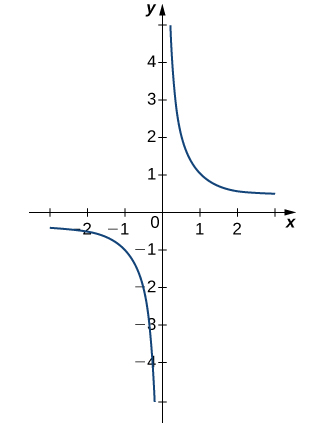
- The values of decrease without bound as x approaches 0 from the left. We conclude thatxが左から0に近づくと、の値は際限なく減少する。したがって、次のように結論づけられる。
- The values of increase without bound as x approaches 0 from the right. We conclude thatxが右から0に近づくと、の値は際限なく増加する。したがって、次のように結論づけられる。
- Since and have different values, we conclude thatとは異なるため、次のように結論づけられる。
The graph of in Figure 2.19 confirms these conclusions.
図2.19ののグラフも、これらの結論を裏づけている。
OpenStax, Rice University; Calculus Volume 1. · CC BY-NC-SA 4.0
Figure 2.19図 2.19
The graph of confirms that the limit as x approaches 0 does not exist.
のグラフからも、xが0に近づくときの極限は存在しないと分かる。
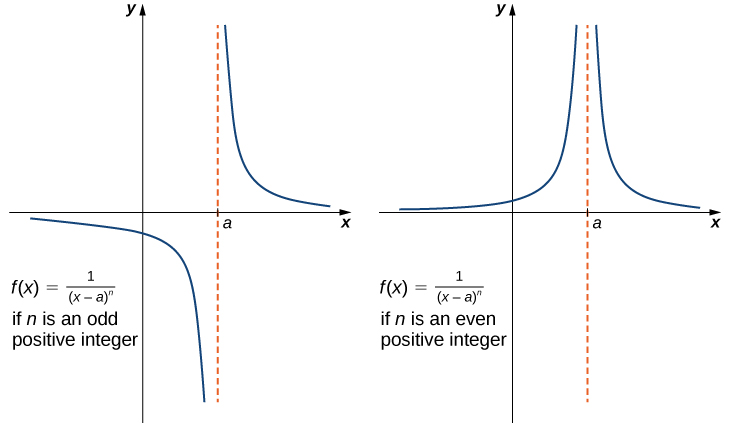
It is useful to point out that functions of the form where n is a positive integer, have infinite limits as x approaches a from either the left or right (Figure 2.20). These limits are summarized in Theorem 2.3.
OpenStax, Rice University; Calculus Volume 1. · CC BY-NC-SA 4.0
Figure 2.20図 2.20
The function has infinite limits at a.
関数は、aで無限大に発散する。
We should also point out that in the graphs of points on the graph having x-coordinates very near to a are very close to the vertical line That is, as x approaches a, the points on the graph of are closer to the line The line is called a vertical asymptote of the graph. We formally define a vertical asymptote as follows:
英語のヒント
のグラフでは、x座標がaに近い点ほど、垂直な直線に近い。つまり、xがaに近づくにつれて、のグラフ上の点は直線に近づく。この直線を、グラフの垂直漸近線という。正確には、次のように定義する。
Example 2.10例題 2.10
Finding a Vertical Asymptote垂直漸近線を求める
Evaluate each of the following limits using Theorem 2.3. Identify any vertical asymptotes of the function
定理2.3を使って、次の各極限を求めなさい。関数の垂直漸近線も求めなさい。
Solution解き方
We can use Theorem 2.3 directly.
定理2.3をそのまま使える。
The function has a vertical asymptote of
関数は、を垂直漸近線に持つ。
In the next example we put our knowledge of various types of limits to use to analyze the behavior of a function at several different points.
次の例題では、さまざまな極限について学んだことを使い、いくつかの点での関数の振る舞いを分析する。
Example 2.11例題 2.11
Behavior of a Function at Different Points異なる点での関数の振る舞い
Use the graph of in Figure 2.21 to determine each of the following values:
図2.21ののグラフを使い、次の各値を求めなさい。
![関数f(x)のグラフ。x<−2の滑らかな曲線は(−2,3)に白丸を持つ。その右側でも曲線が続き、区間(−2,1]の終点(1,6)は黒丸である。別に(1,3)に白丸があり、そこから右へ進む曲線はx=3に近づくと負の無限大へ下がる。x=3の右側の枝も、x=3に近づくと負の無限大へ下がる。その枝は右へ行くにつれて上昇し、第1象限のy≈4.5付近で曲がり方が変わり、さらに上へ続く。](media/CNX_Calc_Figure_02_02_015.jpg)
OpenStax, Rice University; Calculus Volume 1. · CC BY-NC-SA 4.0
Figure 2.21図 2.21
The graph shows
のグラフ。
Solution解き方
Using Theorem 2.3 and the graph for reference, we arrive at the following values:
定理2.3とグラフを参考にすると、次の値が得られる。
- is undefinedは未定義。
- DNE;は存在しない。。
- is undefinedは未定義。
Example 2.12例題 2.12
Chapter Opener: Einstein’s Equation章の導入問題:アインシュタインの式
NASA; reproduced in OpenStax Calculus Volume 1. · NASA educational-use permission
Figure 2.22図 2.22
(credit: NASA)
(クレジット:NASA)
In the chapter opener we mentioned briefly how Albert Einstein showed that a limit exists to how fast any object can travel. Given Einstein’s equation for the mass of a moving object, what is the value of this bound?
英語のヒント
章の冒頭では、あらゆる物体の速さに限界があることをアインシュタインが示したと述べた。運動する物体の質量を表すアインシュタインの式から、この速さの上限を求めなさい。
Solution解き方
Our starting point is Einstein’s equation for the mass of a moving object,
出発点は、運動する物体の相対論的質量を表すアインシュタインの式である。
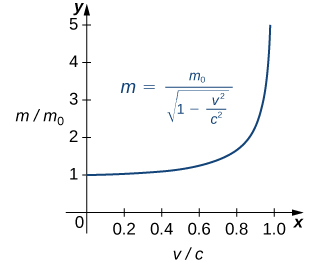
where is the object’s mass at rest, v is its speed, and c is the speed of light. To see how the mass changes at high speeds, we can graph the ratio of masses as a function of the ratio of speeds, (Figure 2.23).
ここでは静止質量、vは速さ、cは光速である。高速で質量を表すこの量がどう変わるかを見るため、速さの比を変数として、質量の比のグラフを描く(図2.23)。
OpenStax, Rice University; Calculus Volume 1. · CC BY-NC-SA 4.0
Figure 2.23図 2.23
This graph shows the ratio of masses as a function of the ratio of speeds in Einstein’s equation for the mass of a moving object.
運動する物体の質量を表すアインシュタインの式で、速さの比を変数として質量の比を描いたグラフ。
We can see that as the ratio of speeds approaches 1—that is, as the speed of the object approaches the speed of light—the ratio of masses increases without bound. In other words, the function has a vertical asymptote at We can try a few values of this ratio to test this idea.
速さの比が1に近づくとき、つまり物体の速さが光速に近づくとき、質量の比は際限なく増加する。この関数はを垂直漸近線に持つ。比の値をいくつか試して、この考えを確かめよう。
0.99 |
0.1411 |
7.089 |
0.999 |
0.0447 |
22.37 |
0.9999 |
0.0141 |
70.71 |
Thus, according to Table 2.8, if an object with mass 100 kg is traveling at 0.9999c, its mass becomes 7071 kg. Since no object can have an infinite mass, we conclude that no object can travel at or more than the speed of light.
表2.8によれば、静止質量100 kgの物体が0.9999cで運動すると、その相対論的質量は7071 kgになる。質量を持つ物体を光速に達するまで加速するには、無限のエネルギーが必要になる。したがって、そのような物体は光速以上では運動できない。原文の「どの物体も」という表現は、ここでは静止質量が正の物体についての結論である。光そのものはこの式の対象ではない。