第2章極限
Key Concepts重要な概念
- A table of values or graph may be used to estimate a limit.値の表やグラフを使って、極限を推定できる。
- If the limit of a function at a point does not exist, it is still possible that the limits from the left and right at that point may exist.ある点で関数の両側極限が存在しなくても、左右それぞれの片側極限は存在することがある。
- If the limits of a function from the left and right exist and are equal, then the limit of the function is that common value.左右の極限が存在して等しいなら、その共通の値が関数の両側極限である。
- We may use limits to describe infinite behavior of a function at a point.極限の記号を使って、ある点で関数が無限大に発散する様子を表せる。
Key Equations重要な式
Intuitive Definition of the Limit 極限の直感的な定義 |
|
Two Important Limits 2つの重要な極限 |
|
One-Sided Limits 片側極限 |
|
Infinite Limits from the Left 左側からの無限大への発散 |
|
Infinite Limits from the Right 右側からの無限大への発散 |
|
Two-Sided Infinite Limits 両側からの無限大への発散 |
and and かつ。かつ。 |
Exercises 30–31練習問題 30–31
For the following exercises, consider the function
以下の問題では、関数を考える。
Exercise 30問題 30
[T] Complete the following table for the function. Round your solutions to four decimal places.
[T] この関数について、次の表を完成させなさい。答えは小数第4位まで求める。
x |
x |
|||
|---|---|---|---|---|
0.9 |
a. |
1.1 |
e. |
|
0.99 |
b. |
1.01 |
f. |
|
0.999 |
c. |
1.001 |
g. |
|
0.9999 |
d. |
1.0001 |
h. |
Exercise 31問題 31
What do your results in the preceding exercise indicate about the two-sided limit Explain your response.
前問の結果から、両側極限について何が分かるか。理由を説明しなさい。
Solution解き方
does not exist because
であるため、は存在しない。
Exercises 32–34練習問題 32–34
For the following exercises, consider the function
以下の問題では、関数を考える。
Exercise 32問題 32
[T] Make a table showing the values of f for and for Round your solutions to five decimal places.
[T] とに対するfの値の表を作りなさい。答えは小数第5位まで求める。
x |
x |
|||
|---|---|---|---|---|
−0.01 |
a. |
0.01 |
e. |
|
−0.001 |
b. |
0.001 |
f. |
|
−0.0001 |
c. |
0.0001 |
g. |
|
−0.00001 |
d. |
0.00001 |
h. |
Exercise 33問題 33
What does the table of values in the preceding exercise indicate about the function
前問の値の表から、関数について何が分かるか。
Solution解き方
Exercise 34問題 34
To which mathematical constant does the limit in the preceding exercise appear to be getting closer?
前問の極限は、どの数学定数に近づいているように見えるか。
Exercises 35–37練習問題 35–37
In the following exercises, use the given values to set up a table to evaluate the limits. Round your solutions to eight decimal places.
以下の問題では、指定された値で表を作り、極限を求めなさい。答えは小数第8位まで求める。
Exercise 35問題 35
[T]
[T]
x |
x |
|||
|---|---|---|---|---|
−0.1 |
a. |
0.1 |
e. |
|
−0.01 |
b. |
0.01 |
f. |
|
−0.001 |
c. |
0.001 |
g. |
|
−0.0001 |
d. |
0.0001 |
h. |
Solution解き方
a. 1.98669331; b. 1.99986667; c. 1.99999867; d. 1.99999999; e. 1.98669331; f. 1.99986667; g. 1.99999867; h. 1.99999999;
a. 1.98669331; b. 1.99986667; c. 1.99999867; d. 1.99999999; e. 1.98669331; f. 1.99986667; g. 1.99999867; h. 1.99999999;
Exercise 36問題 36
[T] ±0.1, ±0.01, ±0.001, ±0.0001
[T] xの値:±0.1、±0.01、±0.001、±0.0001
X |
x |
|||
|---|---|---|---|---|
−0.1 |
a. |
0.1 |
e. |
|
−0.01 |
b. |
0.01 |
f. |
|
−0.001 |
c. |
0.001 |
g. |
|
−0.0001 |
d. |
0.0001 |
h. |
Exercise 37問題 37
Use the preceding two exercises to conjecture (guess) the value of the following limit: for a, a positive real value.
英語のヒント
直前の2問を使い、aを正の実数とするときの極限の値を予想しなさい。
Solution解き方
Exercises 38–43練習問題 38–43
[T] In the following exercises, set up a table of values to find the indicated limit. Round to eight digits.
[T] 以下の問題では、値の表を作って、指定された極限を求めなさい。数値は8桁に丸める。
Exercise 38問題 38
x |
x |
|||
|---|---|---|---|---|
1.9 |
a. |
2.1 |
e. |
|
1.99 |
b. |
2.01 |
f. |
|
1.999 |
c. |
2.001 |
g. |
|
1.9999 |
d. |
2.0001 |
h. |
Exercise 39問題 39
x |
x |
|||
|---|---|---|---|---|
0.9 |
a. |
1.1 |
e. |
|
0.99 |
b. |
1.01 |
f. |
|
0.999 |
c. |
1.001 |
g. |
|
0.9999 |
d. |
1.0001 |
h. |
Solution解き方
a. −0.80000000; b. −0.98000000; c. −0.99800000; d. −0.99980000; e. −1.2000000; f. −1.0200000; g. −1.0020000; h. −1.0002000;
a. −0.80000000; b. −0.98000000; c. −0.99800000; d. −0.99980000; e. −1.2000000; f. −1.0200000; g. −1.0020000; h. −1.0002000;
Exercise 40問題 40
x |
x |
|||
|---|---|---|---|---|
−0.1 |
a. |
0.1 |
e. |
|
−0.01 |
b. |
0.01 |
f. |
|
−0.001 |
c. |
0.001 |
g. |
|
−0.0001 |
d. |
0.0001 |
h. |
Exercise 41問題 41
z |
z |
|||
|---|---|---|---|---|
−0.1 |
a. |
0.1 |
e. |
|
−0.01 |
b. |
0.01 |
f. |
|
−0.001 |
c. |
0.001 |
g. |
|
−0.0001 |
d. |
0.0001 |
h. |
Solution解き方
a. −37.931934; b. −3377.9264; c. −333,777.93; d. −33,337,778; e. −29.032258; f. −3289.0365; g. −332,889.04; h. −33,328,889
a. −37.931934; b. −3377.9264; c. −333,777.93; d. −33,337,778; e. −29.032258; f. −3289.0365; g. −332,889.04; h. −33,328,889
Exercise 42問題 42
t |
|
|---|---|
0.1 |
a. |
0.01 |
b. |
0.001 |
c. |
0.0001 |
d. |
Exercise 43問題 43
x |
x |
|||
|---|---|---|---|---|
1.9 |
a. |
2.1 |
e. |
|
1.99 |
b. |
2.01 |
f. |
|
1.999 |
c. |
2.001 |
g. |
|
1.9999 |
d. |
2.0001 |
h. |
Solution解き方
a. 0.13495277; b. 0.12594300; c. 0.12509381; d. 0.12500938; e. 0.11614402; f. 0.12406794; g. 0.12490631; h. 0.12499063;
a. 0.13495277; b. 0.12594300; c. 0.12509381; d. 0.12500938; e. 0.11614402; f. 0.12406794; g. 0.12490631; h. 0.12499063;
Exercises 44–45練習問題 44–45
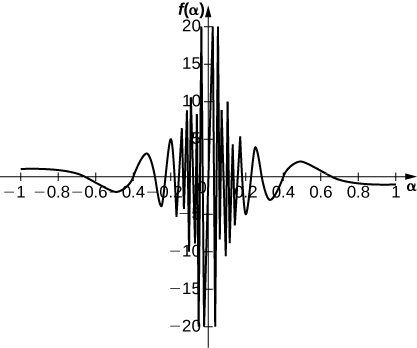
[T] In the following exercises, set up a table of values and round to eight significant digits. Based on the table of values, make a guess about what the limit is. Then, use a calculator to graph the function and determine the limit. Was the conjecture correct? If not, why does the method of tables fail?
[T] 以下の問題では、値の表を作り、有効数字8桁に丸めなさい。表から極限の値を予想し、その後、電卓で関数のグラフを描いて極限を判断すること。予想は正しかったか。違っていた場合、なぜ値の表による方法がうまくいかなかったのか。
Exercise 44問題 44
θ |
θ |
|||
|---|---|---|---|---|
−0.1 |
a. |
0.1 |
e. |
|
−0.01 |
b. |
0.01 |
f. |
|
−0.001 |
c. |
0.001 |
g. |
|
−0.0001 |
d. |
0.0001 |
h. |
Exercise 45問題 45
a |
|
|---|---|
0.1 |
a. |
0.01 |
b. |
0.001 |
c. |
0.0001 |
d. |
Solution解き方
a. 10.00000; b. 100.00000; c. 1000.0000; d. 10,000.000; Guess: actual: DNE
a. 10.00000; b. 100.00000; c. 1000.0000; d. 10,000.000。予想:。実際:極限は存在しない。
OpenStax, Rice University; Calculus Volume 1. · CC BY-NC-SA 4.0
Exercises 46–49練習問題 46–49
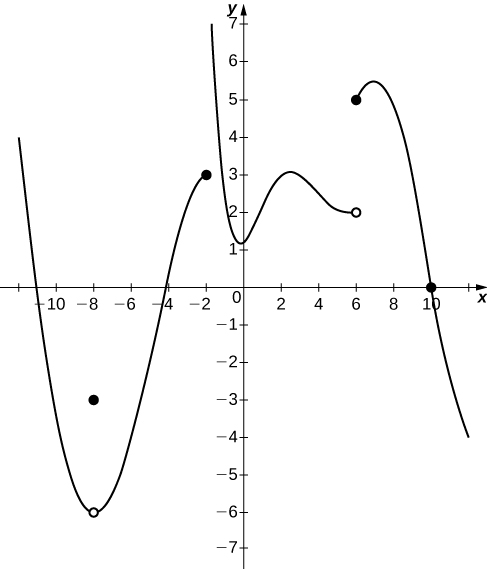
In the following exercises, consider the graph of the function shown here. Which of the statements about are true and which are false? Explain why a statement is false.
以下の問題では、ここに示す関数のグラフを考える。についての各記述の正誤を判定しなさい。誤りの場合は、その理由を説明すること。
OpenStax, Rice University; Calculus Volume 1. · CC BY-NC-SA 4.0
Exercise 46問題 46
Exercise 47問題 47
Solution解き方
False;
誤り。。
Exercise 48問題 48
Exercise 49問題 49
Solution解き方
False; DNE since and
誤り。とは一致しないため、は存在しない。
Exercises 50–54練習問題 50–54
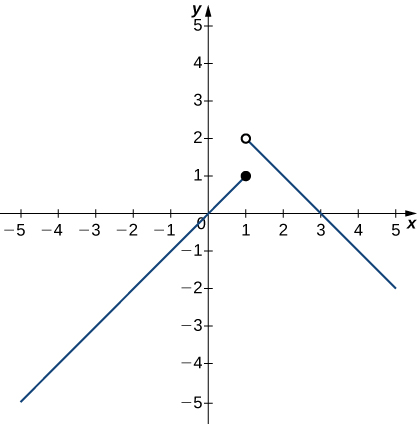
In the following exercises, use the following graph of the function to find the values, if possible. Estimate when necessary.
以下の問題では、次の関数のグラフを使い、可能なら指定された値を求めなさい。必要な場合は概数で答える。
OpenStax, Rice University; Calculus Volume 1. · CC BY-NC-SA 4.0
Exercise 50問題 50
Exercise 51問題 51
Solution解き方
2
2
Exercise 52問題 52
Exercise 53問題 53
Solution解き方
1
1
Exercise 54問題 54
Exercises 55–58練習問題 55–58
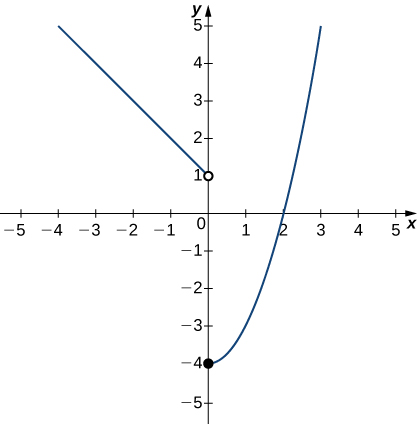
In the following exercises, use the graph of the function shown here to find the values, if possible. Estimate when necessary.
以下の問題では、ここに示す関数のグラフを使い、可能なら指定された値を求めなさい。必要な場合は概数で答える。
OpenStax, Rice University; Calculus Volume 1. · CC BY-NC-SA 4.0
Exercise 55問題 55
Solution解き方
1
1
Exercise 56問題 56
Exercise 57問題 57
Solution解き方
DNE
存在しない。
Exercise 58問題 58
Exercises 59–64練習問題 59–64
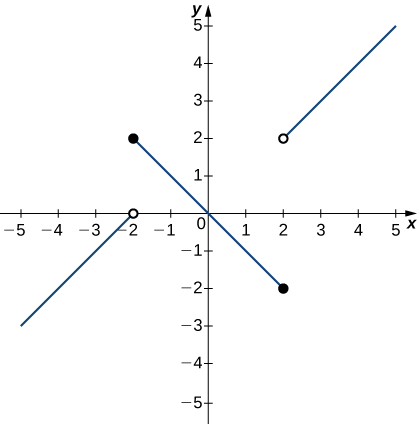
In the following exercises, use the graph of the function shown here to find the values, if possible. Estimate when necessary.
以下の問題では、ここに示す関数のグラフを使い、可能なら指定された値を求めなさい。必要な場合は概数で答える。
OpenStax, Rice University; Calculus Volume 1. · CC BY-NC-SA 4.0
Exercise 59問題 59
Solution解き方
0
0
Exercise 60問題 60
Exercise 61問題 61
Solution解き方
DNE
存在しない。
Exercise 62問題 62
Exercise 63問題 63
Solution解き方
2
2
Exercise 64問題 64
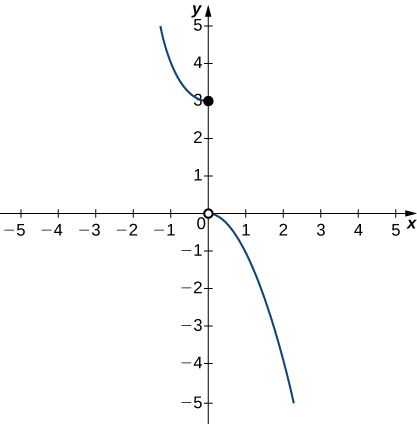
Exercises 65–67練習問題 65–67
In the following exercises, use the graph of the function shown here to find the values, if possible. Estimate when necessary.
以下の問題では、ここに示す関数のグラフを使い、可能なら指定された値を求めなさい。必要な場合は概数で答える。
OpenStax, Rice University; Calculus Volume 1. · CC BY-NC-SA 4.0
Exercise 65問題 65
Solution解き方
3
3
Exercise 66問題 66
Exercise 67問題 67
Solution解き方
DNE
存在しない。
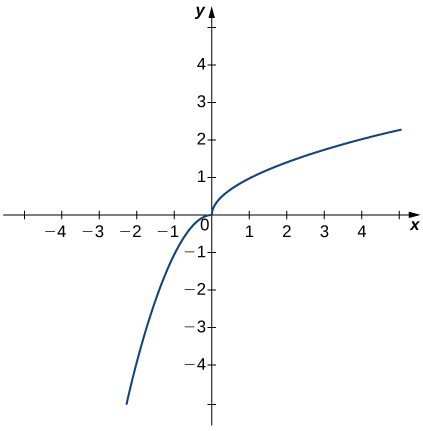
Exercises 68–70練習問題 68–70
In the following exercises, use the graph of the function shown here to find the values, if possible. Estimate when necessary.
以下の問題では、ここに示す関数のグラフを使い、可能なら指定された値を求めなさい。必要な場合は概数で答える。
OpenStax, Rice University; Calculus Volume 1. · CC BY-NC-SA 4.0
Exercise 68問題 68
Exercise 69問題 69
Solution解き方
0
0
Exercise 70問題 70
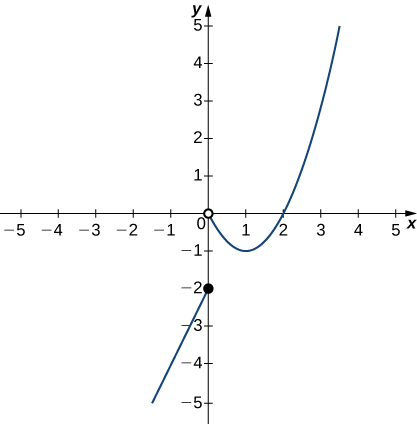
Exercises 71–75練習問題 71–75
In the following exercises, use the graph of the function shown here to find the values, if possible. Estimate when necessary.
以下の問題では、ここに示す関数のグラフを使い、可能なら指定された値を求めなさい。必要な場合は概数で答える。
OpenStax, Rice University; Calculus Volume 1. · CC BY-NC-SA 4.0
Exercise 71問題 71
Solution解き方
−2
−2
Exercise 72問題 72
Exercise 73問題 73
Solution解き方
DNE
存在しない。
Exercise 74問題 74
Exercise 75問題 75
Solution解き方
0
0
Exercises 76–82練習問題 76–82
In the following exercises, sketch the graph of a function with the given properties.
以下の問題では、指定された性質を持つ関数のグラフを描きなさい。
Exercise 76問題 76
is not defined.
は未定義。
Exercise 77問題 77
Solution解き方
Answers may vary.
解答は1通りとは限らない。
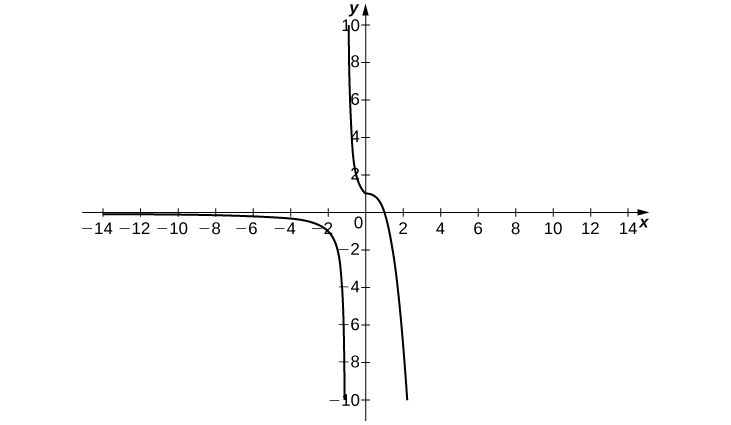
OpenStax, Rice University; Calculus Volume 1. · CC BY-NC-SA 4.0
Exercise 78問題 78
Exercise 79問題 79
Solution解き方
Answers may vary.
解答は1通りとは限らない。
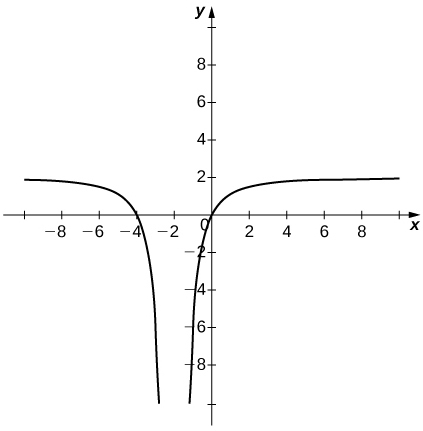
OpenStax, Rice University; Calculus Volume 1. · CC BY-NC-SA 4.0
Exercise 80問題 80
Exercise 81問題 81
Shock waves arise in many physical applications, ranging from supernovas to detonation waves. A graph of the density of a shock wave with respect to distance, x, is shown here. We are mainly interested in the location of the front of the shock, labeled in the diagram.
英語のヒント
衝撃波は、超新星から爆轟波まで、さまざまな物理現象で生じる。ここに、距離xに対する衝撃波の密度のグラフを示す。特に注目するのは、図でと表示された衝撃波面の位置である。
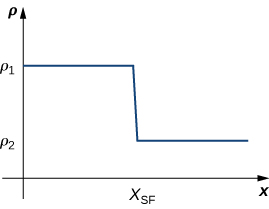
OpenStax, Rice University; Calculus Volume 1. · CC BY-NC-SA 4.0
- Evaluateを求めなさい。
- Evaluateを求めなさい。
- Evaluate Explain the physical meanings behind your answers.を求めなさい。それぞれの答えの物理的な意味を説明すること。
Solution解き方
a. b. c. DNE unless As you approach from the left, you are in the high-density area of the shock. When you approach from the right, you have not experienced the “shock” yet and are at a lower density.
a. b. c. でない限り、極限は存在しない。左からに近づくと、衝撃波の高密度の領域にいる。右から近づく場合は、まだ衝撃波が通過していない低密度の領域にいる。
Exercise 82問題 82
A track coach uses a camera with a fast shutter to estimate the position of a runner with respect to time. A table of the values of position of the athlete versus time is given here, where x is the position in meters of the runner and t is time in seconds. What is What does it mean physically?
陸上のコーチが、高速シャッターのカメラを使い、走者の時刻ごとの位置を推定している。次の表は、時刻t(秒)と走者の位置x(m)の関係を示す。を求め、その物理的な意味を説明しなさい。
t (sec) t(秒) |
x (m) x(m) |
|---|---|
1.75 |
4.5 |
1.95 |
6.1 |
1.99 |
6.42 |
2.01 |
6.58 |
2.05 |
6.9 |
2.25 |
8.5 |
infinite limit
無限大への発散
A function has an infinite limit at a point a if it either increases or decreases without bound as it approaches a
xがaに近づくとき、関数の値が際限なく増加または減少すること。
intuitive definition of the limit
極限の直感的な定義
If all values of the function approach the real number L as the values of approach a, approaches L
をaに近づけたとき、関数の値がすべて実数Lに近づくなら、はLを極限に持つ。
one-sided limit
片側極限
A one-sided limit of a function is a limit taken from either the left or the right
左側または右側の一方だけから近づけて考える、関数の極限。
vertical asymptote
垂直漸近線
A function has a vertical asymptote at if the limit as x approaches a from the right or left is infinite
xが右または左からaに近づくとき、関数が正または負の無限大に発散するなら、直線をその関数の垂直漸近線という。