第2章極限
The Area Problem and Integral Calculus面積の問題と積分法
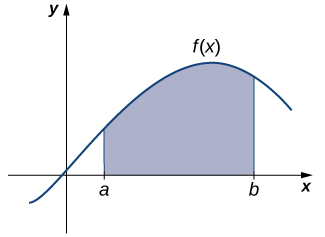
We now turn our attention to a classic question from calculus. Many quantities in physics—for example, quantities of work—may be interpreted as the area under a curve. This leads us to ask the question: How can we find the area between the graph of a function and the x-axis over an interval (Figure 2.8)?
英語のヒント
次に、微積分における古典的な問題に目を向けよう。物理学の多くの量は、たとえば仕事の量のように、曲線の下の面積として解釈できる。そこで、ある区間で、関数のグラフとx軸の間の面積をどうすれば求められるのか、という問題が生じる(図2.8)。
OpenStax, Rice University; Calculus Volume 1. · CC BY-NC-SA 4.0
Figure 2.8図 2.8
The Area Problem: How do we find the area of the shaded region?
面積の問題:色の付いた領域の面積をどうすれば求められるだろうか。
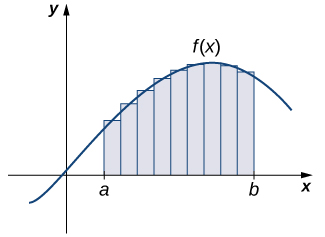
As in the answer to our previous questions on velocity, we first try to approximate the solution. We approximate the area by dividing up the interval into smaller intervals in the shape of rectangles. The approximation of the area comes from adding up the areas of these rectangles (Figure 2.9).
英語のヒント
先ほどの速度の問題と同じく、まず近似的に求める。区間を小さな区間に分け、それぞれを底辺とする長方形を作る。これらの長方形の面積を足し合わせることで、求めたい面積を近似する(図2.9)。
OpenStax, Rice University; Calculus Volume 1. · CC BY-NC-SA 4.0
Figure 2.9図 2.9
The area of the region under the curve is approximated by summing the areas of thin rectangles.
細い長方形の面積を足し合わせて、曲線の下の領域の面積を近似する。
As the widths of the rectangles become smaller (approach zero), the sums of the areas of the rectangles approach the area between the graph of and the x-axis over the interval Once again, we find ourselves taking a limit. Limits of this type serve as a basis for the definition of the definite integral. Integral calculus is the study of integrals and their applications.
英語のヒント
長方形の幅を小さくして0に近づけると、その面積の和は、区間でののグラフとx軸の間の面積に近づいていく。ここでもまた、極限を考えていることになる。このような極限が、定積分の定義の基礎になる。積分法は、積分とその応用を研究する分野である。
Example 2.3例題 2.3
Estimation Using Rectangles長方形を使った近似
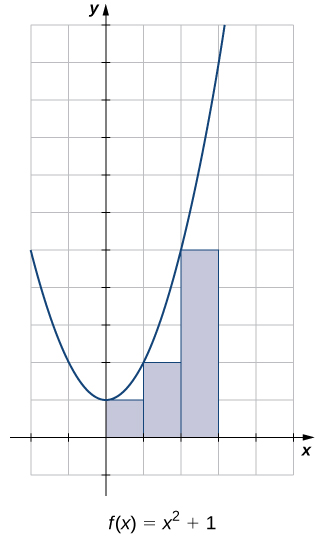
Estimate the area between the x-axis and the graph of over the interval by using the three rectangles shown in Figure 2.10.
図2.10に示す3つの長方形を使い、区間でのx軸とのグラフの間の面積を推定しなさい。
OpenStax, Rice University; Calculus Volume 1. · CC BY-NC-SA 4.0
Figure 2.10図 2.10
The area of the region under the curve of can be estimated using rectangles.
の曲線の下の面積は、長方形を使って推定できる。
Solution解き方
The areas of the three rectangles are 1 unit2, 2 unit2, and 5 unit2. Using these rectangles, our area estimate is 8 unit2.
3つの長方形の面積は、それぞれ1 単位2、2 単位2、5 単位2である。したがって、これらを使った面積の推定値は8 単位2となる。
Other Aspects of Calculus微積分のほかの側面
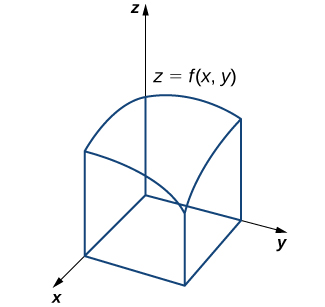
So far, we have studied functions of one variable only. Such functions can be represented visually using graphs in two dimensions; however, there is no good reason to restrict our investigation to two dimensions. Suppose, for example, that instead of determining the velocity of an object moving along a coordinate axis, we want to determine the velocity of a rock fired from a catapult at a given time, or of an airplane moving in three dimensions. We might want to graph real-value functions of two variables or determine volumes of solids of the type shown in Figure 2.11. These are only a few of the types of questions that can be asked and answered using multivariable calculus. Informally, multivariable calculus can be characterized as the study of the calculus of functions of two or more variables. However, before exploring these and other ideas, we must first lay a foundation for the study of calculus in one variable by exploring the concept of a limit.
英語のヒント
ここまでは1変数の関数だけを扱ってきた。このような関数は、2次元のグラフで視覚的に表せる。しかし、研究対象を2次元に限る理由はない。たとえば、座標軸に沿って動く物体の速度ではなく、投石機から放たれた石や、3次元空間を飛ぶ飛行機の、ある時刻での速度を求めたいとする。2変数の実数値関数をグラフにしたり、図2.11のような立体の体積を求めたりすることも考えられる。これらは、多変数の微積分によって問い、答えを求められる問題のほんの一部である。大まかにいえば、多変数の微積分とは、2つ以上の変数を持つ関数の微積分を研究する分野である。こうした考え方へ進む前に、まず極限という概念を調べて、1変数の微積分を学ぶ土台を築く必要がある。
OpenStax, Rice University; Calculus Volume 1. · CC BY-NC-SA 4.0
Figure 2.11図 2.11
We can use multivariable calculus to find the volume between a surface defined by a function of two variables and a plane.
多変数の微積分を使うと、2変数関数で定まる曲面と平面の間の体積を求められる。
Key Concepts重要な概念
- Differential calculus arose from trying to solve the problem of determining the slope of a line tangent to a curve at a point. The slope of the tangent line indicates the rate of change of the function, also called the derivative. Calculating a derivative requires finding a limit.微分法は、曲線上のある点での接線の傾きを求める問題から生まれた。接線の傾きはその点での関数の変化率を表し、微分係数と呼ばれる。微分係数を計算するには、極限を求める必要がある。
- Integral calculus arose from trying to solve the problem of finding the area of a region between the graph of a function and the x-axis. We can approximate the area by dividing it into thin rectangles and summing the areas of these rectangles. This summation leads to the value of a function called the integral. The integral is also calculated by finding a limit and, in fact, is related to the derivative of a function.積分法は、関数のグラフとx軸の間の領域の面積を求める問題から生まれた。細い長方形に分け、その面積を足し合わせれば、面積を近似できる。この和の極限が積分と呼ばれる値になる。積分も極限によって計算され、実は関数の微分と関係している。
- Multivariable calculus enables us to solve problems in three-dimensional space, including determining motion in space and finding volumes of solids.多変数の微積分を使うと、空間内の運動や立体の体積など、3次元空間の問題を解くことができる。
Key Equations重要な式
Slope of a Secant Line 割線の傾き |
|
Average Velocity over Interval 区間での平均速度 |
Exercises 1–3練習問題 1–3
For the following exercises, points and are on the graph of the function
以下の問題では、点とは、関数のグラフ上にある。
Exercise 1問題 1
[T] Complete the following table with the appropriate values: y-coordinate of Q, the point and the slope of the secant line passing through points P and Q. Round your answer to eight significant digits.
[T] 点Qのy座標、点の座標、点PとQを通る割線の傾きを求めて、次の表を完成させなさい。答えは有効数字8桁に丸める。
x |
y |
msec |
|
|---|---|---|---|
1.1 |
a. |
e. |
i. |
1.01 |
b. |
f. |
j. |
1.001 |
c. |
g. |
k. |
1.0001 |
d. |
h. |
l. |
Solution解き方
a. 2.2100000; b. 2.0201000; c. 2.0020010; d. 2.0002000; e. (1.1000000, 2.2100000); f. (1.0100000, 2.0201000); g. (1.0010000, 2.0020010); h. (1.0001000, 2.0002000); i. 2.1000000; j. 2.0100000; k. 2.0010000; l. 2.0001000
a. 2.2100000; b. 2.0201000; c. 2.0020010; d. 2.0002000; e. (1.1000000, 2.2100000); f. (1.0100000, 2.0201000); g. (1.0010000, 2.0020010); h. (1.0001000, 2.0002000); i. 2.1000000; j. 2.0100000; k. 2.0010000; l. 2.0001000
Exercise 2問題 2
Use the values in the right column of the table in the preceding exercise to guess the value of the slope of the line tangent to f at
前問の表の右端の列の値を使い、でのfの接線の傾きを推定しなさい。
Exercise 3問題 3
Use the value in the preceding exercise to find the equation of the tangent line at point P. Graph and the tangent line.
前問の値を使い、点Pでの接線の方程式を求めなさい。と接線のグラフを描きなさい。
Solution解き方
Exercises 4–6練習問題 4–6
For the following exercises, points and are on the graph of the function
以下の問題では、点とは、関数のグラフ上にある。
Exercise 4問題 4
[T] Complete the following table with the appropriate values: y-coordinate of Q, the point and the slope of the secant line passing through points P and Q. Round your answer to eight significant digits.
[T] 点Qのy座標、点の座標、点PとQを通る割線の傾きを求めて、次の表を完成させなさい。答えは有効数字8桁に丸める。
x |
y |
msec |
|
|---|---|---|---|
1.1 |
a. |
e. |
i. |
1.01 |
b. |
f. |
j. |
1.001 |
c. |
g. |
k. |
1.0001 |
d. |
h. |
l. |
Exercise 5問題 5
Use the values in the right column of the table in the preceding exercise to guess the value of the slope of the tangent line to f at
前問の表の右端の列の値を使い、でのfの接線の傾きを推定しなさい。
Solution解き方
3
3
Exercise 6問題 6
Use the value in the preceding exercise to find the equation of the tangent line at point P. Graph and the tangent line.
前問の値を使い、点Pでの接線の方程式を求めなさい。と接線のグラフを描きなさい。
Exercises 7–9練習問題 7–9
For the following exercises, points and are on the graph of the function
以下の問題では、点とは、関数のグラフ上にある。
Exercise 7問題 7
[T] Complete the following table with the appropriate values: y-coordinate of Q, the point and the slope of the secant line passing through points P and Q. Round your answer to eight significant digits.
[T] 点Qのy座標、点の座標、点PとQを通る割線の傾きを求めて、次の表を完成させなさい。答えは有効数字8桁に丸める。
x |
y |
msec |
|
|---|---|---|---|
4.1 |
a. |
e. |
i. |
4.01 |
b. |
f. |
j. |
4.001 |
c. |
g. |
k. |
4.0001 |
d. |
h. |
l. |
Solution解き方
a. 2.0248457; b. 2.0024984; c. 2.0002500; d. 2.0000250; e. (4.1000000,2.0248457); f. (4.0100000,2.0024984); g. (4.0010000,2.0002500); h. (4.00010000,2.0000250); i. 0.24845673; j. 0.24984395; k. 0.24998438; l. 0.24999844
a. 2.0248457; b. 2.0024984; c. 2.0002500; d. 2.0000250; e. (4.1000000,2.0248457); f. (4.0100000,2.0024984); g. (4.0010000,2.0002500); h. (4.00010000,2.0000250); i. 0.24845673; j. 0.24984395; k. 0.24998438; l. 0.24999844
Exercise 8問題 8
Use the values in the right column of the table in the preceding exercise to guess the value of the slope of the tangent line to f at
前問の表の右端の列の値を使い、でのfの接線の傾きを推定しなさい。
Exercise 9問題 9
Use the value in the preceding exercise to find the equation of the tangent line at point P.
前問の値を使い、点Pでの接線の方程式を求めなさい。
Solution解き方