第13章F分布と一元配置分散分析
13.3 Facts About the F Distribution13.3 F分布の性質
Here are some facts about the F distribution.
F分布の性質をいくつか示す。
- The curve is not symmetrical but skewed to the right.
英語のヒント
曲線は左右対称ではなく、右に歪んでいる。 - There is a different curve for each set of dfs.自由度の組ごとに、異なる曲線になる。
- The F statistic is greater than or equal to zero.F統計量は0以上である。
- As the degrees of freedom for the numerator and for the denominator get larger, the curve approximates the normal.
英語のヒント
分子と分母の自由度が大きくなるにつれて、曲線は正規分布に近づく。 - Other uses for the F distribution include comparing two variances and two-way Analysis of Variance. Two-Way Analysis is beyond the scope of this chapter.F分布の他の用途には、二つの分散の比較や二元配置分散分析がある。二元配置分散分析は、この章で扱う範囲を超える。
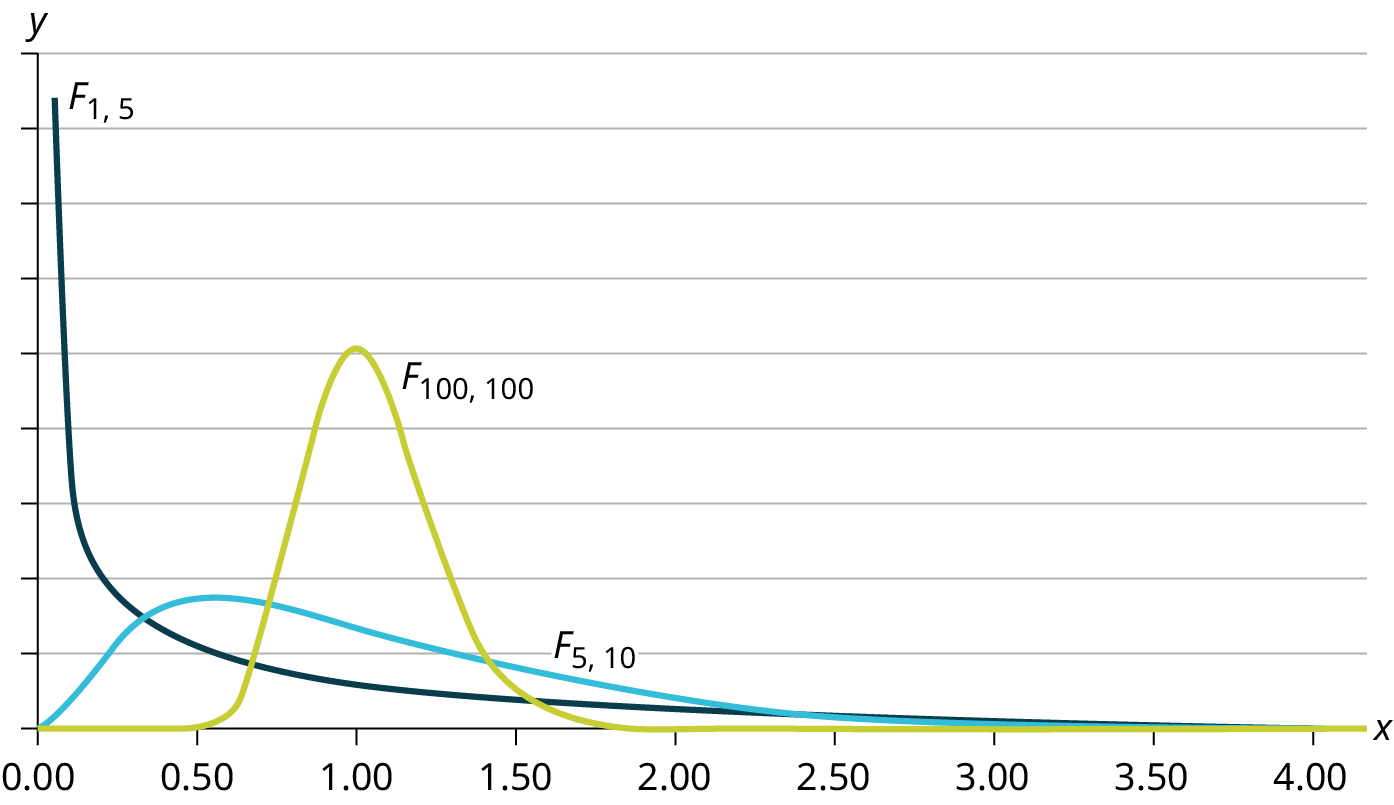
Figure 13.3図 13.3
Example 13.2例題 13.2
Let’s return to the slicing tomato exercise in Example 13.1. The means of the tomato yields under the five mulching conditions are represented by μ1, μ2, μ3, μ4, μ5. We will conduct a hypothesis test to determine if all means are the same or at least one is different. Using a significance level of 5%, test the null hypothesis that there is no difference in mean yields among the five groups against the alternative hypothesis that at least one mean is different from the rest.
英語のヒント
例13.1のスライス用トマトの問題に戻ろう。五つのマルチング条件でのトマト収量の平均を、μ1、μ2、μ3、μ4、μ5で表す。すべての平均が同じか、それとも少なくとも一つが異なるかを判断するために、仮説検定を行う。有意水準5%で、五つの集団間で平均収量に差がないという帰無仮説を、少なくとも一つの平均が他と異なるという対立仮説に対して検定せよ。
Solution解き方
The null and alternative hypotheses are:
帰無仮説と対立仮説は次のとおりである。
H0: μ1 = μ2 = μ3 = μ4 = μ5
Ha: μi ≠ μj some i ≠ j
Ha:あるi ≠ jについて、μi ≠ μj
The one-way ANOVA results are shown in Table 13.10
一元配置分散分析の結果を表13.10に示す。
Source of Variation 変動の要因 |
Sum of Squares (SS) 平方和(SS) |
Degrees of Freedom (df) 自由度(df) |
Mean Square (MS) 平均平方(MS) |
F |
|---|---|---|---|---|
Factor (Between) 因子(群間) |
36,648,561 |
5 – 1 = 4 |
||
Error (Within) 誤差(群内) |
20,446,726 |
15 – 5 = 10 |
||
Total 合計 |
57,095,287 |
15 – 1 = 14 |
Distribution for the test: F4,10
検定に用いる分布:F4,10
df(num) = 5 – 1 = 4
df(denom) = 15 – 5 = 10
Test statistic: F = 4.4810
検定統計量:F = 4.4810
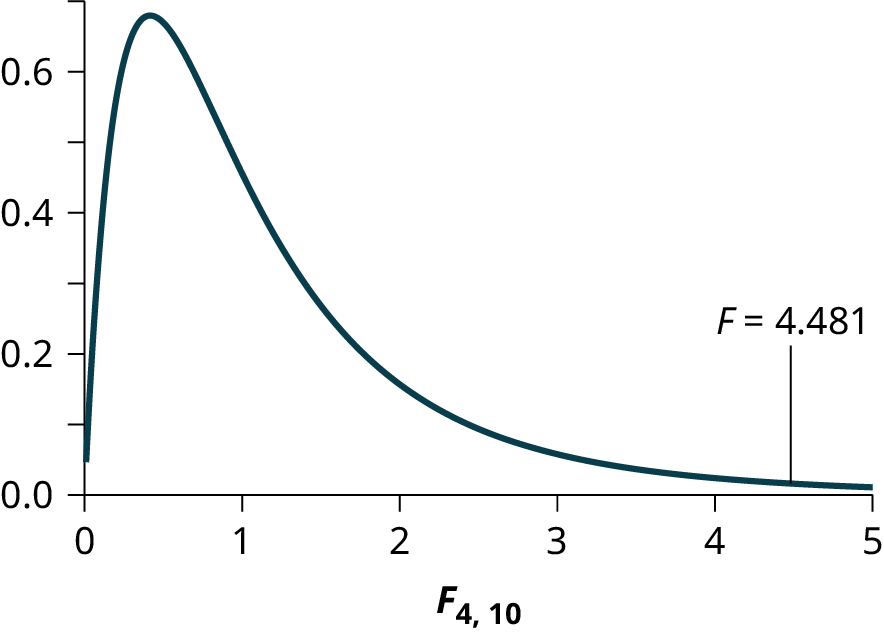
Figure 13.4図 13.4
Probability Statement: p-value = P(F > 4.481) = 0.0248.
確率による表記:p値 = P(F > 4.481) = 0.0248。
Compare α and the p-value: α = 0.05, p-value = 0.0248
αとp値の比較:α = 0.05、p値 = 0.0248
Make a decision: Since α > p-value, we reject H0.
判断:α > p値なので、H0を棄却する。
Conclusion: At the 5% significance level, we have reasonably strong evidence that differences in mean yields for slicing tomato plants grown under different mulching conditions are unlikely to be due to chance alone. We may conclude that at least some of mulches led to different mean yields.
英語のヒント
結論:有意水準5%で、異なるマルチング条件で栽培したスライス用トマトの平均収量の差は、偶然だけによるものとは考えにくい、というかなり強い証拠がある。少なくとも一部の被覆材によって、平均収量が異なったと結論できる。
Using the Calculator電卓の操作
Example 13.3例題 13.3
Four sororities took a random sample of sisters regarding their grade means for the past term. The results are shown in Table 13.13.
英語のヒント
四つの女子学生社交クラブが、それぞれの会員から無作為標本を取り、前学期の成績平均を調べた。結果を表13.13に示す。
Sorority 1 クラブ1 |
Sorority 2 クラブ2 |
Sorority 3 クラブ3 |
Sorority 4 クラブ4 |
|---|---|---|---|
2.17 |
2.63 |
2.63 |
3.79 |
1.85 |
1.77 |
3.78 |
3.45 |
2.83 |
3.25 |
4.00 |
3.08 |
1.69 |
1.86 |
2.55 |
2.26 |
3.33 |
2.21 |
2.45 |
3.18 |
Using a significance level of 1%, is there a difference in mean grades among the sororities?
有意水準1%で、女子学生社交クラブ間の成績平均に差があるか。
Solution解き方
Let μ1, μ2, μ3, μ4 be the population means of the sororities. Remember that the null hypothesis claims that the sorority groups are from the same normal distribution. The alternate hypothesis says that at least two of the sorority groups come from populations with different normal distributions. Notice that the four sample sizes are each five.
μ1、μ2、μ3、μ4を、各クラブの母平均とする。帰無仮説は、各クラブの集団が同じ正規分布から得られた、という主張であることを思い出そう。対立仮説は、少なくとも二つのクラブの集団が、異なる正規分布に従う母集団から得られた、というものである。四つの標本の大きさはいずれも5であることに注意する。
H0: μ1 = μ2 = μ3 = μ4
Ha: Not all of the means μ1, μ2, μ3, μ4 are equal.
英語のヒント
Ha:平均μ1、μ2、μ3、μ4は、すべてが等しいわけではない。
Distribution for the test: F3,16
検定に用いる分布:F3,16
where k = 4 groups and n = 20 samples in total
ここで集団の数はk = 4、標本の大きさの合計はn = 20である。
df(num)= k – 1 = 4 – 1 = 3
df(denom) = n – k = 20 – 4 = 16
Calculate the test statistic: F = 2.23
検定統計量の計算:F = 2.23
Graph:
グラフ:
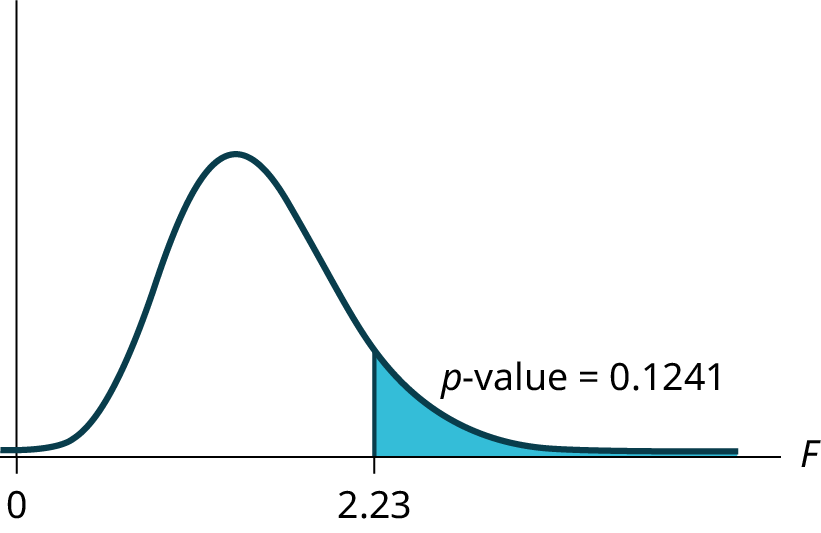


Figure 13.5図 13.5
Probability statement: p-value = P(F > 2.23) = 0.1241
確率による表記:p値 = P(F > 2.23) = 0.1241
Compare α and the p-value: α = 0.01
p-value = 0.1241
α < p-value
p-value = 0.1241
α < p-value
αとp値の比較:α = 0.01、p値 = 0.1241、α < p値
Make a decision: Since α < p-value, you cannot reject H0.
判断:α < p値なので、H0を棄却できない。
Conclusion: There is not sufficient evidence to conclude that there is a difference among the mean grades for the sororities.
結論:女子学生社交クラブ間で成績平均に差があると結論するための、十分な証拠はない。
Using the Calculator電卓の操作
Example 13.4例題 13.4
A fourth grade class is studying the environment. One of the assignments is to grow bean plants in different soils. Tommy chose to grow his bean plants in soil found outside his classroom mixed with dryer lint. Tara chose to grow her bean plants in potting soil bought at the local nursery. Nick chose to grow his bean plants in soil from his mother's garden. No chemicals were used on the plants, only water. They were grown inside the classroom next to a large window. Each child grew five plants. At the end of the growing period, each plant was measured, producing the data (in inches) in Table 13.15.
英語のヒント
小学4年生のクラスが環境について学んでいる。課題の一つは、異なる土で豆を育てることである。トミーは、教室の外の土に乾燥機の糸くずを混ぜたもので育てることにした。タラは、近所の園芸店で買った培養土を使うことにした。ニックは、母親の庭の土を使うことにした。植物には薬品を使わず、水だけを与えた。教室内の大きな窓の横で育てた。それぞれの児童が5株ずつ育て、栽培期間の終わりに各株の高さを測った。得られたデータをインチ単位で表13.15に示す。
Tommy's Plants トミーの豆 |
Tara's Plants タラの豆 |
Nick's Plants ニックの豆 |
|---|---|---|
24 |
25 |
23 |
21 |
31 |
27 |
23 |
23 |
22 |
30 |
20 |
30 |
23 |
28 |
20 |
Does it appear that the three media in which the bean plants were grown produce the same mean height? Test at a 3% level of significance.
英語のヒント
豆を育てた三つの培地では、平均の高さは同じになると考えられるか。有意水準3%で検定せよ。
Solution解き方
This time, we will perform the calculations that lead to the F' statistic. Notice that each group has the same number of plants, so we will use the formula F' = .
今回は、F′統計量を求める計算を行う。各群の株数が同じであることに注意し、公式F′ = を用いる。
First, calculate the sample mean and sample variance of each group.
まず、各群の標本平均と標本分散を求める。
Tommy's Plants トミーの豆 |
Tara's Plants タラの豆 |
Nick's Plants ニックの豆 |
|
|---|---|---|---|
Sample Mean 標本平均 |
24.2 |
25.4 |
24.4 |
Sample Variance 標本分散 |
11.7 |
18.3 |
16.3 |
Next, calculate the variance of the three group means (Calculate the variance of 24.2, 25.4, and 24.4). Variance of the group means = 0.413 =
次に、三つの群の平均の分散を求める(24.2、25.4、24.4の分散を計算する)。群平均の分散 = 0.413 =
Then MSbetween = = (5)(0.413) where n = 5 is the sample size (number of plants each child grew).
すると、MSbetween = = (5)(0.413)となる。ここでn = 5は標本の大きさ(各児童が育てた株数)である。
Calculate the mean of the three sample variances (Calculate the mean of 11.7, 18.3, and 16.3). Mean of the sample variances = 15.433 = s2 pooled
三つの標本分散の平均を求める(11.7、18.3、16.3の平均を計算する)。標本分散の平均 = 15.433 = s2 pooled
Then MSwithin = s2pooled = 15.433.
すると、MSwithin = s2pooled = 15.433となる。
The F statistic (or F ratio) is
F統計量(またはF比)はである。
The dfs for the numerator = the number of groups – 1 = 3 – 1 = 2.
分子の自由度 = 群の数 − 1 = 3 − 1 = 2。
The dfs for the denominator = the total number of samples – the number of groups = 15 – 3 = 12
分母の自由度 = 標本の大きさの合計 − 群の数 = 15 − 3 = 12
The distribution for the test is F2,12 and the F statistic is F = 0.134
検定に用いる分布はF2,12、F統計量はF = 0.134である。
The p-value is P(F > 0.134) = 0.8759.
p値はP(F > 0.134) = 0.8759である。
Decision: Since α = 0.03 and the p-value = 0.8759, do not reject H0. (Why?)
判断:α = 0.03、p値 = 0.8759なので、H0を棄却しない。(なぜか。)
Conclusion: With a 3% level of significance, from the sample data, the evidence is not sufficient to conclude that the mean heights of the bean plants are different.
結論:有意水準3%では、この標本データから、豆の平均の高さが異なると結論するための十分な証拠は得られない。