第13章F分布と一元配置分散分析
Homework宿題
Exercises 48–58練習問題 48–58
Exercise 48問題 48
Three students, Linda, Tuan, and Javier, are given five laboratory rats each for a nutritional experiment. Each rat's weight is recorded in grams. Linda feeds her rats Formula A, Tuan feeds his rats Formula B, and Javier feeds his rats Formula C. At the end of a specified time period, each rat is weighed again, and the net gain in grams is recorded. Using a significance level of 10%, test the hypothesis that the three formulas produce the same mean weight gain.
英語のヒント
栄養実験のために、リンダ、トゥアン、ハビエルの3人の学生に、それぞれ実験用ラット5匹を渡す。各ラットの体重をグラム単位で記録する。リンダは飼料A、トゥアンは飼料B、ハビエルは飼料Cを、自分のラットに与える。一定の期間が過ぎたら、各ラットの体重を再び量り、正味の増加量をグラム単位で記録する。有意水準10%で、三つの飼料による平均体重増加量が同じという仮説を検定せよ。
Linda's rats リンダのラット |
Tuan's rats トゥアンのラット |
Javier's rats ハビエルのラット |
|---|---|---|
43.5 |
47.0 |
51.2 |
39.4 |
40.5 |
40.9 |
41.3 |
38.9 |
37.9 |
46.0 |
46.3 |
45.0 |
38.2 |
44.2 |
48.6 |
Solution解き方
- H0: µL = µT = µJ
- Ha: at least any two of the means are differentHa:少なくとも二つの平均は異なる。
- df(num) = 2; df(denom) = 12df(num) = 2、df(denom) = 12
- F distributionF分布
- 0.67
- 0.5305
- Answers may vary.解答はさまざまである。
- Decision: Do not reject null hypothesis; Conclusion: There is insufficient evidence to conclude that the means are different.判断:帰無仮説を棄却しない。結論:平均が異なると結論するための十分な証拠はない。
Exercise 49問題 49
A grassroots group opposed to a proposed increase in the gas tax claimed that the increase would hurt working-class people the most, since they commute the farthest to work. Suppose that the group randomly surveyed 24 individuals and asked them their daily one-way commuting mileage. The results are in Table 13.21. Using a 5% significance level, test the hypothesis that the three mean commuting mileages are the same.
英語のヒント
ガソリン税の増税案に反対する草の根団体は、労働者階級の人々は通勤距離が最も長いため、増税による被害も最も大きいと主張した。この団体が24人を無作為に調査し、毎日の片道通勤距離をマイル単位で尋ねたとする。結果を表13.21に示す。有意水準5%で、三つの平均通勤距離が同じという仮説を検定せよ。
working-class 労働者階級 |
professional (middle incomes) 専門職(中所得) |
professional (wealthy) 専門職(富裕層) |
|---|---|---|
17.8 |
16.5 |
8.5 |
26.7 |
17.4 |
6.3 |
49.4 |
22.0 |
4.6 |
9.4 |
7.4 |
12.6 |
65.4 |
9.4 |
11.0 |
47.1 |
2.1 |
28.6 |
19.5 |
6.4 |
15.4 |
51.2 |
13.9 |
9.3 |
Use the following information to answer the next two exercises. Table 13.22 lists the number of pages in four different types of magazines.
次の二つの練習問題には、以下の情報を用いる。表13.22は、異なる四種類の雑誌のページ数を示している。
home decorating インテリア |
news ニュース |
health 健康 |
computer コンピューター |
|---|---|---|---|
172 |
87 |
82 |
104 |
286 |
94 |
153 |
136 |
163 |
123 |
87 |
98 |
205 |
106 |
103 |
207 |
197 |
101 |
96 |
146 |
Exercise 50問題 50
Using a significance level of 5%, test the hypothesis that the four magazine types have the same mean length.
有意水準5%で、四種類の雑誌の平均ページ数が同じという仮説を検定せよ。
Exercise 51問題 51
Eliminate one magazine type that you now feel has a mean length different from the others. Redo the hypothesis test, testing that the remaining three means are statistically the same. Use a new solution sheet. Based on this test, are the mean lengths for the remaining three magazines statistically the same?
英語のヒント
他とは平均ページ数が異なると思う雑誌の種類を一つ除外する。新しい解答用紙を使って仮説検定をやり直し、残る三つの平均が統計的に同じかを検定せよ。この検定に基づくと、残る三種類の雑誌の平均ページ数は統計的に同じか。
Solution解き方
- Ha: µc = µn = µh
- At least any two of the magazines have different mean lengths.少なくとも二種類の雑誌で平均ページ数が異なる。
- df(num) = 2, df(denom) = 12df(num) = 2、df(denom) = 12
- F distribtuionF分布
- F = 15.28
- p-value = 0.0005p値 = 0.0005
- Answers may vary.解答はさまざまである。
- Alpha: 0.05α:0.05
- Decision: Reject the Null Hypothesis.判断:帰無仮説を棄却する。
- Reason for decision: p-value < alpha判断の理由:p値 < α
- Conclusion: There is sufficient evidence to conclude that the mean lengths of the magazines are different.結論:雑誌の平均ページ数が異なると結論するための、十分な証拠がある。
Exercise 52問題 52
A researcher wants to know if the mean times (in minutes) that people watch their favorite news station are the same. Suppose that Table 13.23 shows the results of a study.
ある研究者は、人々がお気に入りのニュース局を見る平均時間(分)が、局によって同じかどうかを知りたいと考えている。表13.23に調査の結果を示す。
CNN |
FOX |
Local 地方局 |
|---|---|---|
45 |
15 |
72 |
12 |
43 |
37 |
18 |
68 |
56 |
38 |
50 |
60 |
23 |
31 |
51 |
35 |
22 |
Assume that all distributions are normal, the four population standard deviations are approximately the same, and the data were collected independently and randomly. Use a level of significance of 0.05.
すべての分布は正規分布で、四つの母標準偏差はほぼ等しく、データは互いに独立に無作為に集められたと仮定する。有意水準は0.05とする。
Exercise 53問題 53
Are the means for the final exams the same for all statistics class delivery types? Table 13.24 shows the scores on final exams from several randomly selected classes that used the different delivery types.
統計の授業では、どの授業形態でも期末試験の平均点は同じか。異なる授業形態で行われた授業から、いくつかを無作為に選んで得た期末試験の点数を表13.24に示す。
Online オンライン |
Hybrid 対面とオンラインの併用 |
Face-to-Face 対面 |
|---|---|---|
72 |
83 |
80 |
84 |
73 |
78 |
77 |
84 |
84 |
80 |
81 |
81 |
81 |
86 |
|
79 |
||
82 |
Assume that all distributions are normal, the four population standard deviations are approximately the same, and the data were collected independently and randomly. Use a level of significance of 0.05.
すべての分布は正規分布で、四つの母標準偏差はほぼ等しく、データは互いに独立に無作為に集められたと仮定する。有意水準は0.05とする。
Solution解き方
- H0: μo = μh = μf
- At least two of the means are different.少なくとも二つの平均は異なる。
- df(n) = 2, df(d) = 13df(n) = 2、df(d) = 13
- F2,13
- 0.64
- 0.5437
- Answers may vary.解答はさまざまである。
- Alpha: 0.05α:0.05
- Decision: Do not reject the null hypothesis.判断:帰無仮説を棄却しない。
- Reason for decision: p-value > alpha判断の理由:p値 > α
- Conclusion: The mean scores of different class delivery are not different.結論:異なる授業形態の平均点に差はない。
Exercise 54問題 54
Are the mean number of times a month a person eats out the same for White, Black, Hispanic/Latino and Asian people? Suppose that Table 13.25 shows the results of a study.
1人が1か月に外食する平均回数は、白人、黒人、ヒスパニック/ラティーノ、アジア系の人々で同じか。表13.25に調査の結果を示す。
White 白人 |
Black 黒人 |
Hispanic/Latino ヒスパニック/ラティーノ |
Asian アジア系 |
|---|---|---|---|
6 |
4 |
7 |
8 |
8 |
1 |
3 |
3 |
2 |
5 |
5 |
5 |
4 |
2 |
4 |
1 |
6 |
6 |
7 |
Assume that all distributions are normal, the four population standard deviations are approximately the same, and the data were collected independently and randomly. Use a level of significance of 0.05.
すべての分布は正規分布で、四つの母標準偏差はほぼ等しく、データは互いに独立に無作為に集められたと仮定する。有意水準は0.05とする。
Exercise 55問題 55
Are the mean numbers of daily visitors to a ski resort the same for the three types of snow conditions? Suppose that Table 13.26 shows the results of a study.
スキー場の1日あたりの平均来場者数は、三つの雪の状態で同じか。表13.26に調査の結果を示す。
Powder パウダースノー |
Machine Made 人工雪 |
Hard Packed 硬く圧雪された雪 |
|---|---|---|
1,210 |
2,107 |
2,846 |
1,080 |
1,149 |
1,638 |
1,537 |
862 |
2,019 |
941 |
1,870 |
1,178 |
1,528 |
2,233 |
|
1,382 |
Assume that all distributions are normal, the four population standard deviations are approximately the same, and the data were collected independently and randomly. Use a level of significance of 0.05.
すべての分布は正規分布で、四つの母標準偏差はほぼ等しく、データは互いに独立に無作為に集められたと仮定する。有意水準は0.05とする。
Solution解き方
- H0: μp = μm = μh
- At least any two of the means are different.少なくとも二つの平均は異なる。
- df(n) = 2, df(d) = 12df(n) = 2、df(d) = 12
- F2,12
- 3.13
- 0.0807
- Answers may vary.解答はさまざまである。
- Alpha: 0.05α:0.05
- Decision: Do not reject the null hypothesis.判断:帰無仮説を棄却しない。
- Reason for decision: p-value > alpha判断の理由:p値 > α
- Conclusion: There is not sufficient evidence to conclude that the mean numbers of daily visitors are different.結論:1日あたりの平均来場者数が異なると結論するための、十分な証拠はない。
Exercise 56問題 56
Sanjay made identical paper airplanes out of three different weights of paper, light, medium and heavy. He made four airplanes from each of the weights, and launched them himself across the room. Here are the distances (in meters) that his planes flew.
英語のヒント
サンジェイは、軽い・中くらい・重いという三種類の重さの紙を使い、同じ形の紙飛行機を作った。それぞれの重さの紙で4機ずつ作り、自分で部屋の端から飛ばした。各飛行機が飛んだ距離を、メートル単位で以下に示す。
Paper Type/Trial 紙の種類/試行 |
Trial 1 試行1 |
Trial 2 試行2 |
Trial 3 試行3 |
Trial 4 試行4 |
|---|---|---|---|---|
Heavy 重い |
5.1 meters 5.1メートル |
3.1 meters 3.1メートル |
4.7 meters 4.7メートル |
5.3 meters 5.3メートル |
Medium 中くらい |
4 meters 4メートル |
3.5 meters 3.5メートル |
4.5 meters 4.5メートル |
6.1 meters 6.1メートル |
Light 軽い |
3.1 meters 3.1メートル |
3.3 meters 3.3メートル |
2.1 meters 2.1メートル |
1.9 meters 1.9メートル |
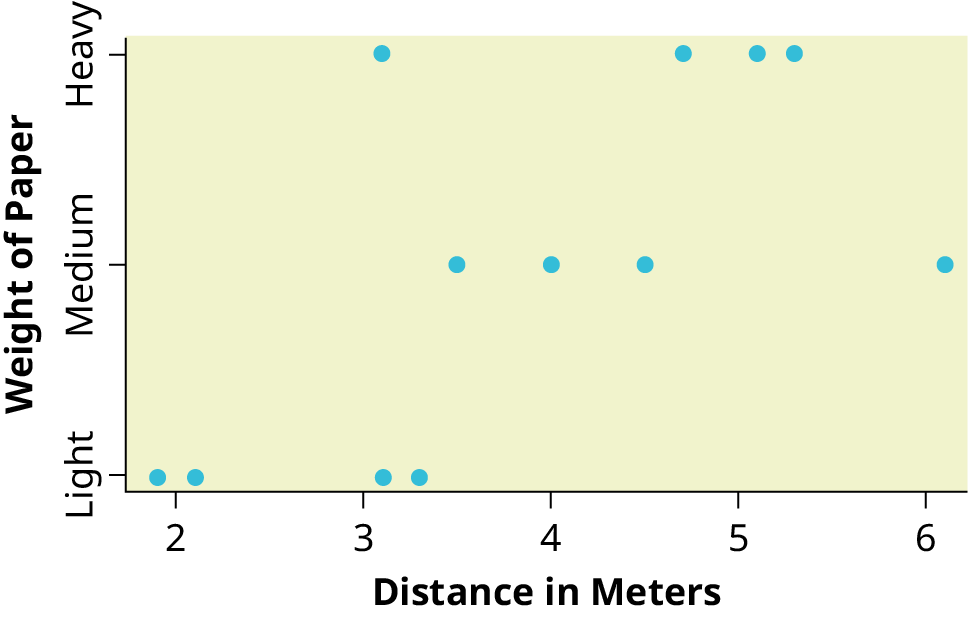
Figure 13.6図 13.6
- Take a look at the data in the graph. Look at the spread of data for each group (light, medium, heavy). Does it seem reasonable to assume a normal distribution with the same variance for each group? Yes or No.グラフのデータを見て、各群(軽い、中くらい、重い)のデータの広がりを確認せよ。各群について、同じ分散の正規分布を仮定するのは妥当と思われるか。「はい」か「いいえ」で答えよ。
- Why is this a balanced design?これが釣り合い型計画であるのはなぜか。
- Calculate the sample mean and sample standard deviation for each group.各群の標本平均と標本標準偏差を計算せよ。
- Does the weight of the paper have an effect on how far the plane will travel? Use a 1% level of significance. Complete the test using the method shown in the bean plant example in Example 13.4.紙の重さは、飛行機の飛距離に影響するか。有意水準を1%とし、例13.4の豆の例と同じ方法で検定を完了せよ。
- variance of the group means __________群平均の分散 __________
- MSbetween= ___________
- mean of the three sample variances ___________三つの標本分散の平均 ___________
- MSwithin = _____________
- F statistic = ____________F統計量 = ____________
- df(num) = __________, df(denom) = ___________df(num) = __________、df(denom) = ___________
- number of groups _______群の数 _______
- number of observations _______観測値の数 _______
- p-value = __________ (P(F > _______) = __________)p値 = __________(P(F > _______) = __________)
- Graph the p-value.p値をグラフで表せ。
- decision: _______________________判断:_______________________
- conclusion: _______________________________________________________________結論:_______________________________________________________________
Exercise 57問題 57
DDT is a pesticide that has been banned from use in the United States and most other areas of the world. It is quite effective, but persisted in the environment and over time became seen as harmful to higher-level organisms. Famously, egg shells of eagles and other raptors were believed to be thinner and prone to breakage in the nest because of ingestion of DDT in the food chain of the birds.
英語のヒント
DDTは、米国と世界の大部分の地域で使用が禁止されている農薬である。非常に効果が高いが、環境中に残留し、やがて高等生物に有害だとみなされるようになった。よく知られた例として、ワシなどの猛禽類の卵の殻は、食物連鎖を通じたDDTの摂取によって薄くなり、巣の中で割れやすくなったと考えられた。
An experiment was conducted on the number of eggs (fecundity) laid by female fruit flies. There are three groups of flies. One group was bred to be resistant to DDT (the RS group). Another was bred to be especially susceptible to DDT (SS). Finally there was a control line of non-selected or typical fruitflies (NS). Here are the data:
英語のヒント
雌のショウジョウバエが産む卵の数(繁殖力)について実験を行った。ハエを三つの群に分けた。一つは、DDTへの抵抗性が高くなるように育種した群(RS群)。もう一つは、DDTの影響を特に受けやすくなるように育種した群(SS群)である。最後に、選抜していない通常のショウジョウバエを対照系統(NS群)とした。データを以下に示す。
RS |
SS |
NS |
RS |
SS |
NS |
|---|---|---|---|---|---|
12.8 |
38.4 |
35.4 |
22.4 |
23.1 |
22.6 |
21.6 |
32.9 |
27.4 |
27.5 |
29.4 |
40.4 |
14.8 |
48.5 |
19.3 |
20.3 |
16 |
34.4 |
23.1 |
20.9 |
41.8 |
38.7 |
20.1 |
30.4 |
34.6 |
11.6 |
20.3 |
26.4 |
23.3 |
14.9 |
19.7 |
22.3 |
37.6 |
23.7 |
22.9 |
51.8 |
22.6 |
30.2 |
36.9 |
26.1 |
22.5 |
33.8 |
29.6 |
33.4 |
37.3 |
29.5 |
15.1 |
37.9 |
16.4 |
26.7 |
28.2 |
38.6 |
31 |
29.5 |
20.3 |
39 |
23.4 |
44.4 |
16.9 |
42.4 |
29.3 |
12.8 |
33.7 |
23.2 |
16.1 |
36.6 |
14.9 |
14.6 |
29.2 |
23.6 |
10.8 |
47.4 |
27.3 |
12.2 |
41.7 |
The values are the average number of eggs laid daily for each of 75 flies (25 in each group) over the first 14 days of their lives. Using a 1% level of significance, are the mean rates of egg selection for the three strains of fruitfly different? If so, in what way? Specifically, the researchers were interested in whether or not the selectively bred strains were different from the nonselected line, and whether the two selected lines were different from each other.
英語のヒント
値は、75匹のハエ(各群25匹)それぞれについて、生後最初の14日間における1日あたりの平均産卵数を示す。有意水準1%で、三つのショウジョウバエの系統の平均的な卵の選択率に違いがあるか。あるなら、どのように異なるか。具体的には、研究者は、選択育種した系統が選抜していない系統と異なるかどうか、また、選抜した二つの系統が互いに異なるかどうかに関心を持っていた。
Here is a chart of the three groups:
三つの群の図を以下に示す。
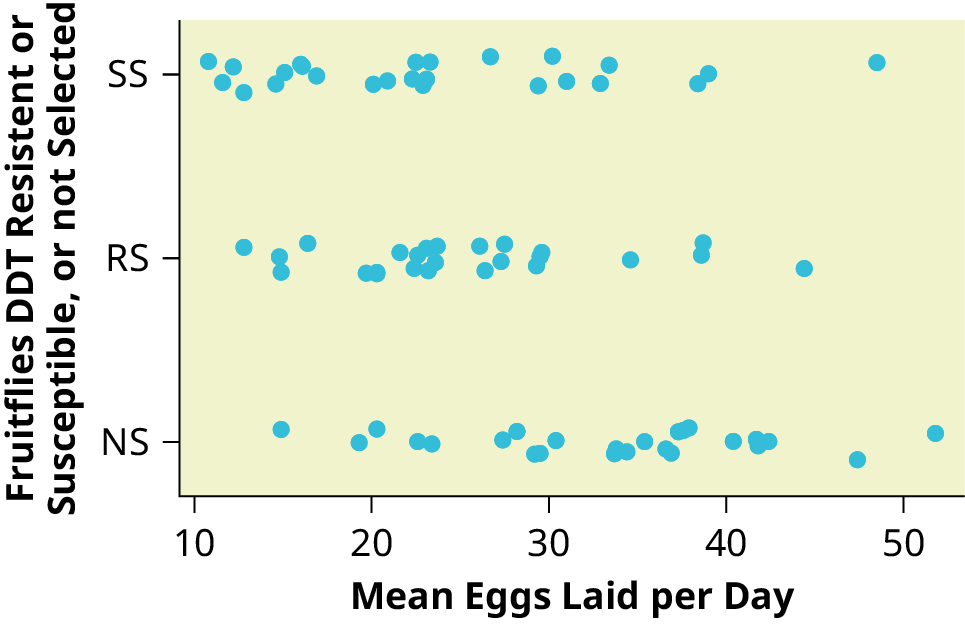
Figure 13.7図 13.7
Solution解き方
The data appear normally distributed from the chart and of similar spread. There do not appear to be any serious outliers, so we may proceed with our ANOVA calculations, to see if we have good evidence of a difference between the three groups.
英語のヒント
図から、データは正規分布に従い、広がりも同程度と考えられる。極端な外れ値も見当たらないので、分散分析の計算に進み、三つの群に差があるという十分な証拠が得られるかを調べられる。
H0: μ1 = μ2 = μ3;
Ha: μi ≠ μj some i ≠ j.
Ha:あるi ≠ jについて、μi ≠ μj。
Define μ1, μ2, μ3, as the population mean number of eggs laid by the three groups of fruit flies.
μ1、μ2、μ3を、三つのショウジョウバエの群の産卵数の母平均と定義する。
F statistic = 8.6657;
F統計量 = 8.6657
p-value = 0.0004
p値 = 0.0004
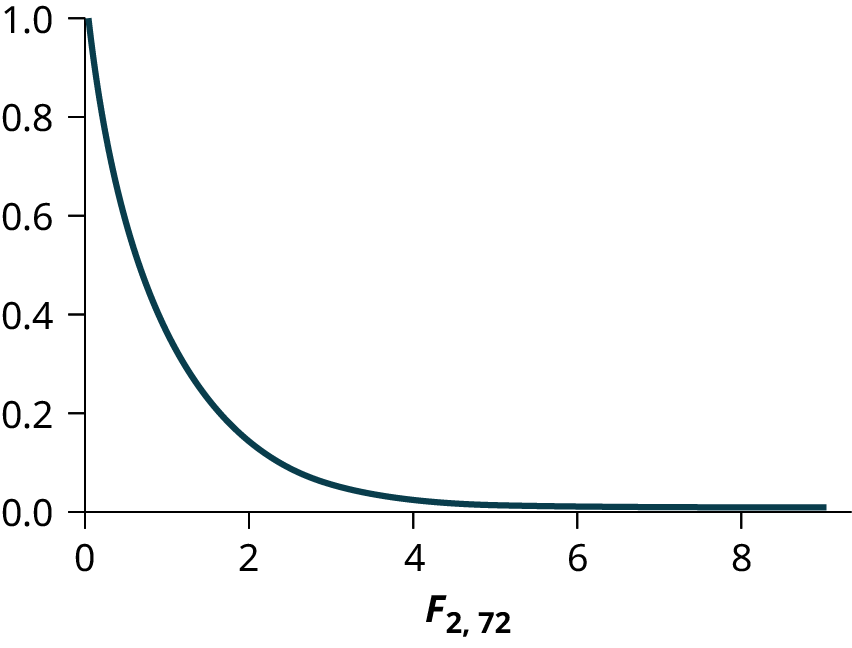


Figure 13.8図 13.8
Decision: Since the p-value is less than the level of significance of 0.01, we reject the null hypothesis.
判断:p値が有意水準0.01より小さいので、帰無仮説を棄却する。
Conclusion: We have good evidence that the average number of eggs laid during the first 14 days of life for these three strains of fruitflies are different.
結論:三つのショウジョウバエの系統では、生後最初の14日間の平均産卵数が異なるという、十分な証拠がある。
Interestingly, if you perform a two sample t-test to compare the RS and NS groups they are significantly different (p = 0.0013). Similarly, SS and NS are significantly different (p = 0.0006). However, the two selected groups, RS and SS are not significantly different (p = 0.5176). Thus we appear to have good evidence that selection either for resistance or for susceptibility involves a reduced rate of egg production (for these specific strains) as compared to flies that were not selected for resistance or susceptibility to DDT. Here, genetic selection has apparently involved a loss of fecundity.
英語のヒント
興味深いことに、RS群とNS群を比較する2標本t検定を行うと、両群の差は有意である(p = 0.0013)。同様に、SS群とNS群の差も有意である(p = 0.0006)。しかし、選抜した二つの群、RS群とSS群の差は有意ではない(p = 0.5176)。したがって、これらの系統については、抵抗性で選抜しても感受性で選抜しても、DDTへの抵抗性や感受性による選抜を行わなかったハエに比べて、産卵率が低下するという十分な証拠が得られたようである。ここでは、遺伝的な選抜に伴って繁殖力が失われたと考えられる。
Exercise 58問題 58
The data shown is the recorded body temperatures of 130 subjects as estimated from available histograms.
英語のヒント
示したデータは、利用できるヒストグラムから推定した、被験者130人の記録された体温である。
Traditionally we are taught that the normal human body temperature is 98.6 F. This is not quite correct for everyone. Are the mean temperatures among the four groups different?
従来、人の正常な体温は華氏98.6度だと教えられてきた。しかし、すべての人にこれがそのまま当てはまるわけではない。四つの群の平均体温は異なるか。
Calculate 95% confidence intervals for the mean body temperature in each group and comment about the confidence intervals.
各群の平均体温について95%信頼区間を求め、その信頼区間について述べよ。
FL |
FH |
ML |
MH |
FL |
FH |
ML |
MH |
|---|---|---|---|---|---|---|---|
96.4 |
96.8 |
96.3 |
96.9 |
98.4 |
98.6 |
98.1 |
98.6 |
96.7 |
97.7 |
96.7 |
97 |
98.7 |
98.6 |
98.1 |
98.6 |
97.2 |
97.8 |
97.1 |
97.1 |
98.7 |
98.6 |
98.2 |
98.7 |
97.2 |
97.9 |
97.2 |
97.1 |
98.7 |
98.7 |
98.2 |
98.8 |
97.4 |
98 |
97.3 |
97.4 |
98.7 |
98.7 |
98.2 |
98.8 |
97.6 |
98 |
97.4 |
97.5 |
98.8 |
98.8 |
98.2 |
98.8 |
97.7 |
98 |
97.4 |
97.6 |
98.8 |
98.8 |
98.3 |
98.9 |
97.8 |
98 |
97.4 |
97.7 |
98.8 |
98.8 |
98.4 |
99 |
97.8 |
98.1 |
97.5 |
97.8 |
98.8 |
98.9 |
98.4 |
99 |
97.9 |
98.3 |
97.6 |
97.9 |
99.2 |
99 |
98.5 |
99 |
97.9 |
98.3 |
97.6 |
98 |
99.3 |
99 |
98.5 |
99.2 |
98 |
98.3 |
97.8 |
98 |
99.1 |
98.6 |
99.5 |
|
98.2 |
98.4 |
97.8 |
98 |
99.1 |
98.6 |
||
98.2 |
98.4 |
97.8 |
98.3 |
99.2 |
98.7 |
||
98.2 |
98.4 |
97.9 |
98.4 |
99.4 |
99.1 |
||
98.2 |
98.4 |
98 |
98.4 |
99.9 |
99.3 |
||
98.2 |
98.5 |
98 |
98.6 |
100 |
99.4 |
||
98.2 |
98.6 |
98 |
98.6 |
100.8 |