第13章F分布と一元配置分散分析
13.4 Test of Two Variances13.4 二つの分散の検定
Another of the uses of the F distribution is testing two variances. It is often desirable to compare two variances rather than two averages. For instance, college administrators would like two college professors grading exams to have the same variation in their grading. In order for a lid to fit a container, the variation in the lid and the container should be the same. A supermarket might be interested in the variability of check-out times for two checkers.
英語のヒント
F分布のもう一つの用途は、二つの分散の検定である。二つの平均よりも、二つの分散を比較したい場合がよくある。例えば大学の管理者は、試験を採点する二人の教員の採点のばらつきが、同程度であることを望むだろう。ふたが容器に合うには、ふたと容器のばらつきが同じであるべきだ。スーパーマーケットなら、二人のレジ係の会計処理時間のばらつきに関心を持つかもしれない。
In order to perform a F test of two variances, it is important that the following are true:
二つの分散のF検定を行うには、次の条件が満たされていることが重要である。
- The populations from which the two samples are drawn are normally distributed.二つの標本を抽出した母集団が、正規分布に従う。
- The two populations are independent of each other.二つの母集団が互いに独立である。
Unlike most other tests in this book, the F test for equality of two variances is very sensitive to deviations from normality. If the two distributions are not normal, the test can give higher p-values than it should, or lower ones, in ways that are unpredictable. Many texts suggest that students not use this test at all, but in the interest of completeness we include it here.
英語のヒント
本書の他の多くの検定とは異なり、二つの分散の等しさを調べるF検定は、正規性からのずれに非常に敏感である。二つの分布が正規分布でない場合、p値が本来より高くなったり低くなったりし、その方向は予測できない。多くの教科書は、学生がこの検定をまったく使わないよう勧めているが、ここでは内容を網羅するために取り上げる。
Suppose we sample randomly from two independent normal populations. Let and be the population variances and and be the sample variances. Let the sample sizes be n1 and n2. Since we are interested in comparing the two sample variances, we use the F ratio:
互いに独立な二つの正規母集団から、無作為に標本を取り出すとする。母分散をと、標本分散をととする。標本の大きさをn1とn2とする。二つの標本分散を比較したいので、次のF比を用いる。
F has the distribution F ~ F(n1 – 1, n2 – 1)
Fは、F ~ F(n1 – 1, n2 – 1)という分布に従う。
where n1 – 1 are the degrees of freedom for the numerator and n2 – 1 are the degrees of freedom for the denominator.
ここで、n1 – 1は分子の自由度、n2 – 1は分母の自由度である。
If the null hypothesis is , then the F Ratio becomes .
帰無仮説がならば、F比はとなる。
If the two populations have equal variances, then and are close in value and is close to one. But if the two population variances are very different, and tend to be very different, too. Choosing as the larger sample variance causes the ratio to be greater than one. If and are far apart, then is a large number.
二つの母集団の分散が等しければ、とは近い値になり、は1に近くなる。しかし、二つの母分散が大きく異なれば、とも大きく異なる傾向がある。大きい方の標本分散をとすれば、比は1より大きくなる。とが大きく離れていれば、は大きな数になる。
Therefore, if F is close to one, the evidence favors the null hypothesis (the two population variances are equal). But if F is much larger than one, then the evidence is against the null hypothesis. A test of two variances may be left, right, or two-tailed.
英語のヒント
したがって、Fが1に近ければ、証拠は帰無仮説(二つの母分散が等しい)を支持する。しかし、Fが1よりはるかに大きければ、証拠は帰無仮説に反する。二つの分散の検定は、左片側、右片側、両側のいずれにもなりうる。
Example 13.5例題 13.5
Two college instructors are interested in whether or not there is any variation in the way they grade math exams. They each grade the same set of 30 exams. The first instructor's grades have a variance of 52.3. The second instructor's grades have a variance of 89.9. Test the claim that the first instructor's variance is smaller. (In most colleges, it is desirable for the variances of exam grades to be nearly the same among instructors.) The level of significance is 10%.
英語のヒント
二人の大学教員が、自分たちの数学試験の採点にばらつきの違いがあるかどうかに関心を持っている。それぞれが同じ30枚の答案を採点した。1人目の採点結果の分散は52.3、2人目は89.9だった。1人目の教員の分散が小さいという主張を検定せよ。(多くの大学では、教員間で試験の採点結果の分散がほぼ同じであることが望まれる。)有意水準は10%とする。
Solution解き方
Let 1 and 2 be the subscripts that indicate the first and second instructor, respectively.
英語のヒント
添字1と2は、それぞれ1人目と2人目の教員を表す。
n1 = n2 = 30.
H0: and Ha:
H0:、Ha:
Calculate the test statistic: By the null hypothesis , the F statistic is:
検定統計量を求める。帰無仮説の下で、F統計量は次のようになる。
Distribution for the test: F29,29 where n1 – 1 = 29 and n2 – 1 = 29.
検定に用いる分布:F29,29。ここでn1 – 1 = 29、n2 – 1 = 29である。
Graph: This test is left tailed.
グラフ:この検定は左片側検定である。
Draw the graph labeling and shading appropriately.
グラフを描き、適切なラベルと塗りつぶしを付ける。
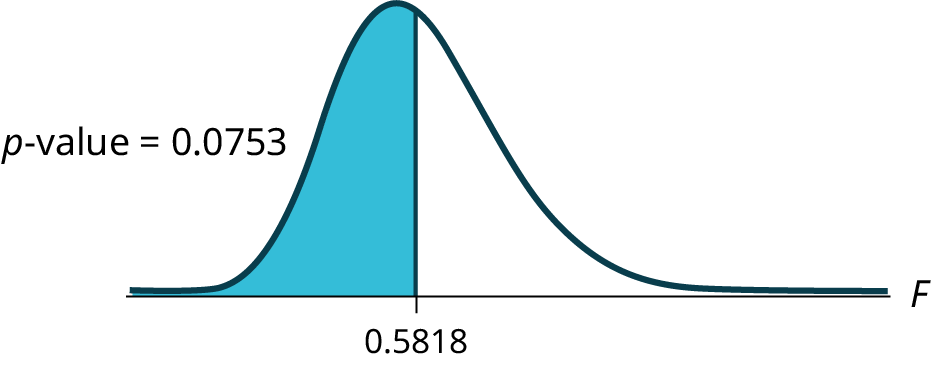

Figure 13.9図 13.9
Probability statement: p-value = P(F < 0.5818) = 0.0753
確率による表記:p値 = P(F < 0.5818) = 0.0753
Compare α and the p-value: α = 0.10 α > p-value.
αとp値の比較:α = 0.10、α > p値。
Make a decision: Since α > p-value, reject H0.
判断:α > p値なので、H0を棄却する。
Conclusion: With a 10% level of significance, from the data, there is sufficient evidence to conclude that the variance in grades for the first instructor is smaller.
結論:有意水準10%では、このデータから、1人目の教員の採点結果の分散が小さいと結論するための十分な証拠が得られる。