第13章F分布と一元配置分散分析
13.1 One-Way ANOVA13.1 一元配置分散分析
The purpose of a one-way ANOVA test is to determine the existence of a statistically significant difference among several group means. The test actually uses variances to help determine if the means are equal or not. In order to perform a one-way ANOVA test, there are five basic assumptions to be fulfilled:
英語のヒント
一元配置分散分析の目的は、複数の集団の平均の間に統計的に有意な差が存在するかどうかを調べることである。この検定では、平均が等しいかどうかを判断するために、実際には分散を利用する。一元配置分散分析を行うには、次の五つの基本的な仮定が満たされていなければならない。
- Each population from which a sample is taken is assumed to be normal.
英語のヒント
標本を取り出す各母集団は、正規分布に従うと仮定する。 - All samples are randomly selected and independent.すべての標本は無作為に選ばれ、互いに独立である。
- The populations are assumed to have equal standard deviations (or variances).母集団の標準偏差(または分散)は等しいと仮定する。
- The factor is a categorical variable.因子はカテゴリ変数である。
- The response is a numerical variable.応答は数値変数である。
The Null and Alternative Hypotheses帰無仮説と対立仮説
The null hypothesis is simply that all the group population means are the same. The alternative hypothesis is that at least one pair of means is different. For example, if there are k groups:
英語のヒント
帰無仮説は、すべての集団の母平均が同じ、というものである。対立仮説は、少なくとも一組の平均が異なる、というものである。例えば、集団がk個ある場合には、次のようになる。
H0: μ1 = μ2 = μ3 = ... = μk
H0:μ1 = μ2 = μ3 = ... = μk
Ha: At least two of the group means μ1, μ2, μ3, ..., μk are not equal. That is, μi ≠ μj for some i ≠ j.
Ha:集団の平均μ1、μ2、μ3、...、μkのうち、少なくとも二つは等しくない。つまり、あるi ≠ jについてμi ≠ μjである。
The graphs, a set of box plots representing the distribution of values with the group means indicated by a horizontal line through the box, help in the understanding of the hypothesis test. In the first graph (blue box plots), H0: μ1 = μ2 = μ3 and the three populations have the same distribution if the null hypothesis is true. The variance of the combined data is approximately the same as the variance of each of the populations.
英語のヒント
グラフには各集団の値の分布を箱ひげ図で示し、箱を横切る水平線で集団の平均を示している。これらのグラフは仮説検定を理解する助けとなる。最初のグラフ(青い箱ひげ図)ではH0:μ1 = μ2 = μ3であり、帰無仮説が正しければ、三つの母集団は同じ分布を持つ。すべてを合わせたデータの分散は、各母集団の分散とほぼ等しい。
If the null hypothesis is false, then the variance of the combined data is larger which is caused by the different means as shown in the second graph (green box plots).
英語のヒント
帰無仮説が誤っている場合は、二番目のグラフ(緑の箱ひげ図)に示すように、平均が異なることによって、すべてを合わせたデータの分散はより大きくなる。
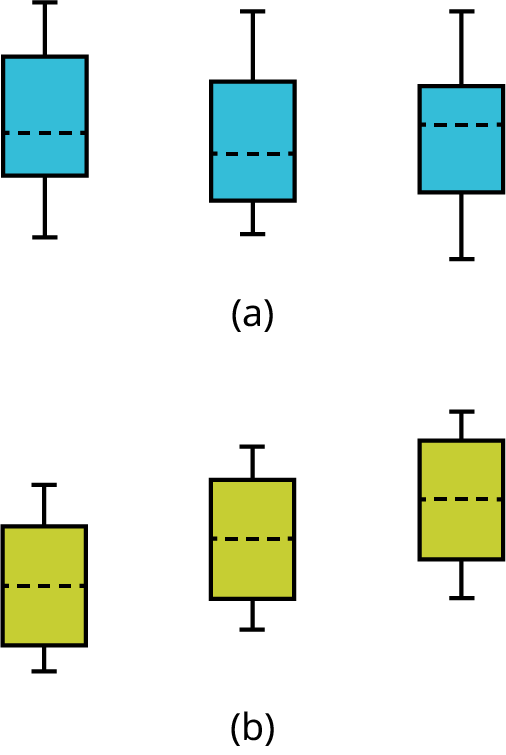

Figure 13.2図 13.2
(a) H0 is true. All means are the same; the differences are due to random variation. (b) H0 is not true. The means are not all the same; the differences are too large to be due to random variation.
(a)H0は正しい。すべての平均は同じで、差は無作為な変動によって生じる。(b)H0は正しくない。平均はすべて同じではなく、差は無作為な変動だけで生じたと考えるには大きすぎる。
Chapter Review章の復習
Analysis of variance extends the comparison of two groups to several, each a level of a categorical variable (factor). Samples from each group are independent, and must be randomly selected from normal populations with equal variances. We test the null hypothesis of equal means of the response in every group versus the alternative hypothesis of one or more group means being different from the others. A one-way ANOVA hypothesis test determines if several population means are equal. The distribution for the test is the F distribution with two different degrees of freedom.
英語のヒント
分散分析は、二つの集団の比較を複数の集団へ拡張する。各集団は、カテゴリ変数(因子)の一つの水準に対応する。各集団からの標本は互いに独立であり、分散の等しい正規母集団から無作為に選ばれていなければならない。すべての集団で応答の平均が等しいという帰無仮説を、一つ以上の集団の平均が他と異なるという対立仮説に対して検定する。一元配置分散分析による仮説検定は、複数の母平均が等しいかどうかを判断する。この検定に用いる分布は、異なる二つの自由度を持つF分布である。
- Each population from which a sample is taken is assumed to be normal.標本を取り出す各母集団は、正規分布に従うと仮定する。
- All samples are randomly selected and independent.すべての標本は無作為に選ばれ、互いに独立である。
- The populations are assumed to have equal standard deviations (or variances).母集団の標準偏差(または分散)は等しいと仮定する。
Assumptions:仮定:
Exercises 1–8練習問題 1–8
Use the following information to answer the next five exercises. There are five basic assumptions that must be fulfilled in order to perform a one-way ANOVA test. What are they?
次の五つの練習問題には、以下の情報を用いる。一元配置分散分析を行うには、五つの基本的な仮定が満たされていなければならない。それらは何か。
Exercise 1問題 1
Write one assumption.
仮定を一つ書け。
Solution解き方
Each population from which a sample is taken is assumed to be normal.
標本を取り出す各母集団は、正規分布に従うと仮定する。
Exercise 2問題 2
Write another assumption.
別の仮定を書け。
Exercise 3問題 3
Write a third assumption.
三つ目の仮定を書け。
Solution解き方
The populations are assumed to have equal standard deviations (or variances).
母集団の標準偏差(または分散)は等しいと仮定する。
Exercise 4問題 4
Write a fourth assumption.
四つ目の仮定を書け。
Exercise 5問題 5
Write the final assumption.
最後の仮定を書け。
Solution解き方
The response is a numerical value.
応答は数値である。
Exercise 6問題 6
State the null hypothesis for a one-way ANOVA test if there are four groups.
集団が四つある場合の、一元配置分散分析の帰無仮説を述べよ。
Exercise 7問題 7
State the alternative hypothesis for a one-way ANOVA test if there are three groups.
集団が三つある場合の、一元配置分散分析の対立仮説を述べよ。
Solution解き方
Ha: At least two of the group means μ1, μ2, μ3 are not equal.
Ha:集団の平均μ1、μ2、μ3のうち、少なくとも二つは等しくない。
Exercise 8問題 8
When do you use an ANOVA test?
分散分析はどのようなときに用いるか。
Homework宿題
Exercises 9–10練習問題 9–10
Exercise 9問題 9
Three different traffic routes are tested for mean driving time. The entries in the Table 13.1 are the driving times in minutes on the three different routes.
異なる三つの経路について、平均運転時間を検定する。表13.1の値は、それぞれの経路の運転時間を分単位で表したものである。
Route 1 経路1 |
Route 2 経路2 |
Route 3 経路3 |
|---|---|---|
30 |
27 |
16 |
32 |
29 |
41 |
27 |
28 |
22 |
35 |
36 |
31 |
State SSbetween, SSwithin, and the F statistic.
SSbetween、SSwithin、およびF統計量を示せ。
Solution解き方
SSbetween = 26
SSwithin = 441
F = 0.2653
SSwithin = 441
F = 0.2653
Exercise 10問題 10
Suppose a group is interested in determining whether teenagers obtain their drivers licenses at approximately the same average age across the country. Suppose that the following data are randomly collected from five teenagers in each region of the country. The numbers represent the age at which teenagers obtained their drivers licenses.
英語のヒント
あるグループが、10代の若者の運転免許取得年齢の平均は全国でほぼ同じかどうかを調べたいと考えている。国内の各地域で、10代の若者5人から次のデータを無作為に集めたとする。数値は、それぞれの若者が運転免許を取得した年齢を表す。
Northeast 北東部 |
South 南部 |
West 西部 |
Central 中部 |
East 東部 |
|
|---|---|---|---|---|---|
16.3 |
16.9 |
16.4 |
16.2 |
17.1 |
|
16.1 |
16.5 |
16.5 |
16.6 |
17.2 |
|
16.4 |
16.4 |
16.6 |
16.5 |
16.6 |
|
16.5 |
16.2 |
16.1 |
16.4 |
16.8 |
|
State the hypotheses.
仮説を述べよ。
H0: ____________
H0:____________
Ha: ____________
Ha:____________
Analysis of Variance
分散分析
also referred to as ANOVA, is a method of testing whether or not the means of three or more populations are equal. The method is applicable if:
英語のヒント
ANOVAとも呼ばれ、三つ以上の母集団の平均が等しいかどうかを検定する方法。次の場合に適用できる。
- all populations of interest are normally distributed.関心の対象となるすべての母集団が正規分布に従う。
- the populations have equal standard deviations.母集団の標準偏差が等しい。
- samples (not necessarily of the same size) are randomly and independently selected from each population.各母集団から標本を無作為に、互いに独立に選ぶ。標本の大きさは必ずしも同じでなくてよい。
The test statistic for analysis of variance is the F-ratio.
分散分析の検定統計量はF比である。
One-Way ANOVA
一元配置分散分析
a method of testing whether or not the means of three or more populations are equal; the method is applicable if:
三つ以上の母集団の平均が等しいかどうかを検定する方法。次の場合に適用できる。
- all populations of interest are normally distributed.関心の対象となるすべての母集団が正規分布に従う。
- the populations have equal standard deviations.母集団の標準偏差が等しい。
- samples (not necessarily of the same size) are randomly and independently selected from each population.各母集団から標本を無作為に、互いに独立に選ぶ。標本の大きさは必ずしも同じでなくてよい。
- there is one independent variable and one dependent variable.独立変数と従属変数が一つずつある。
The test statistic for analysis of variance is the F-ratio.
分散分析の検定統計量はF比である。
Variance
分散
mean of the squared deviations from the mean; the square of the standard deviation. For a set of data, a deviation can be represented as x – where x is a value of the data and is the sample mean. The sample variance is equal to the sum of the squares of the deviations divided by the difference of the sample size and one.
英語のヒント
平均からの偏差を二乗した値の平均で、標準偏差の二乗。データの偏差はx − と表せる。ここでxはデータの一つの値、は標本平均である。標本分散は、偏差の二乗の合計を、標本の大きさから1を引いた値で割ったものに等しい。