第2章心理学の研究
2.3 Analyzing Findings2.3 研究結果を分析する
Learning Objectives学習目標
By the end of this section, you will be able to:
この節を学び終えると、次のことができるようになる。
- Explain what a correlation coefficient tells us about the relationship between variables相関係数が変数間の関係について何を教えてくれるかを説明する
- Recognize that correlation does not indicate a cause-and-effect relationship between variables相関は変数間の因果関係を示すものではないと認識する
- Discuss our tendency to look for relationships between variables that do not really exist実際には存在しない変数間の関係を探してしまう私たちの傾向について論じる
- Explain random sampling and assignment of participants into experimental and control groups無作為抽出と、実験群・統制群への参加者の無作為割り当てを説明する
- Discuss how experimenter or participant bias could affect the results of an experiment実験者や参加者のバイアスが実験の結果にどのように影響しうるかを論じる
- Identify independent and dependent variables独立変数と従属変数を見分ける
Did you know that as sales in ice cream increase, so does the overall rate of crime? Is it possible that indulging in your favorite flavor of ice cream could send you on a crime spree? Or, after committing crime do you think you might decide to treat yourself to a cone? There is no question that a relationship exists between ice cream and crime (e.g., Harper, 2013), but it would be pretty foolish to decide that one thing actually caused the other to occur.
英語のヒント
アイスクリームの売り上げが増えるにつれて、犯罪の全体的な発生率も上がることを知っているだろうか。お気に入りの味のアイスクリームを思う存分食べると、次々と罪を犯すようになる、などということがありうるのだろうか。あるいは、罪を犯したあとで、自分へのごほうびにアイスクリームを一つ買おうと決めることがあると思うだろうか。アイスクリームと犯罪のあいだに関係が存在することは疑いようがない(e.g., Harper, 2013)。しかし、一方が実際にもう一方を引き起こしたと決めつけるのは、かなり愚かなことだろう。
It is much more likely that both ice cream sales and crime rates are related to the temperature outside. When the temperature is warm, there are lots of people out of their houses, interacting with each other, getting annoyed with one another, and sometimes committing crimes. Also, when it is warm outside, we are more likely to seek a cool treat like ice cream. How do we determine if there is indeed a relationship between two things? And when there is a relationship, how can we discern whether it is attributable to coincidence or causation?
英語のヒント
アイスクリームの売り上げと犯罪率は、どちらも外の気温と関係している可能性のほうがずっと高い。気温が暖かいと、多くの人が家の外に出て、互いにかかわり合い、いら立ち合い、ときには罪を犯す。また、外が暖かいと、私たちはアイスクリームのような冷たいおやつを求めやすくなる。二つの事柄のあいだに本当に関係があるかどうかは、どうすれば判断できるのだろうか。そして関係があるとき、それが偶然によるものか、因果によるものかを、どうすれば見分けられるのだろうか。
Correlational Research相関研究
Correlation means that there is a relationship between two or more variables (such as ice cream consumption and crime), but this relationship does not necessarily imply cause and effect. When two variables are correlated, it simply means that as one variable changes, so does the other. We can measure correlation by calculating a statistic known as a correlation coefficient. A correlation coefficient is a number from -1 to +1 that indicates the strength and direction of the relationship between variables. The correlation coefficient is usually represented by the letter r.
英語のヒント
相関とは、二つ以上の変数(たとえばアイスクリームの消費量と犯罪)のあいだに関係があることを意味する。しかし、この関係は必ずしも原因と結果を意味するわけではない。二つの変数が相関しているというのは、単に、一方の変数が変化するともう一方も変化する、ということである。相関は、相関係数と呼ばれる統計量を計算することで測定できる。相関係数は-1から+1までの数で、変数間の関係の強さと向きを示す。相関係数は通常、rという文字で表される。
The number portion of the correlation coefficient indicates the strength of the relationship. The closer the number is to 1 (be it negative or positive), the more strongly related the variables are, and the more predictable changes in one variable will be as the other variable changes. The closer the number is to zero, the weaker the relationship, and the less predictable the relationship between the variables becomes. For instance, a correlation coefficient of 0.9 indicates a far stronger relationship than a correlation coefficient of 0.3. If the variables are not related to one another at all, the correlation coefficient is 0. The example above about ice cream and crime is an example of two variables that we might expect to have no relationship to each other.
英語のヒント
相関係数の数値の部分は、関係の強さを示す。数値が(負であれ正であれ)1に近いほど、変数どうしはより強く関係しており、一方の変数が変化するとき、もう一方の変数の変化はより予測しやすくなる。数値が0に近いほど関係は弱く、変数間の関係は予測しにくくなる。たとえば、0.9の相関係数は、0.3の相関係数よりもはるかに強い関係を示す。変数どうしがまったく関係していなければ、相関係数は0である。上で挙げたアイスクリームと犯罪の例は、互いに何の関係もないと予想されそうな二つの変数の例である。
The sign—positive or negative—of the correlation coefficient indicates the direction of the relationship (Figure 2.12). A positive correlation means that the variables move in the same direction. Put another way, it means that as one variable increases so does the other, and conversely, when one variable decreases so does the other. A negative correlation means that the variables move in opposite directions. If two variables are negatively correlated, a decrease in one variable is associated with an increase in the other and vice versa.
英語のヒント
相関係数の符号、すなわち正か負かは、関係の向きを示す(図2.12)。正の相関とは、変数どうしが同じ方向に動くことを意味する。言い換えれば、一方の変数が増えればもう一方も増え、逆に一方の変数が減ればもう一方も減る、ということである。負の相関とは、変数どうしが反対の方向に動くことを意味する。二つの変数が負に相関していれば、一方の変数の減少はもう一方の増加と結びついており、その逆も成り立つ。
The example of ice cream and crime rates is a positive correlation because both variables increase when temperatures are warmer. Other examples of positive correlations are the relationship between an individual’s height and weight or the relationship between a person’s age and number of wrinkles. One might expect a negative correlation to exist between someone’s tiredness during the day and the number of hours they slept the previous night: the amount of sleep decreases as the feelings of tiredness increase. In a real-world example of negative correlation, student researchers at the University of Minnesota found a weak negative correlation (r = -0.29) between the average number of days per week that students got fewer than 5 hours of sleep and their GPA (Lowry, Dean, & Manders, 2010). Keep in mind that a negative correlation is not the same as no correlation. For example, we would probably find no correlation between hours of sleep and shoe size.
英語のヒント
アイスクリームと犯罪率の例は正の相関である。気温が高くなると、両方の変数が増えるからである。正の相関のほかの例には、個人の身長と体重の関係や、人の年齢としわの数の関係がある。日中の疲労感と、前の晩に眠った時間数のあいだには、負の相関が存在すると予想できるだろう。疲労感が強まるにつれて、睡眠の量は減る。現実の負の相関の例として、ミネソタ大学の学生研究者たちは、学生が5時間未満しか眠らなかった週あたりの平均日数と、その学生のGPAとのあいだに、弱い負の相関(r = -0.29)を見いだした(Lowry, Dean, & Manders, 2010)。負の相関は、相関がないことと同じではない点に注意してほしい。たとえば、睡眠時間と靴のサイズのあいだには、おそらく相関は見られないだろう。
As mentioned earlier, correlations have predictive value. Imagine that you are on the admissions committee of a major university. You are faced with a huge number of applications, but you are able to accommodate only a small percentage of the applicant pool. How might you decide who should be admitted? You might try to correlate your current students’ college GPA with their scores on standardized tests like the SAT or ACT. By observing which correlations were strongest for your current students, you could use this information to predict relative success of those students who have applied for admission into the university.
英語のヒント
前に述べたように、相関には予測に役立つという価値がある。あなたが大きな大学の入学者選考委員会の一員だと想像してほしい。あなたは膨大な数の出願書類を前にしているが、受け入れられるのは志願者全体のうちのごく一部にすぎない。誰を入学させるべきかを、どうやって決めればよいだろうか。在学生の大学でのGPAと、SATやACTのような標準テストの得点との相関を調べてみる、というやり方がありうる。在学生についてどの相関が最も強かったかを観察すれば、その情報を使って、その大学に入学を志願してきた学生たちの相対的な成功を予測できるだろう。
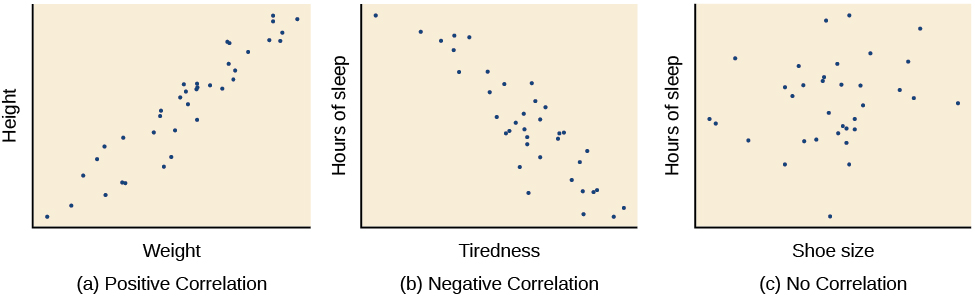

Figure 2.12図 2.12
Scatterplots are a graphical view of the strength and direction of correlations. The stronger the correlation, the closer the data points are to a straight line. In these examples, we see that there is (a) a positive correlation between weight and height, (b) a negative correlation between tiredness and hours of sleep, and (c) no correlation between shoe size and hours of sleep.
散布図は、相関の強さと向きをグラフで示したものである。相関が強いほど、データの点は直線に近づく。これらの例では、(a)体重と身長のあいだの正の相関、(b)疲労感と睡眠時間のあいだの負の相関、(c)靴のサイズと睡眠時間のあいだに相関がないこと、が見てとれる。