第5章多項式関数と有理関数Polynomial and Rational Functions
5.6 Rational Functions5.6 有理関数
Learning Objectives 学習目標
In this section, you will:
この節を終えると、次のことができるようになる。
• Use arrow notation.• Solve applied problems involving rational functions.• Find the domains of rational functions.• Identify vertical asymptotes.• Identify horizontal asymptotes.• Graph rational functions.
・矢印の記法を使う。・有理関数を含む応用問題を解く。・有理関数の定義域を求める。・垂直漸近線を見分ける。・水平漸近線を見分ける。・有理関数のグラフを描く。
Suppose we know that the cost of making a product is dependent on the number of items, produced. This is given by the equation If we want to know the average cost for producing items, we would divide the cost function by the number of items,
ある製品を作る費用が、作る個数 に依るとしよう。これは式 で与えられる。 個作るときの平均費用を知りたいなら、費用の関数を個数 で割ればよい。
The average cost function, which yields the average cost per item for items produced, is
個作るときの1個あたりの平均費用を与える平均費用関数は、次のとおりである。
Many other application problems require finding an average value in a similar way, giving us variables in the denominator. Written without a variable in the denominator, this function will contain a negative integer power.
ほかの多くの応用問題でも、同じように平均の値を求める必要があり、分母に変数が現れる。分母に変数を置かずに書くと、この関数は負の整数乗を含むことになる。
In the last few sections, we have worked with polynomial functions, which are functions with non-negative integers for exponents. In this section, we explore rational functions, which have variables in the denominator.
ここまでの数節では、指数が0以上の整数である関数、すなわち多項式関数を扱ってきた。この節では、分母に変数を持つ有理関数を調べる。
Using Arrow Notation矢印の記法を使う
We have seen the graphs of the basic reciprocal function and the squared reciprocal function from our study of toolkit functions. Examine these graphs, as shown in Figure 1, and notice some of their features.
基本関数を学んだところで、基本の逆数関数と逆数の2乗の関数のグラフを見た。図1に示したこれらのグラフを調べ、その特徴のいくつかに注目しよう。
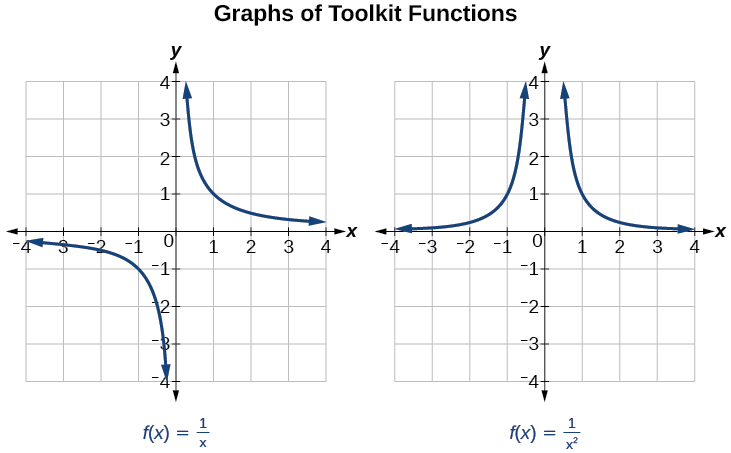
Several things are apparent if we examine the graph of
のグラフを調べると、いくつかのことがはっきりする。
1. On the left branch of the graph, the curve approaches the x-axis 2. As the graph approaches from the left, the curve drops, but as we approach zero from the right, the curve rises.3. Finally, on the right branch of the graph, the curves approaches the x-axis
1. グラフの左側の枝では、曲線は x軸 に近づく。2. グラフが左から に近づくとき曲線は下がるが、右から0に近づくとき曲線は上がる。3. 最後に、グラフの右側の枝では、曲線は x軸 に近づく。
To summarize, we use arrow notation to show that or is approaching a particular value. See Table 1.
まとめると、 や がある値に近づくことを示すのに、矢印の記法を使う。表1を見よ。
| Symbol記号 | Meaning意味 |
|---|---|
| approaches from the left ( but close to ) が左から に近づく( だが に近い) | |
| approaches from the right ( but close to ) が右から に近づく( だが に近い) | |
| approaches infinity ( increases without bound) が無限大に近づく( が限りなく大きくなる) | |
| approaches negative infinity ( decreases without bound) が負の無限大に近づく( が限りなく小さくなる) | |
| the output approaches infinity (the output increases without bound)出力が無限大に近づく(出力が限りなく大きくなる) | |
| the output approaches negative infinity (the output decreases without bound)出力が負の無限大に近づく(出力が限りなく小さくなる) | |
| the output approaches 出力が に近づく |
Local Behavior of の局所のふるまい
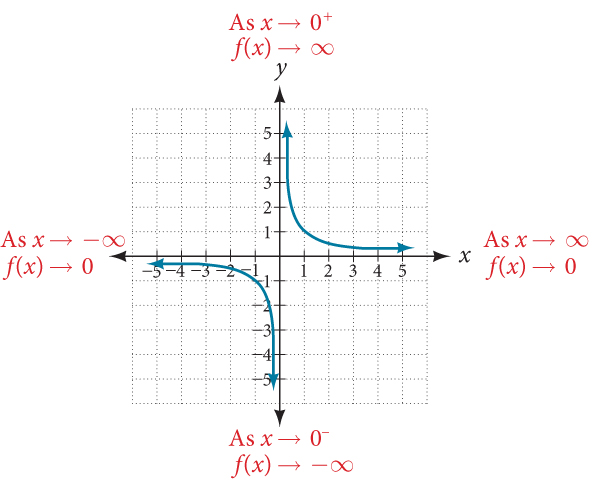
Let’s begin by looking at the reciprocal function, We cannot divide by zero, which means the function is undefined at so zero is not in the domain. As the input values approach zero from the left side (becoming very small, negative values), the function values decrease without bound (in other words, they approach negative infinity). We can see this behavior in Table 2.
まず逆数関数 を見よう。0で割ることはできないので、この関数は で定義されない。つまり0は定義域に入らない。入力値が左から0に近づく(とても小さい負の値になる)と、関数の値は限りなく小さくなる(言い換えれば負の無限大に近づく)。このふるまいは表2で見てとれる。
| –0.1 | –0.01 | –0.001 | –0.0001 | |
| –10 | –100 | –1000 | –10,000 |
We write in arrow notation
矢印の記法では次のように書く。
As the input values approach zero from the right side (becoming very small, positive values), the function values increase without bound (approaching infinity). We can see this behavior in Table 3.
入力値が右から0に近づく(とても小さい正の値になる)と、関数の値は限りなく大きくなる(無限大に近づく)。このふるまいは表3で見てとれる。
| 0.1 | 0.01 | 0.001 | 0.0001 | |
| 10 | 100 | 1000 | 10,000 |
We write in arrow notation
矢印の記法では次のように書く。
See Figure 2.
図2を見よ。
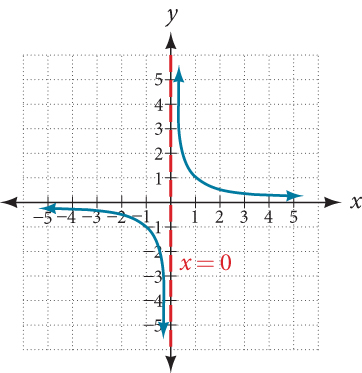
This behavior creates a vertical asymptote, which is a vertical line that the graph approaches but never crosses. In this case, the graph is approaching the vertical line as the input becomes close to zero. See Figure 3.
このふるまいが垂直漸近線を作る。垂直漸近線とは、グラフが近づくが決して横切らない縦の直線である。この場合、入力が0に近づくにつれて、グラフは縦の直線 に近づいている。図3を見よ。
Vertical Asymptote 垂直漸近線
A vertical asymptote of a graph is a vertical line where the graph tends toward positive or negative infinity as the input approaches from either the left or the right. We write
グラフの垂直漸近線とは、入力が左からでも右からでも に近づくときにグラフが正または負の無限大に向かう、縦の直線 である。次のように書く。
End Behavior of の端のふるまい
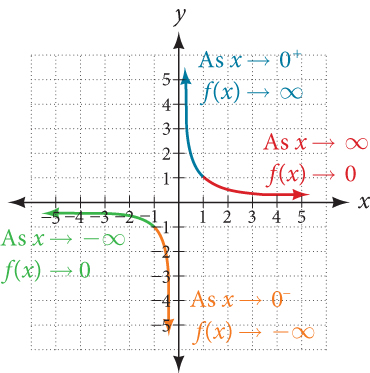
As the values of approach infinity, the function values approach 0. As the values of approach negative infinity, the function values approach 0. See Figure 4. Symbolically, using arrow notation
の値が無限大に近づくと、関数の値は0に近づく。 の値が負の無限大に近づくと、関数の値は0に近づく。図4を見よ。矢印の記法で記号を使って書くと、次のようになる。
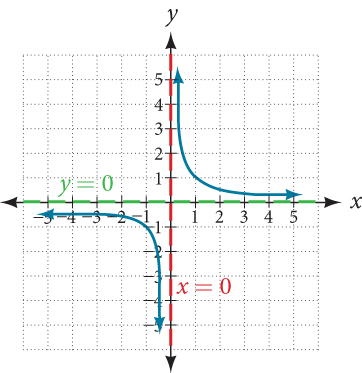
Based on this overall behavior and the graph, we can see that the function approaches 0 but never actually reaches 0; it seems to level off as the inputs become large. This behavior creates a horizontal asymptote, a horizontal line that the graph approaches as the input increases or decreases without bound. In this case, the graph is approaching the horizontal line See Figure 5.
この全体のふるまいとグラフから、この関数は0に近づくが実際に0になることは決して無く、入力が大きくなるにつれて水平に落ち着いていくように見えると分かる。このふるまいが水平漸近線を作る。水平漸近線とは、入力が限りなく大きく、あるいは小さくなるときにグラフが近づく横の直線である。この場合、グラフは横の直線 に近づいている。図5を見よ。
Horizontal Asymptote 水平漸近線
A horizontal asymptote of a graph is a horizontal line where the graph approaches the line as the inputs increase or decrease without bound. We write
グラフの水平漸近線とは、入力が限りなく大きく、あるいは小さくなるときにグラフが近づく、横の直線 である。次のように書く。
Example 1例1
Using Arrow Notation矢印の記法を使う
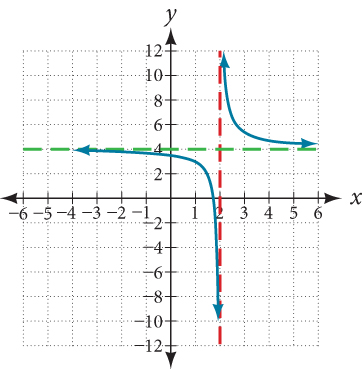
Use arrow notation to describe the end behavior and local behavior of the function graphed in Figure 6.
矢印の記法を使って、図6にグラフを描いた関数の端のふるまいと局所のふるまいを述べよ。
Solution 解答
Notice that the graph is showing a vertical asymptote at which tells us that the function is undefined at
グラフが に垂直漸近線を示しており、この関数が で定義されないと教えているのに注目しよう。
And as the inputs decrease without bound, the graph appears to be leveling off at output values of 4, indicating a horizontal asymptote at As the inputs increase without bound, the graph levels off at 4.
そして入力が限りなく小さくなると、グラフは出力値4で水平に落ち着くように見え、 に水平漸近線があることを示している。入力が限りなく大きくなるときも、グラフは4で水平に落ち着く。
Try It #1やってみよう1
Use arrow notation to describe the end behavior and local behavior for the reciprocal squared function.
矢印の記法を使って、逆数の2乗の関数の端のふるまいと局所のふるまいを述べよ。
Example 2例2
Using Transformations to Graph a Rational Function移動を使って有理関数のグラフを描く
Sketch a graph of the reciprocal function shifted two units to the left and up three units. Identify the horizontal and vertical asymptotes of the graph, if any.
逆数関数を左に2単位、上に3単位移したグラフの概形を描け。そのグラフの水平漸近線と垂直漸近線があれば見分けよ。
Solution 解答
Shifting the graph left 2 and up 3 would result in the function
グラフを左に2、上に3移すと、次の関数になる。
or equivalently, by giving the terms a common denominator,
あるいは同じことだが、項を通分すれば次のようになる。
The graph of the shifted function is displayed in Figure 7.
移した関数のグラフを図7に示す。
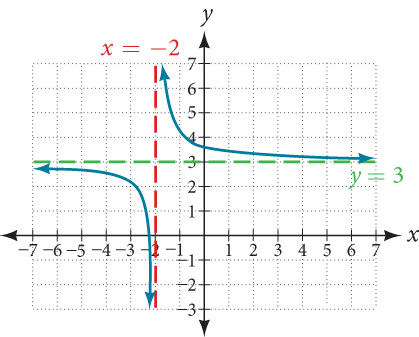
Notice that this function is undefined at and the graph also is showing a vertical asymptote at
この関数が で定義されず、グラフも に垂直漸近線を示していることに注目しよう。
As the inputs increase and decrease without bound, the graph appears to be leveling off at output values of 3, indicating a horizontal asymptote at
入力が限りなく大きく、また小さくなると、グラフは出力値3で水平に落ち着くように見え、 に水平漸近線があることを示している。
Analysis 考察
Notice that horizontal and vertical asymptotes are shifted left 2 and up 3 along with the function.
水平漸近線と垂直漸近線も、関数と一緒に左に2、上に3移っていることに注目しよう。
Try It #2やってみよう2
Sketch the graph, and find the horizontal and vertical asymptotes of the reciprocal squared function that has been shifted right 3 units and down 4 units.
逆数の2乗の関数を右に3単位、下に4単位移したもののグラフの概形を描き、その水平漸近線と垂直漸近線を求めよ。
Solving Applied Problems Involving Rational Functions有理関数を含む応用問題を解く
In Example 2, we shifted a toolkit function in a way that resulted in the function This is an example of a rational function. A rational function is a function that can be written as the quotient of two polynomial functions. Many real-world problems require us to find the ratio of two polynomial functions. Problems involving rates and concentrations often involve rational functions.
例2では、基本関数を移した結果、関数 を得た。これは有理関数の一例である。有理関数とは、二つの多項式関数の商として書ける関数である。現実の多くの問題で、二つの多項式関数の比を求める必要が生じる。割合や濃度を含む問題は、しばしば有理関数を伴う。
Rational Function 有理関数
A rational function is a function that can be written as the quotient of two polynomial functions
有理関数とは、二つの多項式関数 の商として書ける関数である。
Example 3例3
Solving an Applied Problem Involving a Rational Function有理関数を含む応用問題を解く
After running out of pre-packaged supplies, a nurse in a refugee camp is preparing an intravenous sugar solution for patients in the camp hospital. A large mixing tank currently contains 100 gallons of distilled water into which 5 pounds of sugar have been mixed. A tap will open pouring 10 gallons per minute of distilled water into the tank at the same time sugar is poured into the tank at a rate of 1 pound per minute. Find the ratio of sugar to water, in pounds per gallon in the tank after 12 minutes. Is that a greater ratio of sugar to water, in pounds per gallon than at the beginning?
あらかじめ包装された物資が尽きたので、難民キャンプの看護師が、キャンプの病院の患者のために点滴用の糖液を作っている。大きな混合槽には今、蒸留水が100ガロン入っており、そこに砂糖が5ポンド混ぜてある。蛇口を開けると毎分10ガロンの蒸留水が槽に注がれ、同時に砂糖が毎分1ポンドの割合で槽に入れられる。12分後の槽の中の、1ガロンあたりのポンドで表した砂糖と水の比を求めよ。それは初めのときより、1ガロンあたりのポンドで表した砂糖と水の比が大きいか。
Solution 解答
Let be the number of minutes since the tap opened. Since the water increases at 10 gallons per minute, and the sugar increases at 1 pound per minute, these are constant rates of change. This tells us the amount of water in the tank is changing linearly, as is the amount of sugar in the tank. We can write an equation independently for each:
蛇口を開けてからの分数を とする。水は毎分10ガロン、砂糖は毎分1ポンド増えるので、これらは一定の変化の割合である。つまり槽の中の水の量は一次に変わり、槽の中の砂糖の量も同じである。それぞれについて別々に式が書ける。
The ratio of sugar to water, in pounds per gallon, , will be the ratio of pounds of sugar to gallons of water
1ガロンあたりのポンドで表した砂糖と水の比 は、砂糖のポンド数と水のガロン数の比になる。
The ratio of sugar to water, in pounds per gallon after 12 minutes is given by evaluating at
12分後の、1ガロンあたりのポンドで表した砂糖と水の比は、 における の値で与えられる。
This means the ratio of sugar to water, in pounds per gallon is 17 pounds of sugar to 220 gallons of water.
つまり、1ガロンあたりのポンドで表した砂糖と水の比は、砂糖17ポンドに対して水220ガロンである。
At the beginning, the ratio of sugar to water, in pounds per gallon is
初めのとき、1ガロンあたりのポンドで表した砂糖と水の比は次のとおりである。
Since the ratio of sugar to water, in pounds per gallon is greater after 12 minutes than at the beginning.
なので、1ガロンあたりのポンドで表した砂糖と水の比は、初めのときより12分後のほうが大きい。
Try It #3やってみよう3
There are 1,200 first-year and 1,500 second-year students at a rally at noon. After 12 p.m., 20 first-year students arrive at the rally every five minutes while 15 second-year students leave the rally. Find the ratio of first-year to second-year students at 1 p.m.
正午の集会に1年生が1,200人、2年生が1,500人いる。午後0時を過ぎると、5分ごとに1年生が20人集会に来て、2年生が15人集会を去る。午後1時の1年生と2年生の比を求めよ。
Finding the Domains of Rational Functions有理関数の定義域を求める
A vertical asymptote represents a value at which a rational function is undefined, so that value is not in the domain of the function. A reciprocal function cannot have values in its domain that cause the denominator to equal zero. In general, to find the domain of a rational function, we need to determine which inputs would cause division by zero.
垂直漸近線は、有理関数が定義されない値を表すので、その値は関数の定義域に入らない。逆数関数の定義域には、分母を0にする値は入れられない。一般に、有理関数の定義域を求めるには、どの入力が0での割り算を起こすかを決めればよい。
Domain of a Rational Function 有理関数の定義域
The domain of a rational function includes all real numbers except those that cause the denominator to equal zero.
有理関数の定義域は、分母を0にするものを除いた実数全体である。
How To 手順
Given a rational function, find the domain.
有理関数が与えられたとき、その定義域を求める。
1. Set the denominator equal to zero.2. Solve to find the x-values that cause the denominator to equal zero.3. The domain is all real numbers except those found in Step 2.
1. 分母を0とおく。2. それを解いて、分母を0にする x の値を求める。3. 定義域は、手順2で求めたものを除いた実数全体である。
Example 4例4
Finding the Domain of a Rational Function有理関数の定義域を求める
Find the domain of
の定義域を求めよ。
Solution 解答
Begin by setting the denominator equal to zero and solving.
まず分母を0とおいて解く。
The denominator is equal to zero when The domain of the function is all real numbers except
分母が0になるのは のときである。この関数の定義域は、 を除いた実数全体である。
Analysis 考察
A graph of this function, as shown in Figure 8, confirms that the function is not defined when
図8に示したこの関数のグラフから、 のときこの関数が定義されないことが確かめられる。
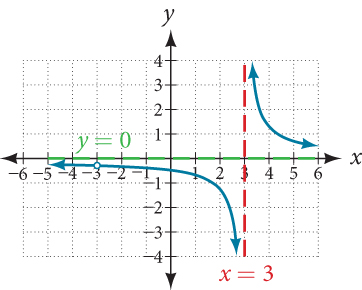
There is a vertical asymptote at and a hole in the graph at We will discuss these types of holes in greater detail later in this section.
に垂直漸近線があり、 にはグラフの穴がある。この種の穴については、この節の後のほうでもっと詳しく論じる。
Try It #4やってみよう4
Find the domain of
の定義域を求めよ。
Identifying Vertical Asymptotes of Rational Functions有理関数の垂直漸近線を見分ける
By looking at the graph of a rational function, we can investigate its local behavior and easily see whether there are asymptotes. We may even be able to approximate their location. Even without the graph, however, we can still determine whether a given rational function has any asymptotes, and calculate their location.
有理関数のグラフを見れば、その局所のふるまいを調べられ、漸近線があるかどうかも簡単に分かる。その位置をおおよそ見積もれることさえある。だがグラフが無くても、与えられた有理関数に漸近線があるかどうかを決め、その位置を計算できる。
Vertical Asymptotes垂直漸近線
The vertical asymptotes of a rational function may be found by examining the factors of the denominator that are not common to the factors in the numerator. Vertical asymptotes occur at the zeros of such factors.
有理関数の垂直漸近線は、分子の因数と共通でない分母の因数を調べれば求まる。垂直漸近線は、そうした因数の零点に現れる。
How To 手順
Given a rational function, identify any vertical asymptotes of its graph.
有理関数が与えられたとき、そのグラフの垂直漸近線があれば見分ける。
1. Factor the numerator and denominator.2. Note any restrictions in the domain of the function.3. Reduce the expression by canceling common factors in the numerator and the denominator.4. Note any values that cause the denominator to be zero in this simplified version. These are where the vertical asymptotes occur.5. Note any restrictions in the domain where asymptotes do not occur. These are removable discontinuities, or “holes.”
1. 分子と分母を因数分解する。2. この関数の定義域の制限を書き留める。3. 分子と分母の共通の因数を約分して、式を簡単にする。4. 簡単にしたこの形で分母を0にする値を書き留める。そこに垂直漸近線が現れる。5. 定義域の制限のうち、漸近線が現れないものを書き留める。これは取り除ける不連続、すなわち「穴」である。
Example 5例5
Identifying Vertical Asymptotes垂直漸近線を見分ける
Find the vertical asymptotes of the graph of
のグラフの垂直漸近線を求めよ。
Solution 解答
First, factor the numerator and denominator.
まず分子と分母を因数分解する。
To find the vertical asymptotes, we determine where this function will be undefined by setting the denominator equal to zero:
垂直漸近線を求めるために、分母を0とおいて、この関数が定義されないところを決める。
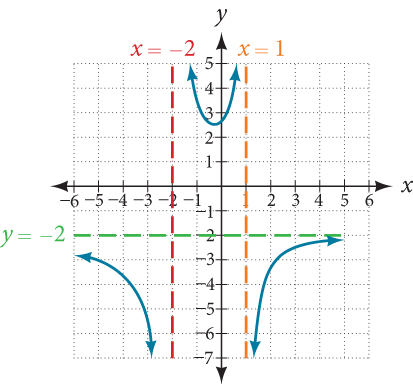
Neither nor are zeros of the numerator, so the two values indicate two vertical asymptotes. The graph in Figure 9 confirms the location of the two vertical asymptotes.
も も分子の零点ではないので、この二つの値が二本の垂直漸近線を示している。図9のグラフから、二本の垂直漸近線の位置が確かめられる。
Removable Discontinuities取り除ける不連続
Occasionally, a graph will contain a hole: a single point where the graph is not defined, indicated by an open circle. We call such a hole a removable discontinuity.
グラフが穴を含むことがある。穴とは、グラフが定義されない一点で、白丸で示される。この種の穴を、取り除ける不連続と呼ぶ。
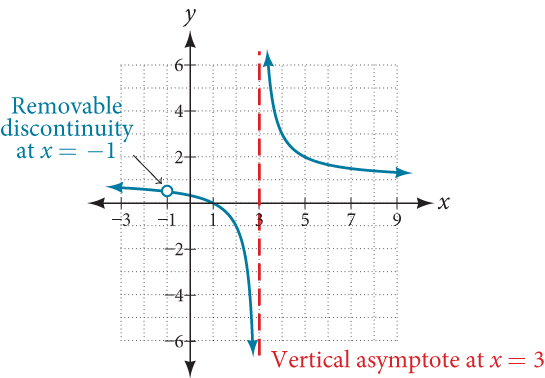
For example, the function may be re-written by factoring the numerator and the denominator.
たとえば関数 は、分子と分母を因数分解して書き直せる。
Notice that is a common factor to the numerator and the denominator. The zero of this factor, is the location of the removable discontinuity. Notice also that is not a factor in both the numerator and denominator. The zero of this factor, is the vertical asymptote. See Figure 10. [Note that removable discontinuities may not be visible when we use a graphing calculator, depending upon the window selected.]
が分子と分母の共通の因数であることに注目しよう。この因数の零点 が、取り除ける不連続の場所である。 が分子と分母の両方の因数ではないことにも注目しよう。この因数の零点 が垂直漸近線である。図10を見よ。[取り除ける不連続は、選んだ表示範囲によっては、グラフ電卓で見えないことがあるので注意せよ。]
Removable Discontinuities of Rational Functions 有理関数の除去可能な不連続点
A removable discontinuity occurs in the graph of a rational function at if is a zero for a factor in the denominator that is common with a factor in the numerator. We factor the numerator and denominator and check for common factors. If we find any, we set the common factor equal to 0 and solve. This is the location of the removable discontinuity. This is true if the multiplicity of this factor is greater than or equal to that in the denominator. If the multiplicity of this factor is greater in the denominator, then there is still an asymptote at that value.
有理関数のグラフで に取り除ける不連続が現れるのは、 が、分子の因数と共通する分母の因数の零点であるときである。分子と分母を因数分解し、共通の因数がないか調べる。あれば、その共通の因数を0とおいて解く。そこが取り除ける不連続の場所である。これは、分子でのこの因数の重複度が分母でのそれ以上であるときに成り立つ。分母でのこの因数の重複度のほうが大きいなら、その値のところにはやはり漸近線がある。
Example 6例6
Identifying Vertical Asymptotes and Removable Discontinuities for a Graphグラフの垂直漸近線と取り除ける不連続を見分ける
Find the vertical asymptotes and removable discontinuities of the graph of
のグラフの垂直漸近線と取り除ける不連続を求めよ。
Solution 解答
Factor the numerator and the denominator.
分子と分母を因数分解する。
Notice that there is a common factor in the numerator and the denominator, The zero for this factor is This is the location of the removable discontinuity.
分子と分母に共通の因数 があることに注目しよう。この因数の零点は である。これが取り除ける不連続の場所である。
Notice that there is a factor in the denominator that is not in the numerator, The zero for this factor is The vertical asymptote is See Figure 11.
分母にあって分子に無い因数 があることに注目しよう。この因数の零点は である。垂直漸近線は である。図11を見よ。
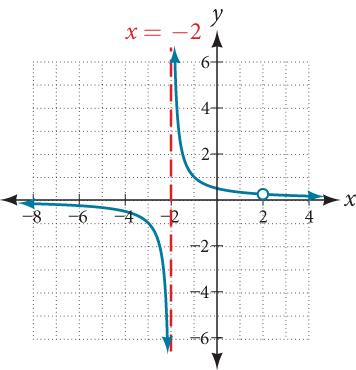
The graph of this function will have the vertical asymptote at but at the graph will have a hole.
この関数のグラフは に垂直漸近線を持つが、 では穴を持つ。
Try It #5やってみよう5
Find the vertical asymptotes and removable discontinuities of the graph of
のグラフの垂直漸近線と取り除ける不連続を求めよ。
Identifying Horizontal Asymptotes of Rational Functions有理関数の水平漸近線を見分ける
While vertical asymptotes describe the behavior of a graph as the output gets very large or very small, horizontal asymptotes help describe the behavior of a graph as the input gets very large or very small. Recall that a polynomial’s end behavior will mirror that of the leading term. Likewise, a rational function’s end behavior will mirror that of the ratio of the function that is the ratio of the leading terms.
垂直漸近線が出力がとても大きく、あるいはとても小さくなるときのグラフの特徴を述べるのに対し、水平漸近線は入力がとても大きく、あるいはとても小さくなるときのグラフの特徴を述べるのに役立つ。多項式の端のふるまいは最高次の項のそれを写すと述べたのを思い出そう。同じように、有理関数の端のふるまいは、最高次の項どうしの比である関数のそれを写す。
There are three distinct outcomes when checking for horizontal asymptotes:
水平漸近線を調べると、結果は三通りに分かれる。
Case 1: If the degree of the denominator > degree of the numerator, there is a horizontal asymptote at
場合1: 分母の次数 > 分子の次数なら、 に水平漸近線がある。
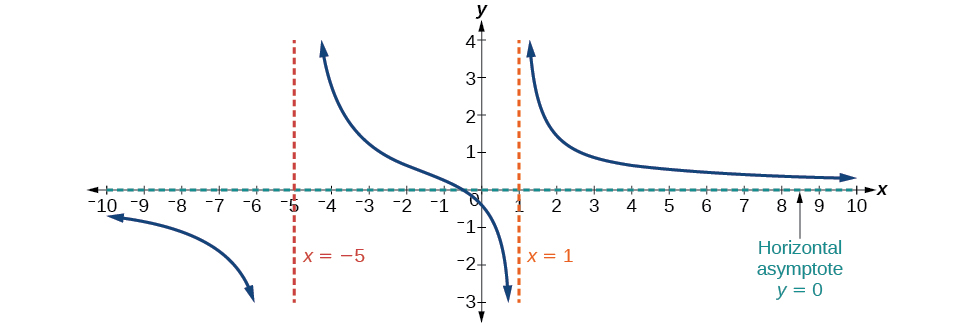
In this case, the end behavior is This tells us that, as the inputs increase or decrease without bound, this function will behave similarly to the function and the outputs will approach zero, resulting in a horizontal asymptote at See Figure 12. Note that this graph crosses the horizontal asymptote.
この場合、端のふるまいは である。これは、入力が限りなく大きく、あるいは小さくなるとき、この関数が関数 と似たふるまいをし、出力は0に近づき、その結果 に水平漸近線ができると教えている。図12を見よ。このグラフは水平漸近線を横切っていることに注意せよ。
Case 2: If the degree of the denominator < degree of the numerator by one, we get a slant asymptote.
場合2: 分母の次数が分子の次数より1小さいなら、斜めの漸近線ができる。
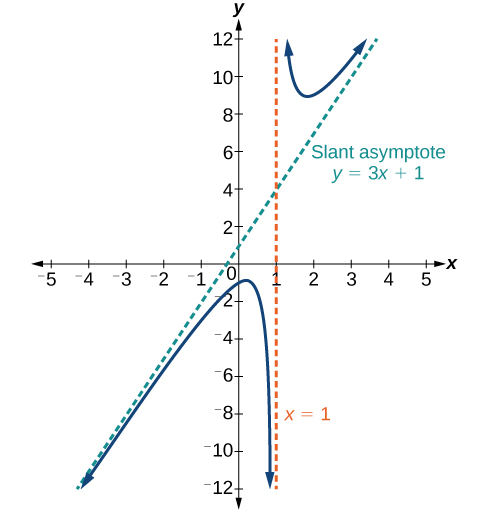
In this case, the end behavior is This tells us that as the inputs increase or decrease without bound, this function will behave similarly to the function As the inputs grow large, the outputs will grow and not level off, so this graph has no horizontal asymptote. However, the graph of looks like a diagonal line, and since will behave similarly to it will approach a line close to This line is a slant asymptote.
この場合、端のふるまいは である。これは、入力が限りなく大きく、あるいは小さくなるとき、この関数が関数 と似たふるまいをすると教えている。入力が大きくなると出力も大きくなり、水平に落ち着かないので、このグラフに水平漸近線は無い。だが のグラフは斜めの直線に見え、 は と似たふるまいをするので、 に近い直線に近づく。この直線が斜めの漸近線である。
To find the equation of the slant asymptote, divide The quotient is and the remainder is 2. The slant asymptote is the graph of the line See Figure 13.
斜めの漸近線の方程式を求めるには、 を割ればよい。商は 、余りは2である。斜めの漸近線は直線 のグラフである。図13を見よ。
Case 3: If the degree of the denominator = degree of the numerator, there is a horizontal asymptote at where and are the leading coefficients of and for
場合3: 分母の次数 = 分子の次数なら、 に水平漸近線がある。ここで と は、 における と の最高次係数である。
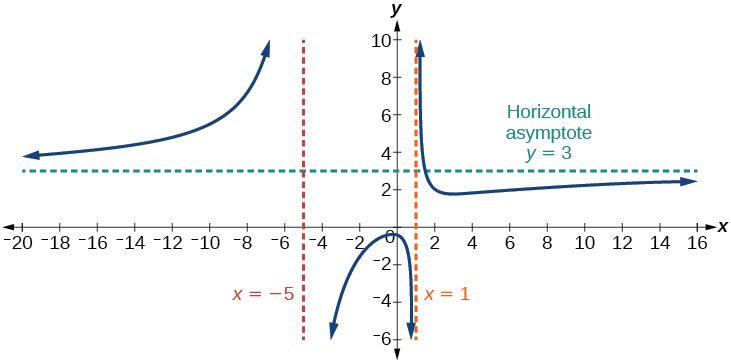
In this case, the end behavior is This tells us that as the inputs grow large, this function will behave like the function which is a horizontal line. As resulting in a horizontal asymptote at See Figure 14. Note that this graph crosses the horizontal asymptote.
この場合、端のふるまいは である。これは、入力が大きくなると、この関数が横の直線である関数 のようにふるまうと教えている。 となり、その結果 に水平漸近線ができる。図14を見よ。このグラフは水平漸近線を横切っていることに注意せよ。
Notice that, while the graph of a rational function will never cross a vertical asymptote, the graph may or may not cross a horizontal or slant asymptote. Also, although the graph of a rational function may have many vertical asymptotes, the graph will have at most one horizontal (or slant) asymptote.
有理関数のグラフは垂直漸近線を決して横切らないが、水平漸近線や斜めの漸近線は横切ることも横切らないこともあるのに注目しよう。また、有理関数のグラフは垂直漸近線を多く持ちうるが、水平(または斜めの)漸近線はたかだか一本しか持たない。
It should be noted that, if the degree of the numerator is larger than the degree of the denominator by more than one, the end behavior of the graph will mimic the behavior of the reduced end behavior fraction. For instance, if we had the function
分子の次数が分母の次数より2以上大きいときは、グラフの端のふるまいが、約した端のふるまいの分数のふるまいを真似ることに注意すべきである。たとえば、次の関数があったとする。
with end behavior
端のふるまいは次のとおりで、
the end behavior of the graph would look similar to that of an even polynomial with a positive leading coefficient.
このグラフの端のふるまいは、最高次係数が正の偶数次の多項式のそれと似たものになる。
Horizontal Asymptotes of Rational Functions 有理関数の水平漸近線
The horizontal asymptote of a rational function can be determined by looking at the degrees of the numerator and denominator.
有理関数の水平漸近線は、分子と分母の次数を見れば決められる。
• Degree of numerator is less than degree of denominator: horizontal asymptote at • Degree of numerator is greater than degree of denominator by one: no horizontal asymptote; slant asymptote.• Degree of numerator is equal to degree of denominator: horizontal asymptote at ratio of leading coefficients.
・分子の次数が分母の次数より小さい: に水平漸近線。・分子の次数が分母の次数より1大きい: 水平漸近線は無く、斜めの漸近線がある。・分子の次数が分母の次数に等しい: 最高次係数の比に水平漸近線。
Example 7例7
Identifying Horizontal and Slant Asymptotes水平漸近線と斜めの漸近線を見分ける
For the functions listed, identify the horizontal or slant asymptote.
次に挙げる各関数について、水平漸近線または斜めの漸近線を見分けよ。
Solution 解答
For these solutions, we will use
これらの答えでは を使う。
ⓐ The degree of so we can find the horizontal asymptote by taking the ratio of the leading terms. There is a horizontal asymptote at or ⓑ The degree of and degree of Since by 1, there is a slant asymptote found at The quotient is and the remainder is 13. There is a slant asymptote at ⓒ The degree of degree of so there is a horizontal asymptote
ⓐ。 の次数が等しいので、最高次の項の比をとれば水平漸近線が求まる。、すなわち に水平漸近線がある。ⓑ。 の次数と の次数について、 が1大きいので、 を求めれば斜めの漸近線が得られる。商は 、余りは13である。 に斜めの漸近線がある。ⓒ。 の次数は の次数より小さいので、水平漸近線 がある。
Example 8例8
Identifying Horizontal Asymptotes水平漸近線を見分ける
In the sugar concentration problem earlier, we created the equation
先ほどの砂糖の濃度の問題で、式 を作った。
Find the horizontal asymptote and interpret it in context of the problem.
水平漸近線を求め、この問題の文脈でそれを読み解け。
Solution 解答
Both the numerator and denominator are linear (degree 1). Because the degrees are equal, there will be a horizontal asymptote at the ratio of the leading coefficients. In the numerator, the leading term is with coefficient 1. In the denominator, the leading term is with coefficient 10. The horizontal asymptote will be at the ratio of these values:
分子も分母も一次(1次)である。次数が等しいので、最高次係数の比のところに水平漸近線ができる。分子では最高次の項が で係数は1である。分母では最高次の項が で係数は10である。水平漸近線はこれらの値の比のところにできる。
This function will have a horizontal asymptote at
この関数は に水平漸近線を持つ。
This tells us that as the values of t increase, the values of will approach In context, this means that, as more time goes by, the concentration of sugar in the tank will approach one-tenth of a pound of sugar per gallon of water or pounds per gallon.
これは、t の値が増えると の値が に近づくと教えている。この文脈では、時間が経つほど、槽の中の砂糖の濃度が水1ガロンあたり砂糖10分の1ポンド、すなわち1ガロンあたり ポンドに近づくということである。
Example 9例9
Identifying Horizontal and Vertical Asymptotes水平漸近線と垂直漸近線を見分ける
Find the horizontal and vertical asymptotes of the function
次の関数の水平漸近線と垂直漸近線を求めよ。
Solution 解答
First, note that this function has no common factors, so there are no potential removable discontinuities.
まず、この関数に共通の因数が無いので、取り除ける不連続になりうるものは無いことに注意しよう。
The function will have vertical asymptotes when the denominator is zero, causing the function to be undefined. The denominator will be zero at indicating vertical asymptotes at these values.
この関数は、分母が0になって関数が定義されなくなるところに垂直漸近線を持つ。分母は で0になるので、これらの値のところに垂直漸近線がある。
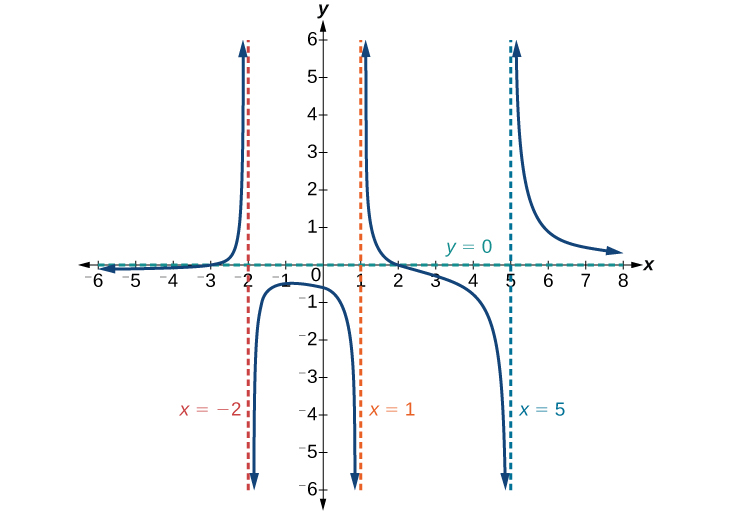
The numerator has degree 2, while the denominator has degree 3. Since the degree of the denominator is greater than the degree of the numerator, the denominator will grow faster than the numerator, causing the outputs to tend towards zero as the inputs get large, and so as This function will have a horizontal asymptote at See Figure 15.
分子の次数は2、分母の次数は3である。分母の次数が分子の次数より大きいので、分母は分子より速く大きくなり、入力が大きくなると出力は0に向かう。すなわち となる。この関数は に水平漸近線を持つ。図15を見よ。
Try It #6やってみよう6
Find the vertical and horizontal asymptotes of the function:
次の関数の垂直漸近線と水平漸近線を求めよ。
Intercepts of Rational Functions 有理関数の切片
A rational function will have a y-intercept at , if the function is defined at zero. A rational function will not have a y-intercept if the function is not defined at zero.
有理関数は、0で定義されるなら に y切片を持つ。0で定義されないなら y切片を持たない。
Likewise, a rational function will have x-intercepts at the inputs that cause the output to be zero. Since a fraction is only equal to zero when the numerator is zero, x-intercepts can only occur when the numerator of the rational function is equal to zero.
同じように、有理関数は出力を0にする入力のところに x切片を持つ。分数が0に等しくなるのは分子が0のときだけなので、x切片は有理関数の分子が0に等しいところにしか現れない。
Example 10例10
Finding the Intercepts of a Rational Function有理関数の切片を求める
Find the intercepts of
の切片を求めよ。
Solution 解答
We can find the y-intercept by evaluating the function at zero
0でこの関数の値を求めれば、y切片が得られる。
The x-intercepts will occur when the function is equal to zero:
x切片は、この関数が0に等しいときに現れる。
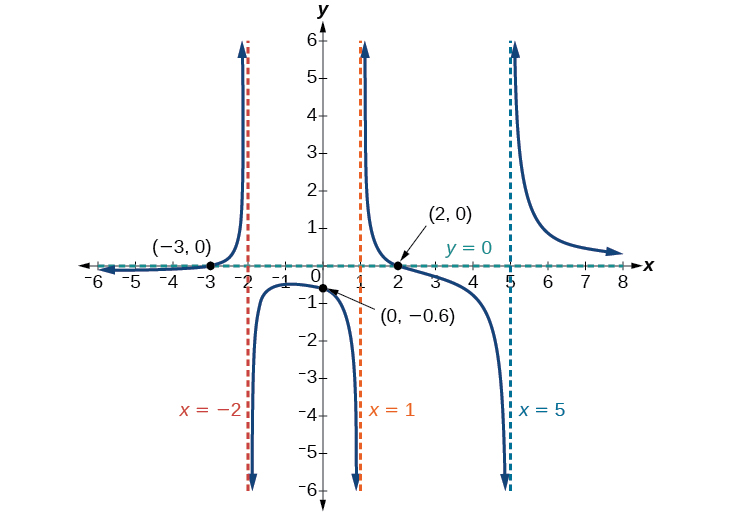
The y-intercept is the x-intercepts are and See Figure 16.
y切片は 、x切片は と である。図16を見よ。
Try It #7やってみよう7
Given the reciprocal squared function that is shifted right 3 units and down 4 units, write this as a rational function. Then, find the x- and y-intercepts and the horizontal and vertical asymptotes.
逆数の2乗の関数を右に3単位、下に4単位移したものを、有理関数として書け。そして x切片と y切片、水平漸近線と垂直漸近線を求めよ。
Graphing Rational Functions有理関数のグラフを描く
In Example 9, we see that the numerator of a rational function reveals the x-intercepts of the graph, whereas the denominator reveals the vertical asymptotes of the graph. As with polynomials, factors of the numerator may have integer powers greater than one. Fortunately, the effect on the shape of the graph at those intercepts is the same as we saw with polynomials.
例9で、有理関数の分子がグラフの x切片を、分母がグラフの垂直漸近線を明かすと分かった。多項式のときと同じく、分子の因数は1より大きい整数乗を持ちうる。幸い、その切片でのグラフの形への影響は、多項式で見たのと同じである。
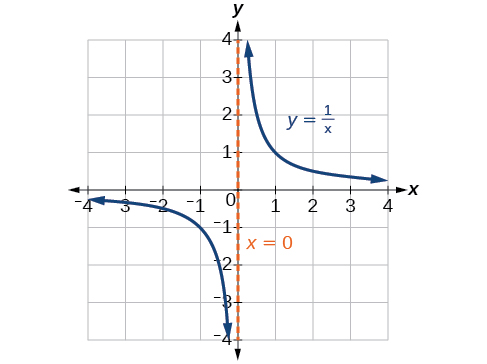
The vertical asymptotes associated with the factors of the denominator will mirror one of the two toolkit reciprocal functions. When the degree of the factor in the denominator is odd, the distinguishing characteristic is that on one side of the vertical asymptote the graph heads towards positive infinity, and on the other side the graph heads towards negative infinity. See Figure 17.
分母の因数に伴う垂直漸近線は、二つの基本の逆数関数のどちらかを写す。分母の因数の次数が奇数のとき、際立った特徴は、垂直漸近線の片側でグラフが正の無限大に向かい、もう片側で負の無限大に向かうことである。図17を見よ。
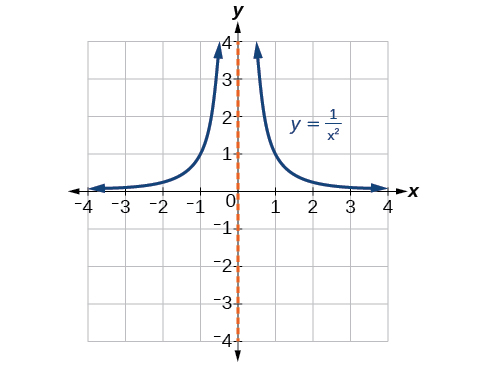
When the degree of the factor in the denominator is even, the distinguishing characteristic is that the graph either heads toward positive infinity on both sides of the vertical asymptote or heads toward negative infinity on both sides. See Figure 18.
分母の因数の次数が偶数のとき、際立った特徴は、垂直漸近線の両側でグラフが正の無限大に向かうか、両側で負の無限大に向かうかのどちらかであることである。図18を見よ。
For example, the graph of is shown in Figure 19.
たとえば のグラフを図19に示す。
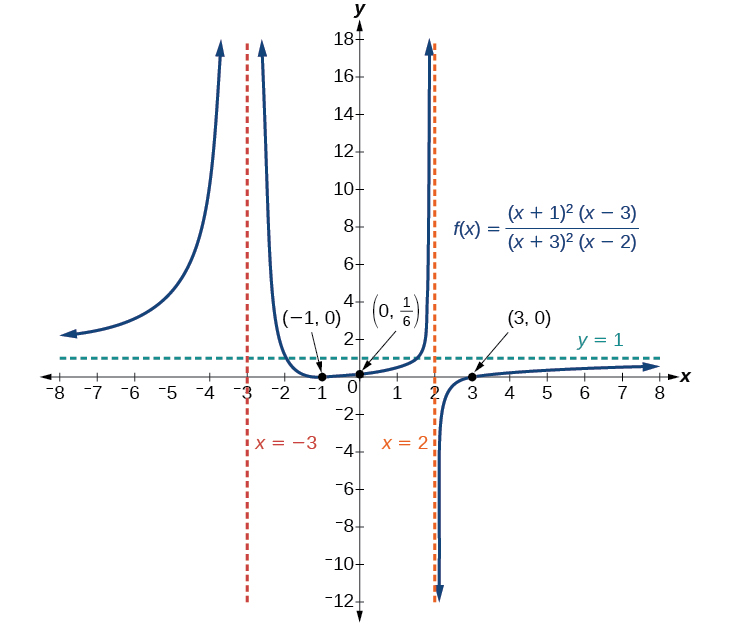
• At the x-intercept corresponding to the factor of the numerator, the graph "bounces", consistent with the quadratic nature of the factor.• At the x-intercept corresponding to the factor of the numerator, the graph passes through the axis as we would expect from a linear factor.• At the vertical asymptote corresponding to the factor of the denominator, the graph heads towards positive infinity on both sides of the asymptote, consistent with the behavior of the function • At the vertical asymptote corresponding to the factor of the denominator, the graph heads towards positive infinity on the left side of the asymptote and towards negative infinity on the right side.
・分子の という因数に対応する x切片 では、その因数が二次であることに合わせて、グラフは「跳ね返る」。・分子の という因数に対応する x切片 では、一次因数から見込まれるとおり、グラフは軸を通り抜ける。・分母の という因数に対応する垂直漸近線 では、関数 のふるまいに合わせて、グラフは漸近線の両側で正の無限大に向かう。・分母の という因数に対応する垂直漸近線 では、グラフは漸近線の左側で正の無限大に、右側で負の無限大に向かう。
How To 手順
Given a rational function, sketch a graph.
有理関数が与えられたとき、そのグラフの概形を描く。
1. Evaluate the function at 0 to find the y-intercept.2. Factor the numerator and denominator.3. For factors in the numerator not common to the denominator, determine where each factor of the numerator is zero to find the x-intercepts.4. Find the multiplicities of the x-intercepts to determine the behavior of the graph at those points.5. For factors in the denominator, note the multiplicities of the zeros to determine the local behavior. For those factors not common to the numerator, find the vertical asymptotes by setting those factors equal to zero and then solve.6. For factors in the denominator common to factors in the numerator, find the removable discontinuities by setting those factors equal to 0 and then solve.7. Compare the degrees of the numerator and the denominator to determine the horizontal or slant asymptotes.8. Sketch the graph.
1. 0でこの関数の値を求めて、y切片を求める。2. 分子と分母を因数分解する。3. 分母と共通でない分子の因数について、分子の各因数が0になるところを決めて、x切片を求める。4. x切片の重複度を求めて、その点でのグラフの特徴を決める。5. 分母の因数について、零点の重複度を書き留めて局所のふるまいを決める。分子と共通でない因数については、その因数を0とおいて解き、垂直漸近線を求める。6. 分子の因数と共通する分母の因数については、その因数を0とおいて解き、取り除ける不連続を求める。7. 分子と分母の次数を比べて、水平漸近線または斜めの漸近線を決める。8. グラフの概形を描く。
Example 11例11
Graphing a Rational Function有理関数のグラフを描く
Sketch a graph of
のグラフの概形を描け。
Solution 解答
We can start by noting that the function is already factored, saving us a step.
まず、この関数がすでに因数分解されており、一手間省けることに注目しよう。
Next, we will find the intercepts. Evaluating the function at zero gives the y-intercept:
次に切片を求める。0でこの関数の値を求めれば y切片が得られる。
To find the x-intercepts, we determine when the numerator of the function is zero. Setting each factor equal to zero, we find x-intercepts at and At each, the behavior will be linear (multiplicity 1), with the graph passing through the intercept.
x切片を求めるために、この関数の分子が0になるときを決める。各因数を0とおくと、x切片は と に見つかる。どちらでもふるまいは一次(重複度1)で、グラフは切片を通り抜ける。
We have a y-intercept at and x-intercepts at and
y切片は 、x切片は と である。
To find the vertical asymptotes, we determine when the denominator is equal to zero. This occurs when and when giving us vertical asymptotes at and
垂直漸近線を求めるために、分母が0に等しくなるときを決める。それは のときと のときで、 と に垂直漸近線がある。
There are no common factors in the numerator and denominator. This means there are no removable discontinuities.
分子と分母に共通の因数は無い。つまり取り除ける不連続は無い。
Finally, the degree of denominator is larger than the degree of the numerator, telling us this graph has a horizontal asymptote at
最後に、分母の次数が分子の次数より大きいので、このグラフは に水平漸近線を持つと分かる。
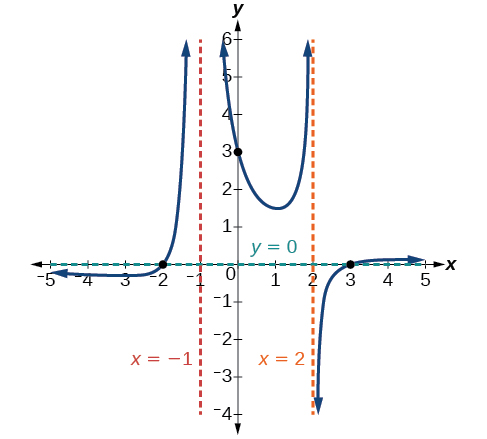
To sketch the graph, we might start by plotting the three intercepts. Since the graph has no x-intercepts between the vertical asymptotes, and the y-intercept is positive, we know the function must remain positive between the asymptotes, letting us fill in the middle portion of the graph as shown in Figure 20.
グラフの概形を描くには、まず三つの切片を打つとよいだろう。垂直漸近線のあいだにグラフの x切片は無く、y切片は正なので、この関数は漸近線のあいだで正のままでなければならないと分かる。これで図20のようにグラフの真ん中の部分が埋められる。
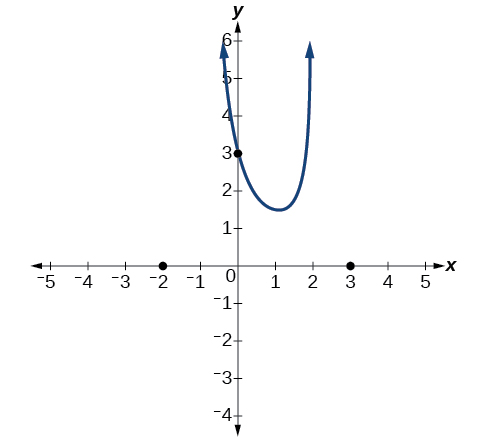
The factor associated with the vertical asymptote at was squared, so we know the behavior will be the same on both sides of the asymptote. The graph heads toward positive infinity as the inputs approach the asymptote on the right, so the graph will head toward positive infinity on the left as well.
の垂直漸近線に伴う因数は2乗されていたので、漸近線の両側でふるまいが同じになると分かる。入力が右から漸近線に近づくときグラフは正の無限大に向かうので、左側でも正の無限大に向かう。
For the vertical asymptote at the factor was not squared, so the graph will have opposite behavior on either side of the asymptote. See Figure 21. After passing through the x-intercepts, the graph will then level off toward an output of zero, as indicated by the horizontal asymptote.
の垂直漸近線では、因数は2乗されていなかったので、グラフは漸近線の両側で逆のふるまいをする。図21を見よ。x切片を通り抜けたあと、グラフは水平漸近線が示すとおり、出力0に向かって水平に落ち着く。
Try It #8やってみよう8
Given the function use the characteristics of polynomials and rational functions to describe its behavior and sketch the function.
関数 について、多項式と有理関数の特徴を使ってそのふるまいを述べ、グラフの概形を描け。
Writing Rational Functions有理関数を書く
Now that we have analyzed the equations for rational functions and how they relate to a graph of the function, we can use information given by a graph to write the function. A rational function written in factored form will have an x-intercept where each factor of the numerator is equal to zero. (An exception occurs in the case of a removable discontinuity.) As a result, we can form a numerator of a function whose graph will pass through a set of x-intercepts by introducing a corresponding set of factors. Likewise, because the function will have a vertical asymptote where each factor of the denominator is equal to zero, we can form a denominator that will produce the vertical asymptotes by introducing a corresponding set of factors.
有理関数の式と、それが関数のグラフとどう関わるかを調べたので、グラフから与えられる情報を使って関数を書ける。因数分解された形で書かれた有理関数は、分子の各因数が0に等しいところに x切片を持つ。(取り除ける不連続の場合は例外である。)したがって、対応する因数の組を持ち込めば、与えられた x切片の組を通るグラフを持つ関数の分子を作れる。同じように、この関数は分母の各因数が0に等しいところに垂直漸近線を持つので、対応する因数の組を持ち込めば、その垂直漸近線を生む分母を作れる。
Writing Rational Functions from Intercepts and Asymptotes 切片と漸近線から有理関数を求める
If a rational function has x-intercepts at vertical asymptotes at and no then the function can be written in the form:
ある有理関数が に x切片、 に垂直漸近線を持ち、 が無いなら、その関数は次の形で書ける。
where the powers or on each factor can be determined by the behavior of the graph at the corresponding intercept or asymptote, and the stretch factor can be determined given a value of the function other than the x-intercept or by the horizontal asymptote if it is nonzero.
ここで各因数の指数 や は、対応する切片や漸近線でのグラフの特徴から決められ、伸び率 は x切片以外の関数の値が一つ与えられれば、あるいは水平漸近線が0でなければそれから決められる。
How To 手順
Given a graph of a rational function, write the function.
有理関数のグラフが与えられたとき、その関数を書く。
1. Determine the factors of the numerator. Examine the behavior of the graph at the x-intercepts to determine the zeroes and their multiplicities. (This is easy to do when finding the “simplest” function with small multiplicities—such as 1 or 3—but may be difficult for larger multiplicities—such as 5 or 7, for example.)2. Determine the factors of the denominator. Examine the behavior on both sides of each vertical asymptote to determine the factors and their powers.3. Use any clear point on the graph to find the stretch factor.
1. 分子の因数を決める。x切片でのグラフの特徴を調べて、零点とその重複度を決める。(1や3のような小さい重複度で「最も簡単な」関数を求めるときは楽だが、たとえば5や7のような大きい重複度では難しいことがある。)2. 分母の因数を決める。各垂直漸近線の両側のふるまいを調べて、因数とその指数を決める。3. グラフ上のはっきりした点を一つ使って、伸び率を求める。
Example 12例12
Writing a Rational Function from Intercepts and Asymptotes切片と漸近線から有理関数を書く
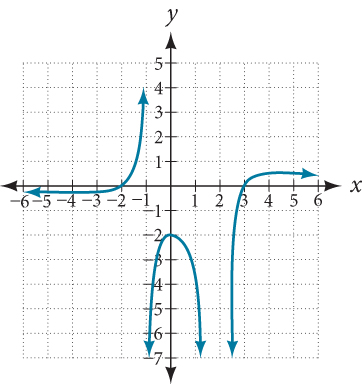
Write an equation for the rational function shown in Figure 22.
図22に示した有理関数の方程式を書け。
Solution 解答
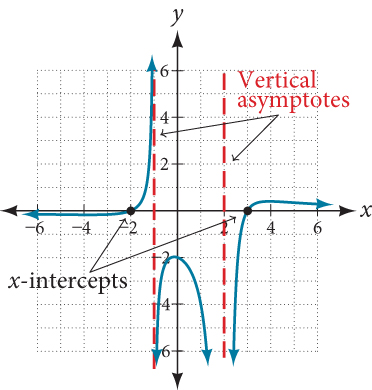
The graph appears to have x-intercepts at and At both, the graph passes through the intercept, suggesting linear factors. The graph has two vertical asymptotes. The one at seems to exhibit the basic behavior similar to with the graph heading toward positive infinity on one side and heading toward negative infinity on the other. The asymptote at is exhibiting a behavior similar to with the graph heading toward negative infinity on both sides of the asymptote. See Figure 23.
このグラフは と に x切片を持つように見える。どちらでもグラフは切片を通り抜けており、一次因数だと見込まれる。このグラフには垂直漸近線が二本ある。 のほうは と似た基本のふるまいを示しているように見え、グラフは片側で正の無限大に、もう片側で負の無限大に向かう。 の漸近線は と似たふるまいを示しており、グラフは漸近線の両側で負の無限大に向かう。図23を見よ。
We can use this information to write a function of the form
この情報を使えば、次の形の関数が書ける。
To find the stretch factor, we can use another clear point on the graph, such as the y-intercept
伸び率を求めるには、グラフ上のはっきりした別の点、たとえば y切片 が使える。
This gives us a final function of
これで最終的に関数 が得られる。
Media 教材
Access these online resources for additional instruction and practice with rational functions.
有理関数についての説明と練習をさらに求めるなら、次のオンライン教材にあたるとよい。
• Graphing Rational Functions• Find the Equation of a Rational Function• Determining Vertical and Horizontal Asymptotes• Find the Intercepts, Asymptotes, and Hole of a Rational Function
・有理関数のグラフを描く・有理関数の方程式を求める・垂直漸近線と水平漸近線を決める・有理関数の切片、漸近線、穴を求める
Verbal言葉で答える問題
2. What is the fundamental difference in the graphs of polynomial functions and rational functions?
2. 多項式関数と有理関数のグラフの、根本的な違いは何か。
4. Can a graph of a rational function have no vertical asymptote? If so, how?
4. 有理関数のグラフが垂直漸近線を一本も持たないことはありうるか。ありうるなら、どんなときか。
Algebraic代数の問題
For the following exercises, find the domain of the rational functions.
次の各問について、有理関数の定義域を求めよ。
For the following exercises, find the domain, vertical asymptotes, and horizontal asymptotes of the functions.
次の各問について、関数の定義域、垂直漸近線、水平漸近線を求めよ。
For the following exercises, find the x- and y-intercepts for the functions.
次の各問について、関数の x切片と y切片を求めよ。
For the following exercises, describe the local and end behavior of the functions.
次の各問について、関数の局所のふるまいと端のふるまいを述べよ。
For the following exercises, find the slant asymptote of the functions.
次の各問について、関数の斜めの漸近線を求めよ。
Graphicalグラフの問題
For the following exercises, use the given transformation to graph the function. Note the vertical and horizontal asymptotes.
次の各問について、与えられた移動を使って関数のグラフを描け。垂直漸近線と水平漸近線を書き留めよ。
36. The reciprocal function shifted down one unit and left three units.
36. 逆数関数を下に1単位、左に3単位移したもの。
38. The reciprocal squared function shifted down 2 units and right 1 unit.
38. 逆数の2乗の関数を下に2単位、右に1単位移したもの。
For the following exercises, find the horizontal intercepts, the vertical intercept, the vertical asymptotes, and the horizontal or slant asymptote of the functions. Use that information to sketch a graph.
次の各問について、関数の横軸の切片、縦軸の切片、垂直漸近線、そして水平漸近線または斜めの漸近線を求めよ。その情報を使ってグラフの概形を描け。
For the following exercises, write an equation for a rational function with the given characteristics.
次の各問について、与えられた特徴を持つ有理関数の方程式を書け。
52. Vertical asymptotes at and x-intercepts at and y-intercept at
52. と に垂直漸近線、 と に x切片、 に y切片。
54. Vertical asymptotes at and x-intercepts at and Horizontal asymptote at
54. と に垂直漸近線、 と に x切片、 に水平漸近線。
56. Vertical asymptote at Double zero at y-intercept at
56. に垂直漸近線。 に二重零点。 に y切片。
For the following exercises, use the graphs to write an equation for the function.
次の各問について、グラフを使ってその関数の方程式を書け。
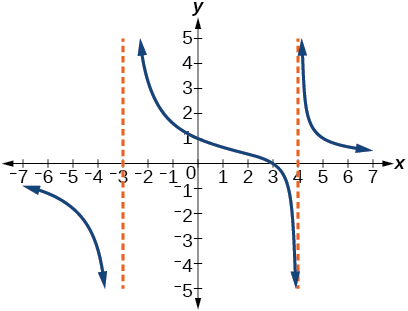
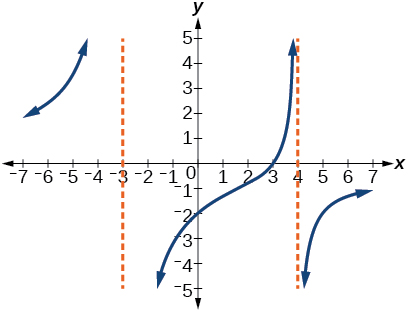
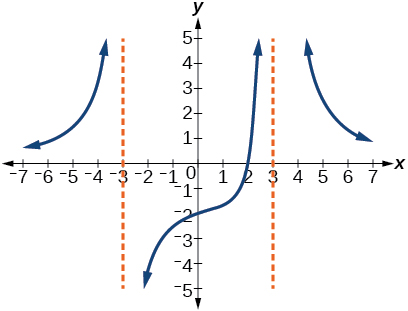
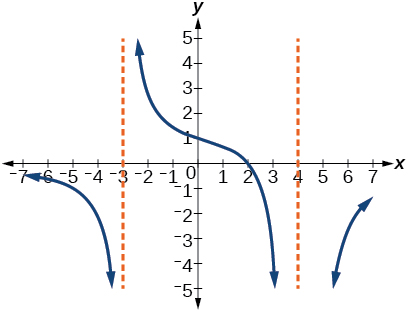
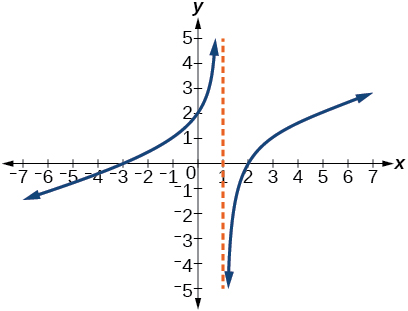
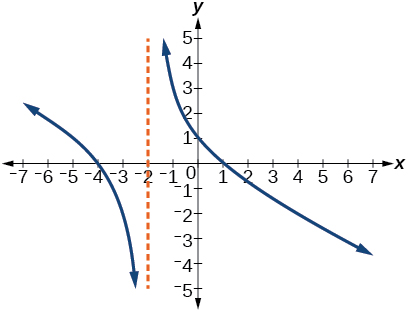
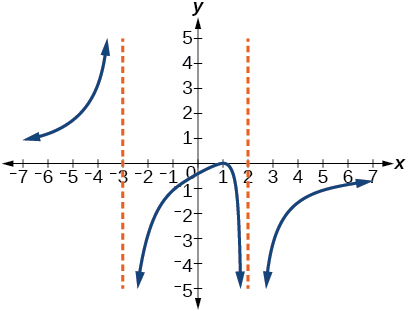
64. Use as the additional point.
64. 追加の点として を使え。
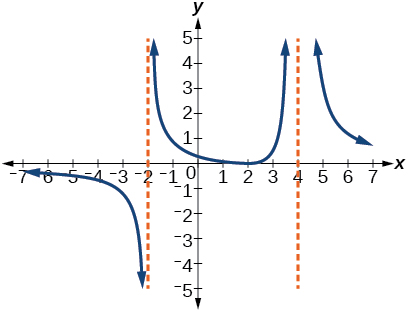
Numeric数値の問題
For the following exercises, make tables to show the behavior of the function near the vertical asymptote and reflecting the horizontal asymptote
次の各問について、垂直漸近線の近くでの関数のふるまいを示し、水平漸近線が見てとれるような表を作れ。
Technology機器を使う問題
For the following exercises, use a calculator to graph Use the graph to solve
次の各問について、電卓を使って のグラフを描け。そのグラフを使って を解け。
Extensions発展問題
For the following exercises, identify the removable discontinuity.
次の各問について、取り除ける不連続を見分けよ。
Real-World Applications応用問題
For the following exercises, express a rational function that describes the situation.
次の各問について、その状況を述べる有理関数を表せ。
80. In the refugee camp hospital, a large mixing tank currently contains 200 gallons of water, into which 10 pounds of sugar have been mixed. A tap will open, pouring 10 gallons of water per minute into the tank at the same time sugar is poured into the tank at a rate of 3 pounds per minute. Find the concentration (pounds per gallon) of sugar in the tank after minutes.
80. 難民キャンプの病院で、大きな混合槽に今、水が200ガロン入っており、そこに砂糖が10ポンド混ぜてある。蛇口を開けると毎分10ガロンの水が槽に注がれ、同時に砂糖が毎分3ポンドの割合で槽に入れられる。 分後の槽の中の砂糖の濃度(1ガロンあたりのポンド)を求めよ。
81. In the refugee camp hospital, a large mixing tank currently contains 300 gallons of water, into which 8 pounds of sugar have been mixed. A tap will open, pouring 20 gallons of water per minute into the tank at the same time sugar is poured into the tank at a rate of 2 pounds per minute. Find the concentration (pounds per gallon) of sugar in the tank after minutes.
81. 難民キャンプの病院で、大きな混合槽に今、水が300ガロン入っており、そこに砂糖が8ポンド混ぜてある。蛇口を開けると毎分20ガロンの水が槽に注がれ、同時に砂糖が毎分2ポンドの割合で槽に入れられる。 分後の槽の中の砂糖の濃度(1ガロンあたりのポンド)を求めよ。
For the following exercises, use the given rational function to answer the question.
次の各問について、与えられた有理関数を使って問いに答えよ。
82. The concentration of a drug in a patient’s bloodstream hours after injection is given by What happens to the concentration of the drug as increases?
82. 注射から 時間後の患者の血流中の薬の濃度 は で与えられる。 が増えると、薬の濃度はどうなるか。
For the following exercises, construct a rational function that will help solve the problem. Then, use a calculator to answer the question.
次の各問について、問題を解くのに役立つ有理関数を組み立てよ。そして電卓を使って問いに答えよ。
84. An open box with a square base is to have a volume of 108 cubic inches. Find the dimensions of the box that will have minimum surface area. Let = length of the side of the base.
84. 底面が正方形の蓋の無い箱の体積を108立方インチにする。表面積が最小になる箱の寸法を求めよ。 を底面の一辺とせよ。
85. A rectangular box with a square base is to have a volume of 20 cubic feet. The material for the base costs 30 cents/ square foot. The material for the sides costs 10 cents/square foot. The material for the top costs 20 cents/square foot. Determine the dimensions that will yield minimum cost. Let = length of the side of the base.
85. 底面が正方形の直方体の箱の体積を20立方フィートにする。底面の材料は1平方フィートあたり30セント、側面の材料は1平方フィートあたり10セント、上面の材料は1平方フィートあたり20セントかかる。費用が最小になる寸法を決めよ。 を底面の一辺とせよ。
86. A right circular cylinder has volume of 100 cubic inches. Find the radius and height that will yield minimum surface area. Let = radius.
86. ある直円柱の体積は100立方インチである。表面積が最小になる半径と高さを求めよ。 を半径とせよ。
88. A right circular cylinder is to have a volume of 40 cubic inches. It costs 4 cents/square inch to construct the top and bottom and 1 cent/square inch to construct the rest of the cylinder. Find the radius to yield minimum cost. Let = radius.
88. ある直円柱の体積を40立方インチにする。上面と底面を作るのに1平方インチあたり4セント、円柱の残りを作るのに1平方インチあたり1セントかかる。費用が最小になる半径を求めよ。 を半径とせよ。