第5章多項式関数と有理関数Polynomial and Rational Functions
Graphing Polynomial Functions多項式関数のグラフを描く
We can use what we have learned about multiplicities, end behavior, and turning points to sketch graphs of polynomial functions. Let us put this all together and look at the steps required to graph polynomial functions.
重複度、端のふるまい、折り返しの点について学んだことを使えば、多項式関数のグラフの概形が描ける。これらをまとめて、多項式関数のグラフを描くのに必要な手順を見よう。
How To 手順
Given a polynomial function, sketch the graph.
多項式関数が与えられたとき、そのグラフの概形を描く。
1. Find the intercepts.2. Check for symmetry. If the function is an even function, its graph is symmetrical about the axis, that is, If a function is an odd function, its graph is symmetrical about the origin, that is, 3. Use the multiplicities of the zeros to determine the behavior of the polynomial at the intercepts.4. Determine the end behavior by examining the leading term.5. Use the end behavior and the behavior at the intercepts to sketch a graph.6. Ensure that the number of turning points does not exceed one less than the degree of the polynomial.7. Optionally, use technology to check the graph.
1. 切片を求める。2. 対称性を調べる。関数が偶関数なら、そのグラフは 軸に関して対称、すなわち である。関数が奇関数なら、そのグラフは原点に関して対称、すなわち である。3. 零点の重複度を使って、 切片での多項式のふるまいを決める。4. 最高次の項を調べて、端のふるまいを決める。5. 端のふるまいと切片でのふるまいを使って、グラフの概形を描く。6. 折り返しの点の数が、その多項式の次数より一つ少ない数を超えていないことを確かめる。7. 必要なら、機器を使ってグラフを検算する。
Example 8例8
Sketching the Graph of a Polynomial Function多項式関数のグラフの概形を描く
Sketch a graph of
のグラフの概形を描け。
Solution 解答
This graph has two x-intercepts. At the factor is squared, indicating a multiplicity of 2. The graph will bounce at this x-intercept. At the function has a multiplicity of one, indicating the graph will cross through the axis at this intercept.
このグラフには x切片が二つある。 では因数が2乗されており、重複度が2であることを示している。グラフはこの x切片で跳ね返る。 では関数の重複度が1であり、グラフがこの切片で軸を通り抜けることを示している。
The y-intercept is found by evaluating
y切片は の値を求めれば得られる。
The y-intercept is
y切片は である。
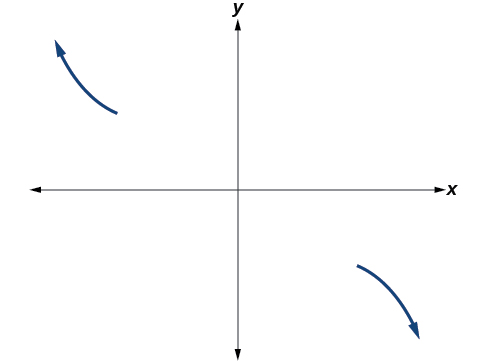
Additionally, we can see the leading term, if this polynomial were multiplied out, would be so the end behavior is that of a vertically reflected cubic, with the outputs decreasing as the inputs approach infinity, and the outputs increasing as the inputs approach negative infinity. See Figure 13.
さらに、この多項式を展開すれば最高次の項は になると分かるので、端のふるまいは縦に折り返した三次関数のそれであり、入力が無限大に近づくと出力は減り、入力が負の無限大に近づくと出力は増える。図13を見よ。
To sketch this, we consider that:
概形を描くために、次のように考える。
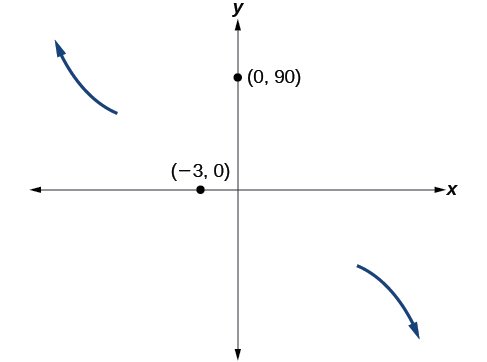
• As the function so we know the graph starts in the second quadrant and is decreasing toward the axis.• Since is not equal to the graph does not display symmetry.• At the graph bounces off of the x-axis, so the function must start increasing.At the graph crosses the y-axis at the y-intercept. See Figure 14.
・ のとき関数は なので、グラフは第2象限から始まり、 軸に向かって減っていくと分かる。・ は に等しくないので、このグラフは対称性を示さない。・ でグラフは x軸から跳ね返るので、関数はそこから増え始めなければならない。 でグラフは y切片で y軸を横切る。図14を見よ。
Somewhere after this point, the graph must turn back down or start decreasing toward the horizontal axis because the graph passes through the next intercept at See Figure 15.
グラフは の次の切片を通るので、この点より先のどこかで、グラフは下に折り返すか、横軸に向かって減り始めなければならない。図15を見よ。
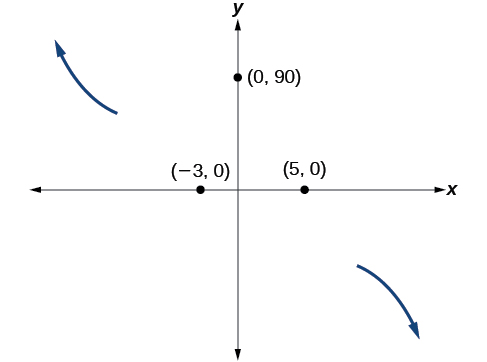
As the function so we know the graph continues to decrease, and we can stop drawing the graph in the fourth quadrant.
のとき関数は なので、グラフは減り続けると分かり、第4象限で描くのをやめてよい。
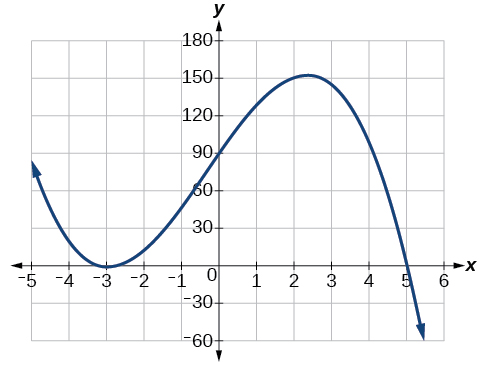
Using technology, we can create the graph for the polynomial function, shown in Figure 16, and verify that the resulting graph looks like our sketch in Figure 15.
機器を使えばこの多項式関数のグラフが作れる。図16に示したそれが、図15の概形と同じに見えることを確かめられる。
Try It #3やってみよう3
Sketch a graph of
のグラフの概形を描け。