第5章多項式関数と有理関数Polynomial and Rational Functions
Using the Intermediate Value Theorem中間値の定理を使う
In some situations, we may know two points on a graph but not the zeros. If those two points are on opposite sides of the x-axis, we can confirm that there is a zero between them. Consider a polynomial function whose graph is smooth and continuous. The Intermediate Value Theorem states that for two numbers and in the domain of if and then the function takes on every value between and (While the theorem is intuitive, the proof is actually quite complicated and requires higher mathematics.) We can apply this theorem to a special case that is useful in graphing polynomial functions. If a point on the graph of a continuous function at lies above the axis and another point at lies below the axis, there must exist a third point between and where the graph crosses the axis. Call this point This means that we are assured there is a solution where
グラフ上の2点は分かっているが零点は分からない、という場合がある。その2点が x軸の反対側にあれば、そのあいだに零点があると確かめられる。グラフが滑らかで連続な多項式関数 を考えよう。中間値の定理は、 の定義域の二つの数 と について、 と ならば、関数 は と のあいだのすべての値をとる、と述べる。(この定理は直観的だが、証明は実はかなり込み入っており、より高度な数学を要する。)この定理を、多項式関数のグラフを描くのに役立つ特別な場合に当てはめられる。連続関数 のグラフ上で、 の点が 軸の上にあり、 の別の点が 軸の下にあるなら、 と のあいだにグラフが 軸を横切る第3の点が必ず存在する。この点を とする。つまり となる解 が必ずあると保証される。
In other words, the Intermediate Value Theorem tells us that when a polynomial function changes from a negative value to a positive value, the function must cross the axis. Figure 17 shows that there is a zero between and
言い換えれば、中間値の定理は、多項式関数が負の値から正の値に変わるとき、その関数は 軸を必ず横切ると教えてくれる。図17は、 と のあいだに零点があることを示している。
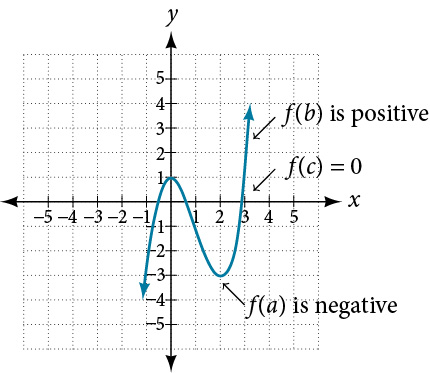
Intermediate Value Theorem 中間値の定理
Let be a polynomial function. The Intermediate Value Theorem states that if and have opposite signs, then there exists at least one value between and for which
を多項式関数とする。中間値の定理は、 と の符号が逆ならば、 となる値 が と のあいだに少なくとも一つ存在する、と述べる。
Example 9例9
Using the Intermediate Value Theorem中間値の定理を使う
Show that the function has at least two real zeros between and
関数 が と のあいだに少なくとも二つの実の零点を持つことを示せ。
Solution 解答
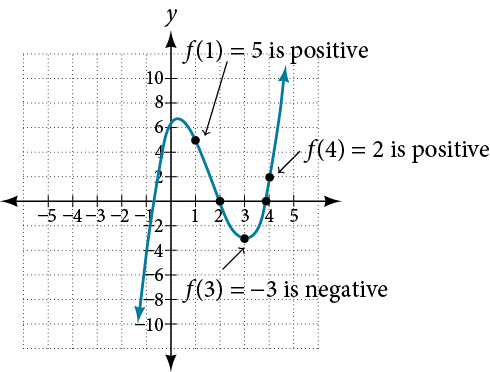
As a start, evaluate at the integer values and See Table 2.
手始めに、整数値 と で の値を求める。表2を見よ。
| 1 | 2 | 3 | 4 | |
| 5 | 0 | –3 | 2 |
We see that one zero occurs at Also, since is negative and is positive, by the Intermediate Value Theorem, there must be at least one real zero between 3 and 4.
零点の一つが にあると分かる。また が負で が正なので、中間値の定理により、3と4のあいだに実の零点が少なくとも一つ存在しなければならない。
We have shown that there are at least two real zeros between and
これで、 と のあいだに実の零点が少なくとも二つあることを示せた。
Analysis 考察
We can also see on the graph of the function in Figure 18 that there are two real zeros between and
図18のこの関数のグラフでも、 と のあいだに実の零点が二つあることが見てとれる。
Try It #4やってみよう4
Show that the function has at least one real zero between and
関数 が と のあいだに少なくとも一つの実の零点を持つことを示せ。
Writing Formulas for Polynomial Functions多項式関数の式を書く
Now that we know how to find zeros of polynomial functions, we can use them to write formulas based on graphs. Because a polynomial function written in factored form will have an x-intercept where each factor is equal to zero, we can form a function that will pass through a set of x-intercepts by introducing a corresponding set of factors.
多項式関数の零点の求め方が分かったので、それを使ってグラフから式を書ける。因数分解された形で書かれた多項式関数は、各因数が0になるところに x切片を持つから、対応する因数の組を持ち込めば、与えられた x切片の組を通る関数を作れる。
Factored Form of Polynomials 因数分解された多項式
If a polynomial of degree that can be factored into strictly linear factors has horizontal intercepts at then the polynomial can be written in the factored form: where the powers on each factor can be determined by the behavior of the graph at the corresponding intercept, and the stretch factor can be determined given a value of the function other than the x-intercept.
一次因数だけに因数分解できる 次の多項式が に横軸の切片を持つなら、その多項式は因数分解された形 で書ける。各因数の指数 は、対応する切片でのグラフの特徴から決められ、伸び率 は x切片以外の関数の値が一つ与えられれば決められる。
How To 手順
Given a graph of a polynomial function, write a formula for the function.
多項式関数のグラフが与えられたとき、その関数の式を書く。
1. Identify the x-intercepts of the graph to find the factors of the polynomial.2. Examine the behavior of the graph at the x-intercepts to determine the multiplicity of each factor.3. Find the polynomial of least degree containing all the factors found in the previous step.4. Use any other point on the graph (the y-intercept may be easiest) to determine the stretch factor.
1. グラフの x切片を見分けて、この多項式の因数を求める。2. x切片でのグラフの特徴を調べて、各因数の重複度を決める。3. 前の段階で求めた因数をすべて含む、次数が最も小さい多項式を求める。4. グラフ上の別の点(y切片が最も楽だろう)を使って、伸び率を決める。
Example 10例10
Writing a Formula for a Polynomial Function from the Graphグラフから多項式関数の式を書く
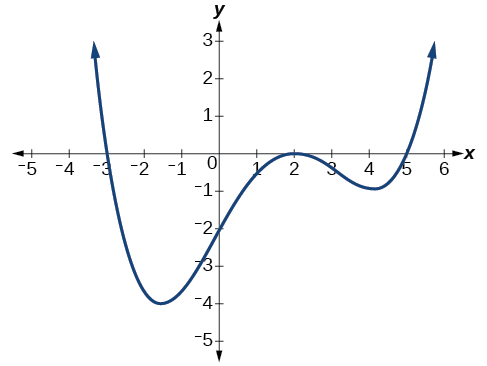
Write a formula for the polynomial function shown in Figure 19.
図19に示した多項式関数の式を書け。
Solution 解答
This graph has three x-intercepts: and The y-intercept is located at At and the graph passes through the axis linearly, suggesting the corresponding factors of the polynomial will be linear. At the graph bounces at the intercept, suggesting the corresponding factor of the polynomial will be second degree (quadratic). Together, this gives us
このグラフには x切片が三つある。 と である。y切片は にある。 と ではグラフが軸を直線的に通り抜けており、対応する多項式の因数が一次だと見込まれる。 ではグラフが切片で跳ね返っており、対応する多項式の因数が二次だと見込まれる。合わせると、次が得られる。
To determine the stretch factor, we utilize another point on the graph. We will use the intercept to solve for
伸び率を決めるために、グラフ上の別の点を使う。 切片 を使って について解く。
The graphed polynomial appears to represent the function
グラフに描かれた多項式は、関数 を表していると見られる。
Try It #5やってみよう5
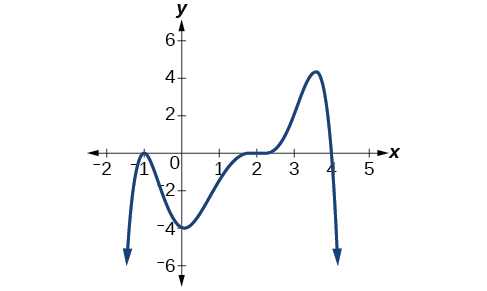
Given the graph shown in Figure 20, write a formula for the function shown.
図20に示したグラフについて、その関数の式を書け。
Using Local and Global Extrema局所の極値と大域の極値を使う
With quadratics, we were able to algebraically find the maximum or minimum value of the function by finding the vertex. For general polynomials, finding these turning points is not possible without more advanced techniques from calculus. Even then, finding where extrema occur can still be algebraically challenging. For now, we will estimate the locations of turning points using technology to generate a graph.
二次関数では、頂点を求めることで関数の最大値や最小値を代数的に求められた。一般の多項式では、微積分のより進んだ手法無しにこの折り返しの点を求めることはできない。それを使ってもなお、極値がどこで生じるかを求めるのは代数的に骨が折れうる。ここでは、機器でグラフを作り、折り返しの点の位置を見積もることにする。
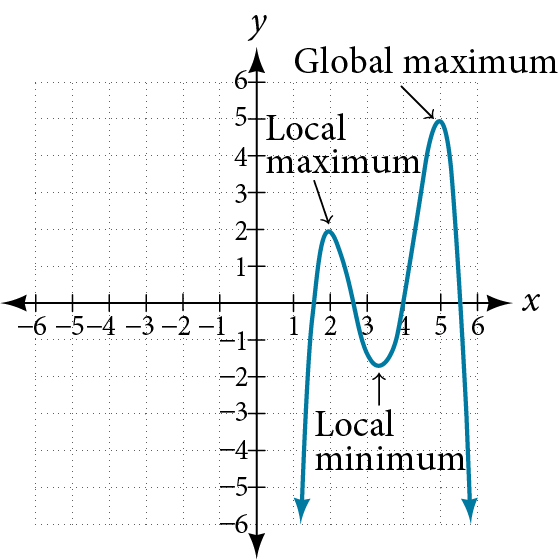
Each turning point represents a local minimum or maximum. Sometimes, a turning point is the highest or lowest point on the entire graph. In these cases, we say that the turning point is a global maximum or a global minimum. These are also referred to as the absolute maximum and absolute minimum values of the function.
どの折り返しの点も局所の最小値か最大値を表す。折り返しの点がグラフ全体の中で最も高い点や最も低い点であることもある。その場合、その折り返しの点を大域の最大値、あるいは大域の最小値という。これらは関数の絶対最大値、絶対最小値とも呼ばれる。
Local and Global Extrema 極値と最大値・最小値
A local maximum or local minimum at (sometimes called the relative maximum or minimum, respectively) is the output at the highest or lowest point on the graph in an open interval around If a function has a local maximum at then for all in an open interval around If a function has a local minimum at then for all in an open interval around
における局所の最大値や局所の最小値(それぞれ相対最大値、相対最小値とも呼ばれる)とは、 のまわりの開区間でグラフが最も高い点、あるいは最も低い点での出力である。関数が で局所の最大値をとるなら、 のまわりの開区間のすべての について である。関数が で局所の最小値をとるなら、 のまわりの開区間のすべての について である。
A global maximum or global minimum is the output at the highest or lowest point of the function. If a function has a global maximum at then for all If a function has a global minimum at then for all
大域の最大値、大域の最小値とは、その関数の最も高い点、最も低い点での出力である。関数が で大域の最大値をとるなら、すべての について である。関数が で大域の最小値をとるなら、すべての について である。
We can see the difference between local and global extrema in Figure 21.
局所の極値と大域の極値の違いは図21で見てとれる。
Q&A 疑問と答え
Do all polynomial functions have a global minimum or maximum?
多項式関数は、どれも大域の最小値か最大値を持つか。
No. Only polynomial functions of even degree have a global minimum or maximum. For example, has neither a global maximum nor a global minimum.
いいえ。大域の最小値や最大値を持つのは、偶数次の多項式関数だけである。たとえば は大域の最大値も大域の最小値も持たない。
Example 11例11
Using Local Extrema to Solve Applications局所の極値を使って応用問題を解く
An open-top box is to be constructed by cutting out squares from each corner of a 14 cm by 20 cm sheet of plastic and then folding up the sides. Find the size of squares that should be cut out to maximize the volume enclosed by the box.
14cm×20cmのプラスチック板の各角から正方形を切り取り、辺を折り上げて蓋の無い箱を作る。箱が囲む体積を最大にするには、切り取る正方形をどの大きさにすればよいか。
Solution 解答
We will start this problem by drawing a picture like that in Figure 22, labeling the width of the cut-out squares with a variable,
この問題は、図22のような絵を描き、切り取る正方形の一辺を変数 とおくところから始める。
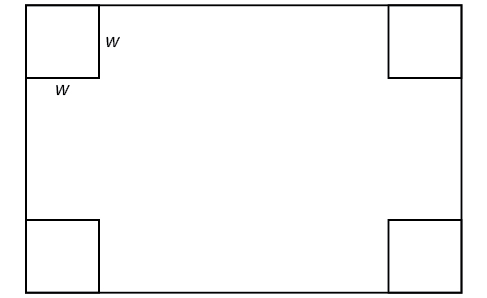
Notice that after a square is cut out from each end, it leaves a cm by cm rectangle for the base of the box, and the box will be cm tall. This gives the volume
各端から正方形を切り取ると、箱の底面として cm× cmの長方形が残り、箱の高さは cmになることに注目しよう。これで体積が得られる。
Notice, since the factors are and the three zeros are 10, 7, and 0, respectively. Because a height of 0 cm is not reasonable, we consider the only the zeros 10 and 7. The shortest side is 14 and we are cutting off two squares, so values may take on are greater than zero or less than 7. This means we will restrict the domain of this function to Using technology to sketch the graph of on this reasonable domain, we get a graph like that in Figure 23. We can use this graph to estimate the maximum value for the volume, restricted to values for that are reasonable for this problem—values from 0 to 7.
因数が 、、 なので、零点はそれぞれ10、7、0である。高さ0cmは理にかなわないので、零点は10と7だけを考える。短い辺は14で、そこから正方形を二つ切り取るので、 がとりうる値は0より大きく7より小さい。よってこの関数の定義域を に制限する。この理にかなった定義域で機器を使って のグラフの概形を描くと、図23のようなグラフが得られる。このグラフを使えば、この問題で理にかなった の値、すなわち0から7までの値に制限して、体積の最大値を見積もれる。
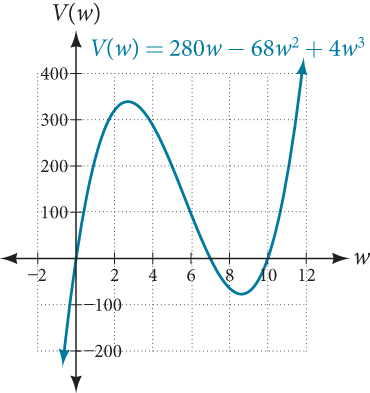
From this graph, we turn our focus to only the portion on the reasonable domain, We can estimate the maximum value to be around 340 cubic cm, which occurs when the squares are about 2.75 cm on each side. To improve this estimate, we could use advanced features of our technology, if available, or simply change our window to zoom in on our graph to produce Figure 24.
このグラフのうち、理にかなった定義域 の部分だけに目を向ける。最大値はおよそ340立方cmで、正方形の一辺がおよそ2.75cmのときに生じると見積もれる。この見積もりを良くするには、あれば機器の進んだ機能を使うか、単に表示する範囲を変えてグラフを拡大し、図24を作ればよい。
![Graph of V(w)=(20-2w)(14-2w)w where the x-axis is labeled w and the y-axis is labeled V(w) on the domain [2.4, 3].](img/60b58b6713a682bd456abdf1ee3740e5811b8b5c.jpg)
From this zoomed-in view, we can refine our estimate for the maximum volume to about 339 cubic cm, when the squares measure approximately 2.7 cm on each side.
この拡大した図から、最大の体積の見積もりをおよそ339立方cm、正方形の一辺がおよそ2.7cmのときと精しくできる。
Try It #6やってみよう6
Use technology to find the maximum and minimum values on the interval of the function
機器を使って、関数 の区間 における最大値と最小値を求めよ。
Media 教材
Access the following online resource for additional instruction and practice with graphing polynomial functions.
多項式関数のグラフについての説明と練習をさらに求めるなら、次のオンライン教材にあたるとよい。
・中間値の定理
Verbal言葉で答える問題
2. If a polynomial function of degree has distinct zeros, what do you know about the graph of the function?
2. 次の多項式関数が相異なる零点を 個持つとき、その関数のグラフについて何が分かるか。
4. Explain how the factored form of the polynomial helps us in graphing it.
4. 多項式を因数分解した形が、そのグラフを描くのにどう役立つかを説明せよ。
Algebraic代数の問題
For the following exercises, find the or t-intercepts of the polynomial functions.
次の各問について、多項式関数の 切片または t切片を求めよ。
For the following exercises, use the Intermediate Value Theorem to confirm that the given polynomial has at least one zero within the given interval.
次の各問について、中間値の定理を使って、与えられた多項式が与えられた区間に少なくとも一つ零点を持つことを確かめよ。
24. between and
24. 、 と のあいだ
26. between and
26. 、 と のあいだ
28. between and
28. 、 と のあいだ
For the following exercises, find the zeros and give the multiplicity of each.
次の各問について、零点を求め、それぞれの重複度を答えよ。
Graphicalグラフの問題
For the following exercises, graph the polynomial functions. Note and intercepts, multiplicity, and end behavior.
次の各問について、多項式関数のグラフを描け。 切片と 切片、重複度、端のふるまいを書き留めよ。
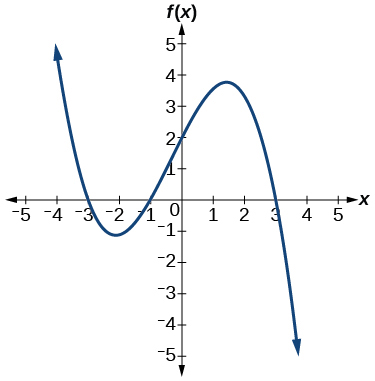
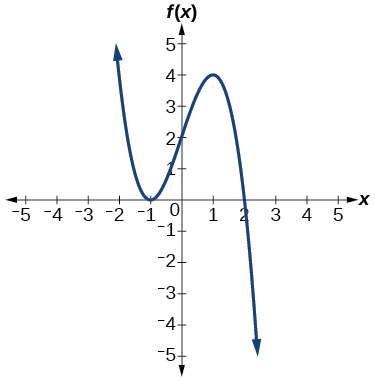
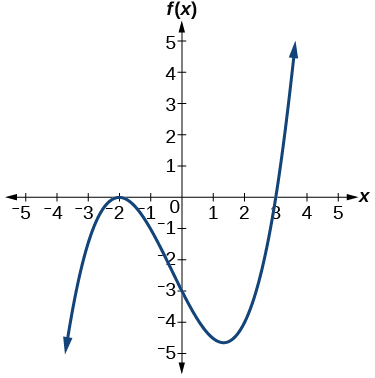
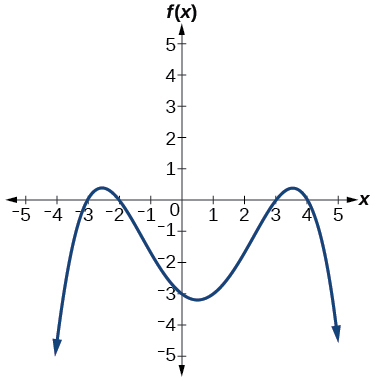
For the following exercises, use the graphs to write the formula for a polynomial function of least degree.
次の各問について、グラフを使って、次数が最も小さい多項式関数の式を書け。
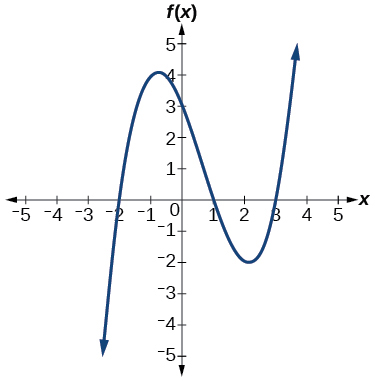
For the following exercises, use the graph to identify zeros and multiplicity.
次の各問について、グラフを使って零点と重複度を見分けよ。
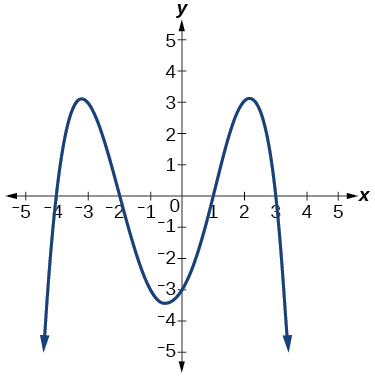
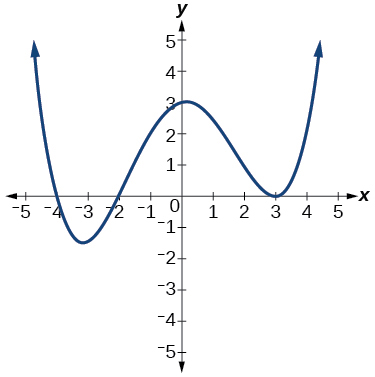
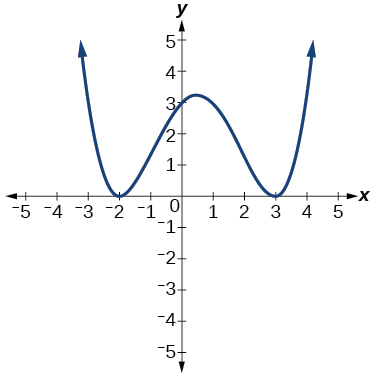
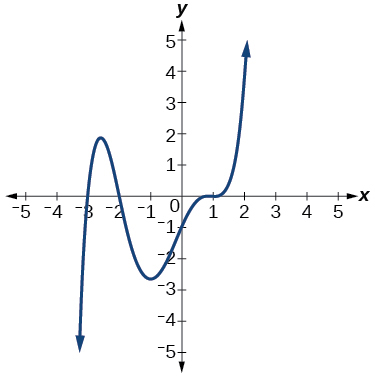
For the following exercises, use the given information about the polynomial graph to write the equation.
次の各問について、多項式のグラフについて与えられた情報を使って、その方程式を書け。
58. Degree 3. Zeros at and y-intercept at
58. 3次。零点は 、、。y切片は 。
60. Degree 4. Root of multiplicity 2 at and a roots of multiplicity 1 at and y-intercept at
60. 4次。 に重複度2の根、 と に重複度1の根。y切片は 。
62. Degree 3. Zeros at and y-intercept at
62. 3次。零点は 、、。y切片は 。
64. Degree 5. Roots of multiplicity 2 at and and a root of multiplicity 1 at
64. 5次。 と に重複度2の根、 に重複度1の根。
y-intercept at
y切片は 。
65. Degree 4. Roots of multiplicity 2 at and roots of multiplicity 1 at and
65. 4次。 に重複度2の根、 と に重複度1の根。
y-intercept at
y切片は 。
66. Double zero at and triple zero at Passes through the point
66. に二重零点、 に三重零点。点 を通る。
Technology機器を使う問題
For the following exercises, use a calculator to approximate local minima and maxima or the global minimum and maximum.
次の各問について、電卓を使って、局所の最小値と最大値、あるいは大域の最小値と最大値を近似せよ。
Extensions発展問題
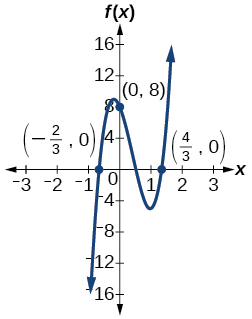
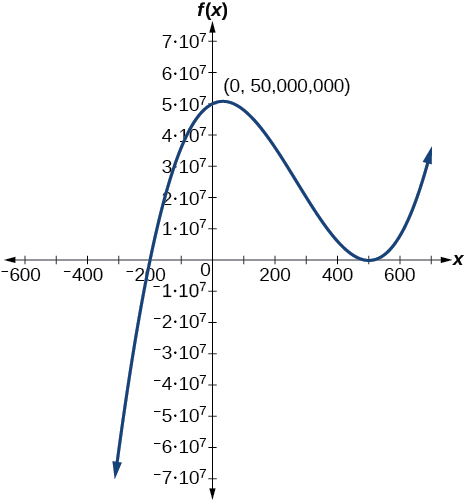
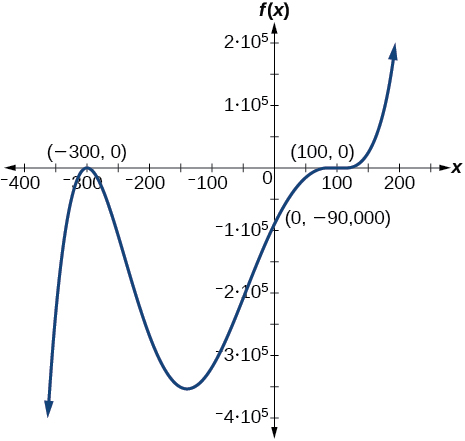
For the following exercises, use the graphs to write a polynomial function of least degree.
次の各問について、グラフを使って、次数が最も小さい多項式関数を書け。
Real-World Applications応用問題
For the following exercises, write the polynomial function that models the given situation.
次の各問について、与えられた状況を表す多項式関数を書け。
75. A rectangle has a length of 10 units and a width of 8 units. Squares of by units are cut out of each corner, and then the sides are folded up to create an open box. Express the volume of the box as a polynomial function in terms of
75. ある長方形は縦が10単位、横が8単位である。各角から 単位× 単位の正方形を切り取り、辺を折り上げて蓋の無い箱を作る。この箱の体積を の多項式関数として表せ。
76. Consider the same rectangle of the preceding problem. Squares of by units are cut out of each corner. Express the volume of the box as a polynomial in terms of
76. 前問と同じ長方形を考える。各角から 単位× 単位の正方形を切り取る。この箱の体積を の多項式として表せ。
78. A cylinder has a radius of units and a height of 3 units greater. Express the volume of the cylinder as a polynomial function.
78. ある円柱の半径は 単位、高さはそれより3単位大きい。この円柱の体積を多項式関数として表せ。