プリンピキア

第4章一次関数Linear Functions

Answer Key解答
Solution 1解答 1

m=43 02 =1 2 =1 2 ; decreasing because m<0.

m=43 02 =1 2 =1 2 ; m<0. なので減少する

Solution 2解答 2

m=1,8681,442 2,0122,009 =426 3 =142 people per year

Solution 3解答 3

y=7x+3

Solution 4解答 4

H( x )=0.5x+12.5

Solution 5解答 5

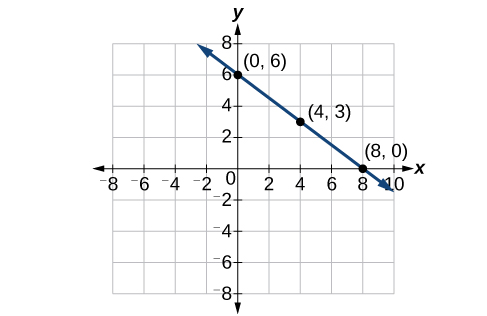
This graph shows a decreasing function graphed on an x y coordinate plane. The x-axis runs from negative 8 to 10 and the y-axis runs from negative 8 to 8. The function passes through the points (0,6), (4,3) and (8,0).

Solution 6解答 6

Possible answers include (3,7), (6,9), or (9,11).

ありうる答えは (3,7)(6,9)(9,11) など

Solution 7解答 7

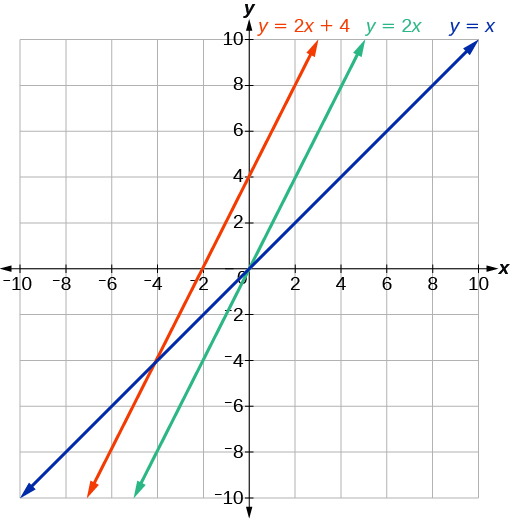
This graph shows three functions on an x, y coordinate plane. One shows an increasing function y = x that passes through points (0, 0) and (2, 2).  A second shows an increasing function y = 2 times x that passes through the points (0, 0) and (2, 4).  The third is an increasing function y = 2 times x plus 4 and passes through the points (0, 4) and (2, 8).

Solution 8解答 8

( 16,0 )

Solution 9解答 9

f(x)=2x;g(x)=1 2 x

Solution 10解答 10

y=1 3 x+6

Solution 1解答 1

C( x )=0.25x+25,000
The y-intercept is (0,25,000). If the company does not produce a single doughnut, they still incur a cost of $25,000.

C( x )=0.25x+25,000 y切片は (0,25,000) である。会社が揚げ菓子を一つも作らなくても、25,000ドルの費用はかかる。

Solution 2解答 2

41,100 2020

Solution 3解答 3

21.57 miles

21.57マイル

Solution 1解答 1

54°F

Solution 2解答 2

150.871 billion gallons; extrapolation

1,508.71億ガロン。外挿

4.1 Section Exercises4.1 節末問題

Solution 1解答 1

Terry starts at an elevation of 3000 feet and descends 70 feet per second.

Terry は標高3000フィートから始め、毎秒70フィート下る。

Solution 3解答 3

d( t )=10010t

Solution 5解答 5

The point of intersection is ( a,a ). This is because for the horizontal line, all of the y coordinates are a and for the vertical line, all of the x coordinates are a. The point of intersection is on both lines and therefore will have these two characteristics.

交点は ( a,a ) である。横の直線では y 座標がすべて a であり、縦の直線では x 座標がすべて a だからである。交点は両方の直線の上にあるので、この二つの性質を併せ持つ。
Solution 7解答 7

Yes

はい

Solution 9解答 9

Yes

はい

Solution 11解答 11

No

いいえ

Solution 13解答 13

Yes

はい

Solution 15解答 15

Increasing

増加する

Solution 17解答 17

Decreasing

減少する

Solution 19解答 19

Decreasing

減少する

Solution 21解答 21

Increasing

増加する

Solution 23解答 23

Decreasing

減少する

Solution 25解答 25

2

Solution 27解答 27

–2

Solution 29解答 29

y=3 5 x1

Solution 31解答 31

y=3x2

Solution 33解答 33

y=1 3 x+11 3

Solution 35解答 35

y=1.5x3

Solution 37解答 37

perpendicular

垂直

Solution 39解答 39

parallel

平行

Solution 41解答 41

f(0)=(0)+2 f(0)=2 yint:(0,2) 0=x+2 xint:(2,0)

Solution 43解答 43

h(0)=3(0)5 h(0)=5 yint:(0,5) 0=3x5 xint:( 5 3 ,0 )

Solution 45解答 45

2x+5y=20 2(0)+5y=20 5y=20 y=4 yint:(0,4) 2x+5(0)=20 x=10 xint:(10,0)

Solution 47解答 47

Line 1: m = –10 Line 2: m = –10 Parallel

直線1: m = –10 直線2: m = –10 平行

Solution 49解答 49

Line 1: m = –2 Line 2: m = 1 Neither

直線1: m = –2 直線2: m = 1 どちらでもない

Solution 51解答 51

Line 1: m=2   Line 2: m=2   Parallel

Solution 53解答 53

y=3x3

Solution 55解答 55

y=1 3 t+2

Solution 57解答 57

0

Solution 59解答 59

y=5 4 x+5

Solution 61解答 61

y=3x1

Solution 63解答 63

y=2.5

Solution 65解答 65

F

Solution 67解答 67

C

Solution 69解答 69

A

Solution 71解答 71

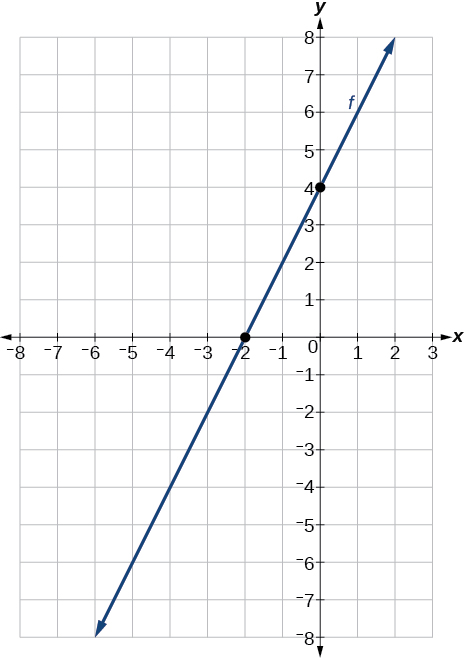
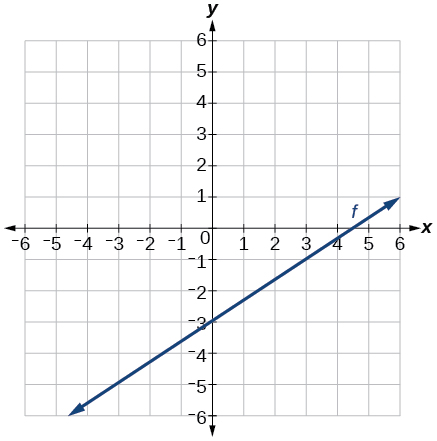
Graph of f with an x-intercept at -4 and y-intercept at -2 which gives us a slope of: 2.

Solution 73解答 73

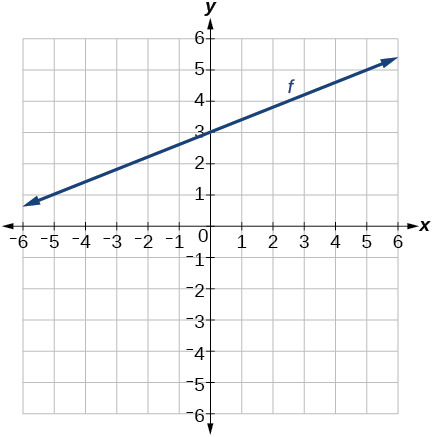
Graph of f with an y-intercept at 3 and a slope of 2/5.

Solution 75解答 75

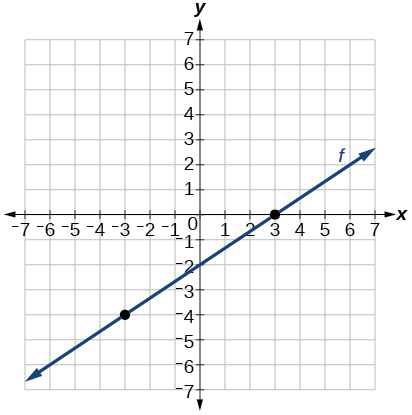
Graph of a line that passes through the points (-3, -4) and (3, 0) which results in a slope of 2/3.

Solution 77解答 77

Graph of g(x) = -3x + 2 which goes through the points (0,2) and (1,-1) with a slope of -3.

Solution 79解答 79

Graph of k(x) =  .  This line goes through the points (0,-3) and (3,-1) and has a slope of 2/3.

Solution 81解答 81

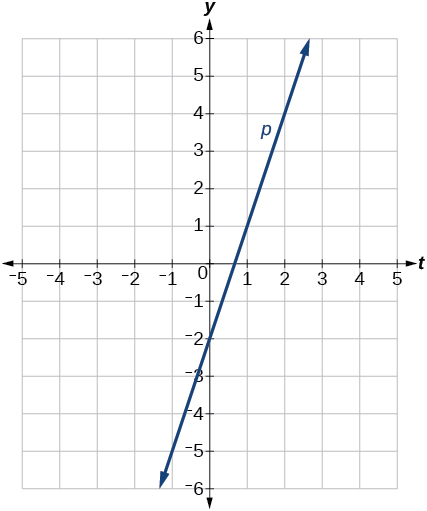
Graph of the line p(t) = 3t -2.  This line goes through the points (0,-2) and (1,1) which has a slope of 3.

Solution 83解答 83

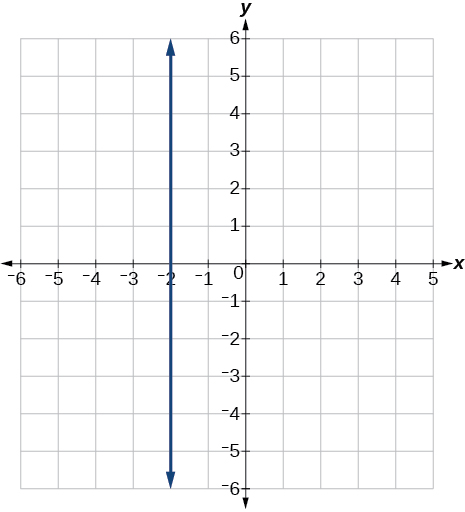
Graph of x = -2 which is a line of undefined slope that goes through the point (-2,0).

Solution 85解答 85

y=3

Solution 87解答 87

x=3

Solution 89解答 89

Linear, g(x)=3x+5

一次。g(x)=3x+5

Solution 91解答 91

Linear, f(x)=5x5

一次。f(x)=5x5

Solution 93解答 93

Linear, g(x)=25 2 x+6

一次。g(x)=25 2 x+6

Solution 95解答 95

Linear, f(x)=10x24

一次。f(x)=10x24

Solution 97解答 97

f(x)=58x+17.3

Solution 99解答 99

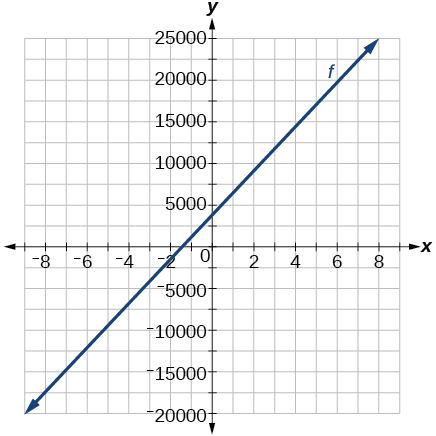
Graph of f(x) = 2500x + 4000

Solution 101解答 101

a=11,900,b=1000.1q(p)=1000p100

Solution 103解答 103

graph where the function's slope is 75 and y-intercept is –22.5

Solution 105解答 105

y=16 3

Solution 107解答 107

x=a

Solution 109解答 109

y=dcax adca

Solution 111解答 111

y=100x98

Solution 113解答 113

x<1999 201 , x>1999 201

Solution 115解答 115

$45 per training session.

1回の指導につき45ドル。

Solution 117解答 117

The rate of change is 0.1. For every additional minute talked, the monthly charge increases by $0.1 or 10 cents. The initial value is 24. When there are no minutes talked, initially the charge is $24.

変化の割合は0.1である。通話が1分増えるごとに、月々の請求額が0.1ドルすなわち10セント増える。初めの値は24である。通話が0分のとき、請求額は最初から24ドルである。

Solution 119解答 119

The slope is –400. this means for every year between 1960 and 1989, the population dropped by 400 per year in the city.

傾きは–400である。これは、1960年から1989年までの各年で、この都市の人口が年に400人ずつ減ったことを意味する。

Solution 121解答 121

C

4.2 Section Exercises4.2 節末問題

Solution 1解答 1

Determine the independent variable. This is the variable upon which the output depends.

独立変数を決める。これは出力が依る側の変数である。

Solution 3解答 3

To determine the initial value, find the output when the input is equal to zero.

初めの値を決めるには、入力が0のときの出力を求める。

Solution 5解答 5

6 square units

6平方単位

Solution 7解答 7

20.01 square units

20.01平方単位

Solution 9解答 9

2,300

Solution 11解答 11

64,170

Solution 13解答 13

P( t )=75,000+2500t

Solution 15解答 15

(–30, 0) Thirty years before the start of this model, the town had no citizens. (0, 75,000) Initially, the town had a population of 75,000.

(–30, 0) このモデルが始まる30年前、この町に住民はいなかった。(0, 75,000) 初め、この町の人口は75,000人だった。

Solution 17解答 17

Ten years after the model began

モデルが始まってから10年後

Solution 19解答 19

W(t)=0.5t+7.5

Solution 21解答 21

( 15,0 ) : The x-intercept is not a plausible set of data for this model because it means the baby weighed 0 pounds 15 months prior to birth. ( 0,7.5 ) : The baby weighed 7.5 pounds at birth.

( 15,0 ): この x切片は、このモデルではありえない資料である。生まれる15か月前に赤ん坊の体重が0ポンドだったという意味になるからである。( 0,7.5 ): 赤ん坊は生まれたとき7.5ポンドだった。

Solution 23解答 23

At age 5.8 months

生後5.8か月のとき

Solution 25解答 25

C( t )=12,025205t

Solution 27解答 27

( 58.7,0 ): In roughly 59 years, the number of people inflicted with the common cold would be 0. ( 0,12,025 ) Initially there were 12,025 people afflicted by the common cold.

( 58.7,0 ): およそ59年後に、風邪にかかる人の数は0になる。( 0,12,025 ) 初め、風邪にかかっていた人は12,025人だった。

Solution 29解答 29

2063

Solution 31解答 31

y=2t+180

Solution 33解答 33

In 2070, the company’s profit will be zero.

2070年に、この会社の利益は0になる。

Solution 35解答 35

y=30t300

Solution 37解答 37

(10, 0) In the year 1990, the company’s profits were zero

(10, 0) 1990年に、この会社の利益は0だった。

Solution 39解答 39

Hawaii

ハワイ

Solution 41解答 41

During the year 1933

1933年のうち

Solution 43解答 43

$105,620

Solution 45解答 45

696 people4 years174 people per year305 peopleP(t) = 305 + 174t2,219 people

696人4年年に174人305人2,219人

Solution 47解答 47

C(x) = 0.15x + 10The flat monthly fee is $10 and there is a $0.15 fee for each additional minute used$113.05

定額の月額料金は10ドルで、超過した1分ごとに0.15ドルかかる

Solution 49解答 49

P( t )=190t+4,3606,640 moose

6,640頭

Solution 51解答 51

R(t)=2.1t + 165.5 billion cubic feetDuring the year 2017

55億立方フィート2017年のうち

Solution 53解答 53

More than 133 minutes

133分より多く

Solution 55解答 55

More than $42,857.14 worth of jewelry

42,857.14ドルより多く宝飾品を売る

Solution 57解答 57

More than $66,666.67 in sales

売上が66,666.67ドルより多く

4.3 Section Exercises4.3 節末問題

Solution 1解答 1

When our model no longer applies, after some value in the domain, the model itself doesn’t hold.

定義域のある値より先でモデルが通用しなくなったとき、そのモデル自体が成り立たなくなる。

Solution 3解答 3

We predict a value outside the domain and range of the data.

資料の定義域と値域の外で値を予測することである。

Solution 5解答 5

The closer the number is to 1, the less scattered the data, the closer the number is to 0, the more scattered the data.

数が1に近いほど資料の散らばりは小さく、0に近いほど散らばりは大きい。
Solution 7解答 7

61.966 years

61.966年

Solution 9解答 9

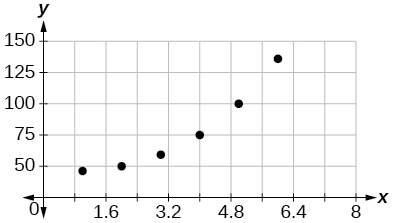
Scatter plot with a collection of points appearing at (1,46); (2,50); (3,59); (4,75); (5, 100); and (6,136); they do not appear linear

No.

いいえ。

Solution 11解答 11

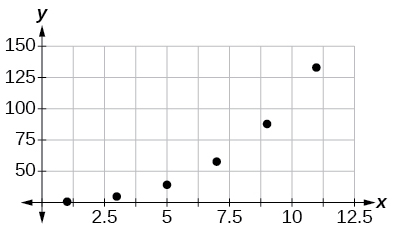
Scatterplot with a collection of points at (1,1); (3,9); (5,28); (7,65); (9,125); and (11,216); they do not appear linear

No.

いいえ。

Solution 13解答 13

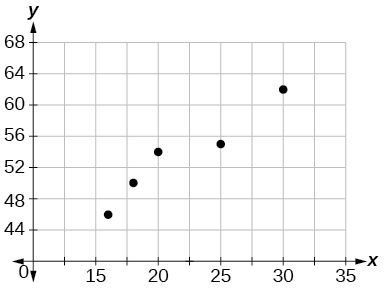
Scatterplot with a collection of points at (16,46); (18,50); (20,54); (25,55); and (30,62); they appear nonlinear

Interpolation. About 60°F.

内挿。およそ 60°F

Solution 15解答 15

This value of r indicates a strong negative correlation or slope, so C

Solution 17解答 17

This value of r indicates a weak negative correlation, so B

Solution 19解答 19

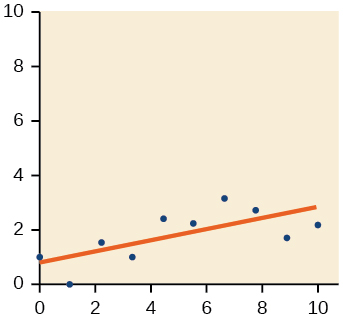
Scatter plot with domain 0 to 10 and a range from -1 to 4 with the line of best fit drawn going through the points: (0,1.5); (1.5, -0.1); (2.1,1.9); (3.4, 1.5); (4.5,2.5); (5.8,2.2); (6.8,3.8); (7.8,3.6); (8.8,2); and (10,2.4).

Solution 21解答 21

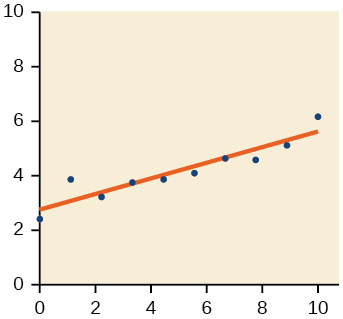
Scatter plot with a domain of 0 to 10 and a range of 2 to 6 and the line of best fit going through the points: (0,2.1); (1,3.9); (2.1,3.6); (3.6,3.9); (4.4,4); (5.6,4.2); (6.8,5); (7.8,5); (9,5.6); and (10,6)

Solution 23解答 23

Yes, trend appears linear because r=0.985 and will exceed 12,000 near midyear, 2016, 24.6 years since 1992.

はい。r=0.985 なので傾向は一次に見える。1992年から24.6年後、2016年の半ばごろに12,000を超える。

Solution 25解答 25

y=1.640x+13.800, r=0.987

Solution 27解答 27

y=0.962x+26.86,   r=0.965

Solution 29解答 29

y=1.981x+60.197; r=0.998

Solution 31解答 31

y=0.121x38.841,r=0.998

Solution 33解答 33

(−2,−6),(1,−12),(5,−20),(6,−22),(9,−28); Yes, the function is a good fit.

(−2,−6),(1,−12),(5,−20),(6,−22),(9,−28); はい、この関数はよく当てはまる。

Solution 35解答 35

(189.8,0) If 18,980 units are sold, the company will have a profit of zero dollars.

(189.8,0) 18,980個売れると、この会社の利益は0ドルになる。

Solution 37解答 37

y=0.00587x+1985.41

Solution 39解答 39

y=20.25x671.5

Solution 41解答 41

y=10.75x+742.50

Review Exercises復習問題

Solution 1解答 1

Yes

はい

Solution 3解答 3

Increasing

増加する

Solution 5解答 5

y=3x+26

Solution 7解答 7

3

Solution 9解答 9

y=2x2

Solution 11解答 11

Not linear.

一次ではない。

Solution 13解答 13

parallel

平行

Solution 15解答 15

(–9,0);(0,–7)

Solution 17解答 17

Line 1: m=2; Line 2: m=2; Parallel

直線1: m=2; 直線2: m=2; 平行

Solution 19解答 19

y=0.2x+21

Solution 21解答 21


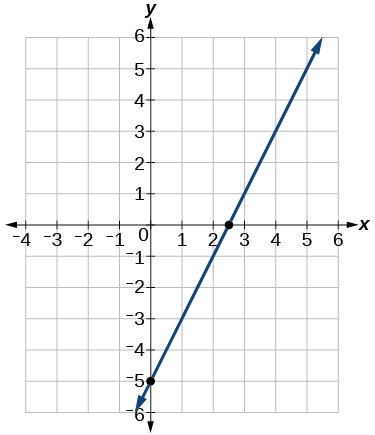
This is a graph of f of t = 2 times t minus 5 on a x, y coordinate plane.  The x-axis ranges from -4 to 6 and the y-axis ranges from -6 to 6. The curve is an increasing linear function that goes through the points (0,-5) and (2.5,0).

Solution 23解答 23

More than 250

250より多く

Solution 25解答 25

118,000

Solution 27解答 27

y=300x+11,500

Solution 29解答 29

800100 students per yearP( t )=100t+1700

年に100人

Solution 31解答 31

18,500

Solution 33解答 33

$91,625

Solution 35解答 35

Extrapolation

外挿


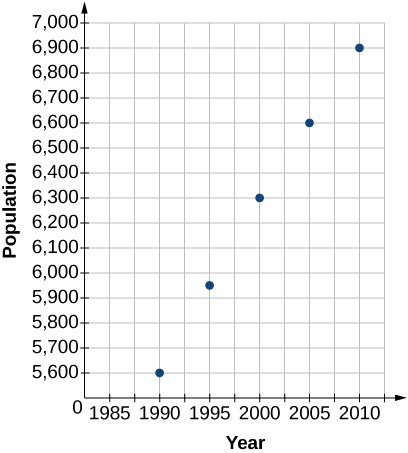
Scatter plot with the points (1990,5600); (1995,5950); (2000,6300); (2005,6600); and (2010,6900).

Solution 37解答 37


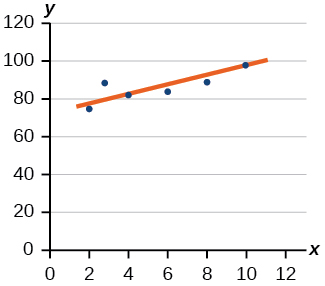
Scatter plot of: (2,78); (4,81); (6,85); (8,90); and (10,99) and the line of best fit running through these points.  The line of best fit goes through most of the points.

Solution 39解答 39

2023

Solution 41解答 41

y=1.294x+49.412; r=0.974

Solution 43解答 43

2027

Solution 45解答 45

7,660

Practice Test実力テスト

Solution 1解答 1

Yes

はい

Solution 3解答 3

Increasing

増加する

Solution 5解答 5

y = −1.5x − 6

Solution 7解答 7

y = −2x − 1

Solution 9解答 9

No

いいえ

Solution 11解答 11

Perpendicular

垂直

Solution 13解答 13

(−7, 0); (0, −2)

Solution 15解答 15

y = −0.25x + 12

Solution 17解答 17

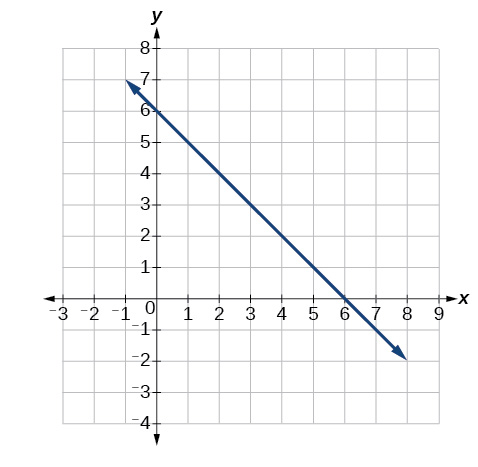
A graph of a straight blue line on a Cartesian plane, extending from the top left to the bottom right, indicating a negative slope and intercepts at (0,6) and (6,0).

Slope = −1 and y-intercept = 6

傾き = −1、y切片 = 6

Solution 19解答 19

150

Solution 21解答 21

165,000

Solution 23解答 23

y = 875x + 10,625

Solution 25解答 25

375dropped an average of 46.875, or about 47 people per yeary = −46.875t + 1250

平均して年に46.875人、およそ47人ずつ減った

Solution 27解答 27

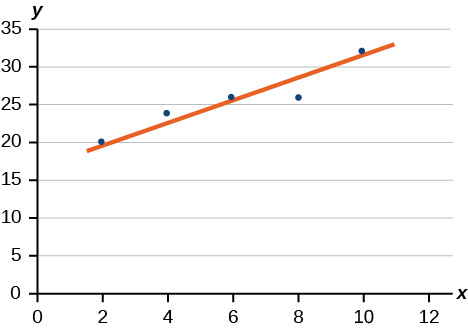
A scatter plot with five data points and an orange regression line showing a positive linear relationship. The x-axis ranges from 0 to 12, and the y-axis ranges from 0 to 35.

Solution 29解答 29

In early 2018

2018年の初めごろ

Solution 31解答 31

y = 0.00455x + 1979.5

Solution 33解答 33

r = 0.999