第4章一次関数Linear Functions
Review Exercises復習問題
Linear Functions一次関数
2. Determine whether the algebraic equation is linear.
2. 次の代数の方程式が一次かどうかを判定せよ。
4. Determine whether the function is increasing or decreasing.
4. この関数が増加するか減少するかを判定せよ。
5. Given each set of information, find a linear equation that satisfies the given conditions, if possible.
5. 与えられた条件を満たす一次方程式があれば求めよ。
Passes through and
と を通る
6. Given each set of information, find a linear equation that satisfies the given conditions, if possible.
6. 与えられた条件を満たす一次方程式があれば求めよ。
x-intercept at and y-intercept at
x切片が 、y切片が
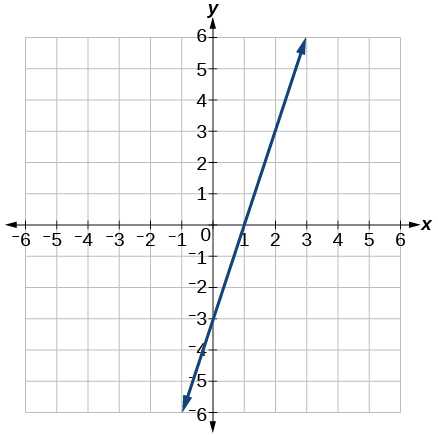
8. Find the slope of the line graphed.
8. 描かれた直線の傾きを求めよ。
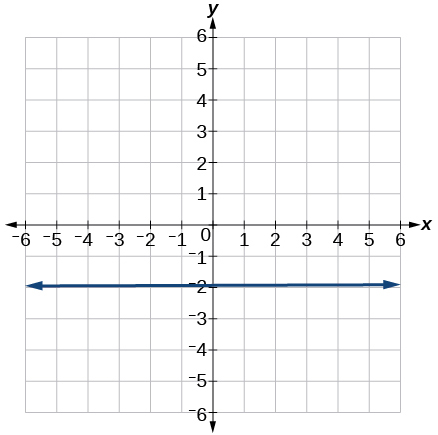
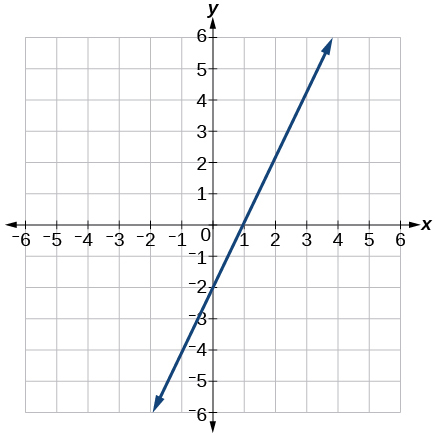
10. Does the following table represent a linear function? If so, find the linear equation that models the data.
10. 次の表は一次関数を表しているか。表しているなら、その資料を表す一次方程式を求めよ。
| x | –4 | 0 | 2 | 10 |
| g(x) | 18 | –2 | –12 | –52 |
11. Does the following table represent a linear function? If so, find the linear equation that models the data.
11. 次の表は一次関数を表しているか。表しているなら、その資料を表す一次方程式を求めよ。
| x | 6 | 8 | 12 | 26 |
| g(x) | –8 | –12 | –18 | –46 |
12. On June 1st, a company has $4,000,000 profit. If the company then loses 150,000 dollars per day thereafter in the month of June, what is the company’s profit nth day after June 1st?
12. 6月1日、ある会社の利益は4,000,000ドルである。6月のあいだ、その後は1日に150,000ドルずつ失うとすると、6月1日から n 日後の会社の利益はいくらか。
For the following exercises, determine whether the lines given by the equations below are parallel, perpendicular, or neither parallel nor perpendicular:
次の各問について、下の方程式が表す直線どうしが平行か、垂直か、そのどちらでもないかを判定せよ。
For the following exercises, find the x- and y- intercepts of the given equation
次の各問について、与えられた方程式の x切片と y切片を求めよ。
For the following exercises, use the descriptions of the pairs of lines to find the slopes of Line 1 and Line 2. Is each pair of lines parallel, perpendicular, or neither?
次の各問について、直線の組の説明から直線1と直線2の傾きを求めよ。各組は平行か、垂直か、どちらでもないか。
18. Line 1: Passes through and
18. 直線1: と を通る
Line 2: Passes through and
直線2: と を通る
20. Find the equation of a line with a y- intercept of and slope
20. y切片が 、傾きが である直線の方程式を求めよ。
22. Find the point of intersection for the 2 linear functions:
22. 二つの一次関数 の交点を求めよ。
Plan A: 25 dollars per day and 10 cents per mile
案A: 1日25ドルに1マイルあたり10セント
Plan B: 50 dollars per day with free unlimited mileage
案B: 1日50ドルで走行距離は無制限
How many miles would you need to drive for plan B to save you money?
案Bの方が得になるには、何マイル走る必要があるか。
Modeling with Linear Functions一次関数で表す
24. Find the area of a triangle bounded by the y axis, the line and the line perpendicular to that passes through the origin.
24. y軸、直線 、そして原点を通り に垂直な直線で囲まれた三角形の面積を求めよ。
26. The number of people afflicted with the common cold in the winter months dropped steadily by 50 each year since 2004 until 2010. In 2004, 875 people were inflicted.
26. 冬季に風邪にかかる人の数は、2004年から2010年まで毎年50人ずつ着実に減った。2004年には875人がかかった。
Find the linear function that models the number of people afflicted with the common cold C as a function of the year, When will no one be afflicted?
年 の関数として、風邪にかかる人の数 C を表す一次関数を求めよ。誰もかからなくなるのはいつか。
For the following exercises, use the graph in Figure 1 showing the profit, in thousands of dollars, of a company in a given year, where represents years since 1980.
次の各問では、図1のグラフを使え。これは年 におけるある会社の利益 (千ドル)を示す。ここで は1980年からの年数である。
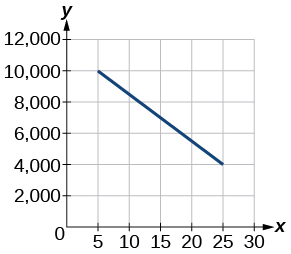
28. Find and interpret the y-intercept.
28. y切片を求め、その意味を述べよ。
For the following exercise, consider this scenario: In 2004, a school population was 1,700. By 2012 the population had grown to 2,500.
次の問は、この場面について考える。2004年、ある学校の在籍者数は1,700人だった。2012年には2,500人に増えていた。
ⓐHow much did the population grow between the year 2004 and 2012?ⓑWhat is the average population growth per year?ⓒFind an equation for the population, P, of the school t years after 2004.
ⓐ2004年から2012年のあいだに在籍者数はどれだけ増えたか。ⓑ1年あたりの平均の増加数はいくらか。ⓒ2004年から t 年後の学校の在籍者数 P を表す方程式を求めよ。
For the following exercises, consider this scenario: In 2000, the moose population in a park was measured to be 6,500. By 2010, the population was measured to be 12,500. Assume the population continues to change linearly.
次の各問は、この場面について考える。2000年、ある公園のヘラジカの数は6,500頭と測られた。2010年には12,500頭と測られた。個体数は一次で変わり続けるものとする。
30. Find a formula for the moose population, .
30. ヘラジカの数 の式を求めよ。
For the following exercises, consider this scenario: The median home values in subdivisions Pima Central and East Valley (adjusted for inflation) are shown in Table 1. Assume that the house values are changing linearly.
次の各問は、この場面について考える。Pima Central と East Valley という区画の住宅価格の中央値(物価の変動を調整済み)を表1に示す。住宅の価値は一次で変わるものとする。
| Year年 | Pima Central | East Valley |
|---|---|---|
| 1970 | 32,000 | 120,250 |
| 2010 | 85,000 | 150,000 |
32. In which subdivision have home values increased at a higher rate?
32. 住宅の価値がより高い割合で上がったのはどちらの区画か。
Fitting Linear Models to Dataデータへの一次モデルの当てはめ
34. Draw a scatter plot for the data in Table 2. Then determine whether the data appears to be linearly related.
34. 表2の資料の散布図を描け。そのうえで、資料に一次の関係がありそうかを判定せよ。
| 0 | -105 |
| 2 | -50 |
| 4 | 1 |
| 6 | 55 |
| 8 | 105 |
| 10 | 160 |
35. Draw a scatter plot for the data in Table 3. If we wanted to know when the population would reach 15,000, would the answer involve interpolation or extrapolation?
35. 表3の資料の散布図を描け。人口が15,000人に達する時期を知りたいとき、その答えは内挿によるか外挿によるか。
| Year年 | Population人口 |
|---|---|
| 1990 | 5,600 |
| 1995 | 5,950 |
| 2000 | 6,300 |
| 2005 | 6,600 |
| 2010 | 6,900 |
36. Eight students were asked to estimate their score on a 10-point quiz. Their estimated and actual scores are given in Table 4. Plot the points, then sketch a line that fits the data.
36. 8人の学生に、10点満点の小テストの自分の点数を予想させた。予想の点数と実際の点数を表4に示す。点を打ち、そのうえで資料に当てはまる直線の概形を描け。
| Predicted予想 | Actual実際 |
|---|---|
| 6 | 6 |
| 7 | 7 |
| 7 | 8 |
| 8 | 8 |
| 7 | 9 |
| 9 | 10 |
| 10 | 10 |
| 10 | 9 |
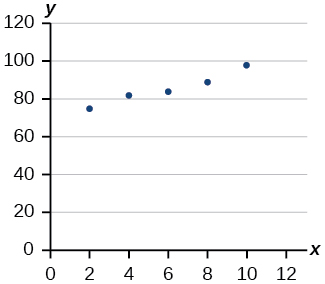
For the following exercises, consider the data in Table 5, which shows the percent of unemployed in a city of people 25 years or older who are college graduates is given below, by year.
次の各問では、表5の資料を考えよ。これは、ある都市で25歳以上の失業者のうち大学を出た人の割合を年ごとに示している。
| Year年 | 2000 | 2002 | 2005 | 2007 | 2010 |
| Percent Graduates卒業者の割合 | 6.5 | 7.0 | 7.4 | 8.2 | 9.0 |
38. Determine whether the trend appears to be linear. If so, and assuming the trend continues, find a linear regression model to predict the percent of unemployed in a given year to three decimal places.
38. 傾向が一次に見えるかを判定せよ。一次に見え、その傾向が続くとすると、ある年の失業者の割合を予測する線形回帰のモデルを小数第三位まで求めよ。
40. Based on the set of data given in Table 6, calculate the regression line using a calculator or other technology tool, and determine the correlation coefficient to three decimal places.
40. 表6の資料をもとに、電卓またはその他の機器を使って回帰直線を計算し、相関係数を小数第三位まで求めよ。
| 17 | 20 | 23 | 26 | 29 | |
| 15 | 25 | 31 | 37 | 40 |
41. Based on the set of data given in Table 7, calculate the regression line using a calculator or other technology tool, and determine the correlation coefficient to three decimal places.
41. 表7の資料をもとに、電卓またはその他の機器を使って回帰直線を計算し、相関係数を小数第三位まで求めよ。
| 10 | 12 | 15 | 18 | 20 | |
| 36 | 34 | 30 | 28 | 22 |
For the following exercises, consider this scenario: The population of a city increased steadily over a ten-year span. The following ordered pairs show the population and the year over the ten-year span (population, year) for specific recorded years:
次の各問は、この場面について考える。ある都市の人口は10年にわたって着実に増えた。次の順序対は、その10年のうち記録のある年について、人口と年を(人口, 年)の形で示している。
42. Use linear regression to determine a function where the year depends on the population, to three decimal places of accuracy.
42. 線形回帰で関数 を求めよ。ここで年は人口に依る。小数第三位まで求めよ。
44. What is the correlation coefficient for this model to three decimal places of accuracy?
44. このモデルの相関係数を小数第三位まで求めよ。