第4章一次関数Linear Functions
Graphing Linear Functions一次関数のグラフを描く
Now that we’ve seen and interpreted graphs of linear functions, let’s take a look at how to create the graphs. There are three basic methods of graphing linear functions. The first is by plotting points and then drawing a line through the points. The second is by using the y-intercept and slope. And the third method is by using transformations of the identity function
一次関数のグラフを見て読み取ってきたので、今度はその描き方を見よう。一次関数のグラフを描く基本の方法は三つある。一つ目は点を打ち、その点を通る直線を引くこと。二つ目は y切片と傾きを使うこと。三つ目は恒等関数 の変形を使うことである。
Graphing a Function by Plotting Points点を打って関数のグラフを描く
To find points of a function, we can choose input values, evaluate the function at these input values, and calculate output values. The input values and corresponding output values form coordinate pairs. We then plot the coordinate pairs on a grid. In general, we should evaluate the function at a minimum of two inputs in order to find at least two points on the graph. For example, given the function, we might use the input values 1 and 2. Evaluating the function for an input value of 1 yields an output value of 2, which is represented by the point Evaluating the function for an input value of 2 yields an output value of 4, which is represented by the point Choosing three points is often advisable because if all three points do not fall on the same line, we know we made an error.
関数の点を求めるには、入力値を選び、その入力値での関数の値を求めて出力値を計算すればよい。入力値と対応する出力値が座標の組をなす。その座標の組を格子の上に打つ。グラフ上の点を少なくとも二つ得るため、一般には入力を最低二つとって関数の値を求めるべきである。たとえば関数 が与えられたら、入力値1と2を使えばよい。入力値1での関数の値は出力値2になり、これは点 で表される。入力値2での値は出力値4になり、これは点 で表される。点を三つ選ぶのがよいことが多い。三点が同じ直線に乗らなければ、どこかで間違えたと分かるからである。
How To 手順
Given a linear function, graph by plotting points.
一次関数が与えられたとき、点を打ってグラフを描く。
1. Choose a minimum of two input values.2. Evaluate the function at each input value.3. Use the resulting output values to identify coordinate pairs.4. Plot the coordinate pairs on a grid.5. Draw a line through the points.
1. 入力値を最低二つ選ぶ。2. 各入力値での関数の値を求める。3. 得られた出力値を使って座標の組を決める。4. 座標の組を格子の上に打つ。5. その点を通る直線を引く。
Example 11例11
Graphing by Plotting Points点を打ってグラフを描く
Graph by plotting points.
点を打って のグラフを描け。
Solution 解答
Begin by choosing input values. This function includes a fraction with a denominator of 3, so let’s choose multiples of 3 as input values. We will choose 0, 3, and 6.
まず入力値を選ぶ。この関数には分母が3の分数が入っているので、入力値には3の倍数を選ぼう。0、3、6を選ぶ。
Evaluate the function at each input value, and use the output value to identify coordinate pairs.
各入力値での関数の値を求め、その出力値を使って座標の組を決める。
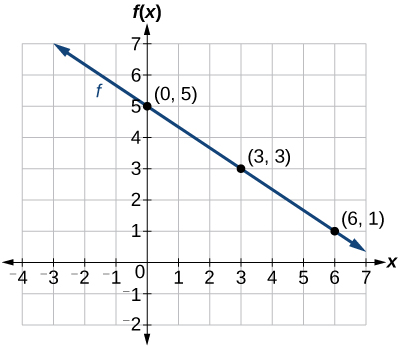
Plot the coordinate pairs and draw a line through the points. Figure 11 represents the graph of the function
座標の組を打ち、その点を通る直線を引く。図11に関数 のグラフを示す。
Analysis 考察
The graph of the function is a line as expected for a linear function. In addition, the graph has a downward slant, which indicates a negative slope. This is also expected from the negative, constant rate of change in the equation for the function.
一次関数らしく、この関数のグラフは直線である。さらにグラフは右へ下がっており、傾きが負であることを示している。これも、この関数の方程式の負で一定の変化の割合から見込まれるとおりである。
Try It #5やってみよう5
Graph by plotting points.
点を打って のグラフを描け。
Graphing a Function Using y-intercept and Slopey切片と傾きを使って関数のグラフを描く
Another way to graph linear functions is by using specific characteristics of the function rather than plotting points. The first characteristic is its y-intercept, which is the point at which the input value is zero. To find the y-intercept, we can set in the equation.
一次関数のグラフを描くもう一つの方法は、点を打つ代わりに関数の決まった特徴を使うことである。一つ目の特徴が y切片で、入力値が0になる点である。y切片を求めるには、方程式で とおけばよい。
The other characteristic of the linear function is its slope.
一次関数のもう一つの特徴が傾きである。
Let’s consider the following function.
次の関数を考えよう。
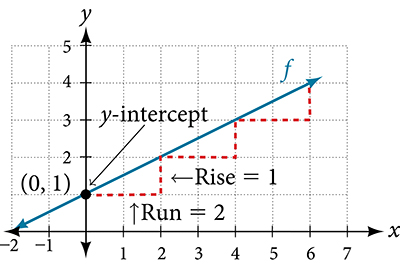
The slope is Because the slope is positive, we know the graph will slant upward from left to right. The y-intercept is the point on the graph when The graph crosses the y-axis at Now we know the slope and the y-intercept. We can begin graphing by plotting the point We know that the slope is the change in the y-coordinate over the change in the x-coordinate. This is commonly referred to as rise over run, From our example, we have which means that the rise is 1 and the run is 2. So starting from our y-intercept we can rise 1 and then run 2, or run 2 and then rise 1. We repeat until we have a few points, and then we draw a line through the points as shown in Figure 12.
傾きは である。傾きが正なので、グラフは左から右へ上がると分かる。y切片は のときのグラフ上の点である。グラフは で y軸と交わる。これで傾きと y切片が分かった。点 を打つところからグラフを描き始められる。傾きは x座標の変化に対する y座標の変化だと分かっている。これはふつう「上がりを進みで割ったもの」、すなわち と呼ばれる。この例では なので、上がりが1、進みが2である。よって y切片 から、1上がって2進むか、2進んで1上がればよい。点がいくつか得られるまでこれを繰り返し、そのうえで図12のようにその点を通る直線を引く。
Graphical Interpretation of a Linear Function 一次関数のグラフの意味
In the equation
方程式 において、
• is the y-intercept of the graph and indicates the point at which the graph crosses the y-axis.• is the slope of the line and indicates the vertical displacement (rise) and horizontal displacement (run) between each successive pair of points. Recall the formula for the slope:
・ はグラフの y切片であり、グラフが y軸と交わる点 を示す。・ は直線の傾きであり、続けて並ぶ点どうしのあいだの縦のずれ(上がり)と横のずれ(進み)を示す。傾きの公式を思い出そう。
Q&A 疑問と答え
Do all linear functions have y-intercepts?
一次関数にはすべて y切片があるか。
Yes. All linear functions cross the y-axis and therefore have y-intercepts. (Note: A vertical line is parallel to the y-axis does not have a y-intercept, but it is not a function.)
ある。一次関数はどれも y軸と交わるので、y切片を持つ。(注意: y軸に平行な縦の直線には y切片が無いが、これは関数ではない。)
How To 手順
Given the equation for a linear function, graph the function using the y-intercept and slope.
一次関数の方程式が与えられたとき、y切片と傾きを使ってその関数のグラフを描く。
1. Evaluate the function at an input value of zero to find the y-intercept.2. Identify the slope as the rate of change of the input value.3. Plot the point represented by the y-intercept.4. Use to determine at least two more points on the line.5. Sketch the line that passes through the points.
1. 入力値0での関数の値を求めて y切片を出す。2. 入力値に対する変化の割合として傾きを読み取る。3. y切片が表す点を打つ。4. を使って、直線上の点をさらに二つ以上決める。5. その点を通る直線の概形を描く。
Example 12例12
Graphing by Using the y-intercept and Slopey切片と傾きを使ってグラフを描く
Graph using the y-intercept and slope.
y切片と傾きを使って のグラフを描け。
Solution 解答
Evaluate the function at to find the y-intercept. The output value when is 5, so the graph will cross the y-axis at
での関数の値を求めて y切片を出す。 のときの出力値は5なので、グラフは で y軸と交わる。
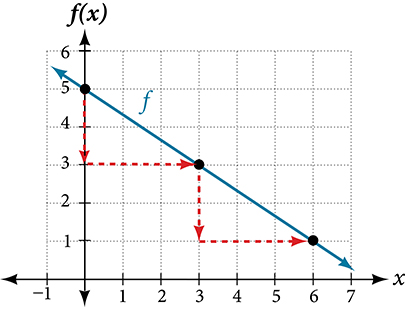
According to the equation for the function, the slope of the line is This tells us that for each vertical decrease in the “rise” of units, the “run” increases by 3 units in the horizontal direction. We can now graph the function by first plotting the y-intercept on the graph in Figure 13. From the initial value we move down 2 units and to the right 3 units. We can extend the line to the left and right by repeating, and then drawing a line through the points.
この関数の方程式によれば、直線の傾きは である。これは、「上がり」が縦に 減るごとに、「進み」が横の向きに3増えることを教えてくれる。図13のグラフに、まず y切片を打つところからこの関数のグラフを描ける。初めの値 から、下へ2、右へ3だけ動く。これを繰り返して左右へ伸ばし、そのうえで点を通る直線を引ける。
Analysis 考察
The graph slants downward from left to right, which means it has a negative slope as expected.
グラフは左から右へ下がっており、見込みどおり傾きが負であることを意味する。
Try It #6やってみよう6
Find a point on the graph we drew in Example 12 that has a negative x-value.
例12で描いたグラフの上で、x の値が負である点を一つ求めよ。
Graphing a Function Using Transformations変形を使って関数のグラフを描く
Another option for graphing is to use a transformation of the identity function A function may be transformed by a shift up, down, left, or right. A function may also be transformed using a reflection, stretch, or compression.
グラフを描くもう一つの手が、恒等関数 の変形を使うことである。関数は上下左右への平行移動で変形できる。対称移動・拡大・縮小でも変形できる。
Vertical Stretch or Compression縦の拡大と縮小
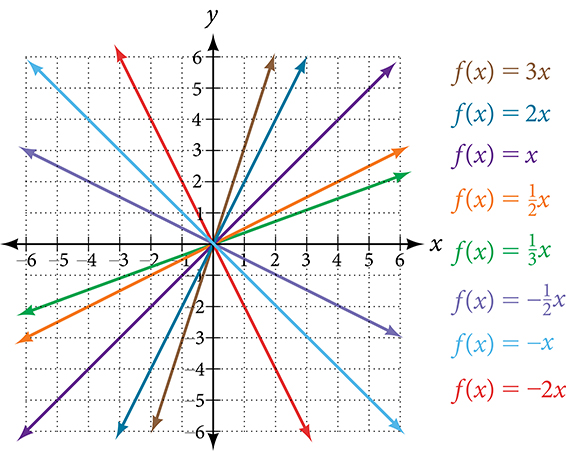
In the equation the is acting as the vertical stretch or compression of the identity function. When is negative, there is also a vertical reflection of the graph. Notice in Figure 14 that multiplying the equation of by stretches the graph of by a factor of units if and compresses the graph of by a factor of units if This means the larger the absolute value of the steeper the slope.
方程式 では、 が恒等関数の縦の拡大または縮小としてはたらく。 が負のときは、グラフの縦の対称移動も起きる。図14では、 の方程式に を掛けると、 なら のグラフが 倍に伸び、 なら のグラフが 倍に縮むことに注意せよ。つまり の絶対値が大きいほど傾きは急になる。
Vertical Shift縦の平行移動
In the acts as the vertical shift, moving the graph up and down without affecting the slope of the line. Notice in Figure 15 that adding a value of to the equation of shifts the graph of a total of units up if is positive and units down if is negative.
では、 が縦の平行移動としてはたらき、直線の傾きを変えずにグラフを上下に動かす。図15では、 の方程式に値 を足すと、 が正なら のグラフが だけ上へ、 が負なら だけ下へ動くことに注意せよ。
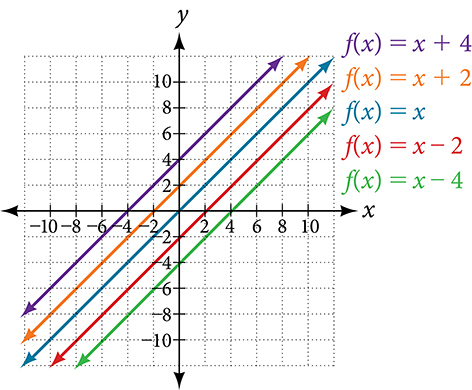
Using vertical stretches or compressions along with vertical shifts is another way to look at identifying different types of linear functions. Although this may not be the easiest way to graph this type of function, it is still important to practice each method.
縦の拡大・縮小と縦の平行移動を使うのも、いろいろな型の一次関数を見分ける一つの見方である。この型の関数のグラフを描くのにいちばん楽な方法ではないかもしれないが、どの方法も練習しておくことが大切である。
How To 手順
Given the equation of a linear function, use transformations to graph the linear function in the form
一次関数の方程式が与えられたとき、変形を使って の形の一次関数のグラフを描く。
1. Graph 2. Vertically stretch or compress the graph by a factor 3. Shift the graph up or down units.
1. のグラフを描く。2. グラフを 倍に縦に伸ばす、または縮める。3. グラフを上下に だけ動かす。
Example 13例13
Graphing by Using Transformations変形を使ってグラフを描く
Graph using transformations.
変形を使って のグラフを描け。
Solution 解答
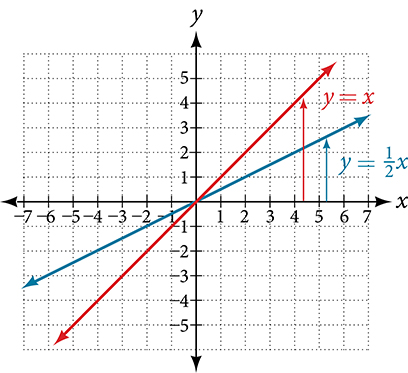
The equation for the function shows that so the identity function is vertically compressed by The equation for the function also shows that so the identity function is vertically shifted down 3 units. First, graph the identity function, and show the vertical compression as in Figure 16.
この関数の方程式から が分かるので、恒等関数は縦に 倍に縮む。また方程式から も分かるので、恒等関数は縦に下へ3だけ動く。まず恒等関数のグラフを描き、図16のように縦の縮小を示す。
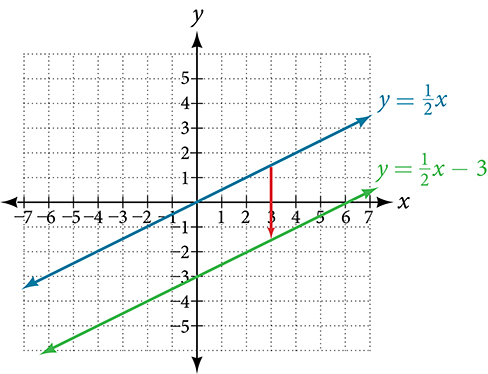
Then show the vertical shift as in Figure 17.
そのうえで図17のように縦の平行移動を示す。
Try It #7やってみよう7
Graph using transformations.
変形を使って のグラフを描け。
Q&A 疑問と答え
In Example 15, could we have sketched the graph by reversing the order of the transformations?
例15で、変形の順序を逆にしてもグラフの概形を描けただろうか。
No. The order of the transformations follows the order of operations. When the function is evaluated at a given input, the corresponding output is calculated by following the order of operations. This is why we performed the compression first. For example, following the order: Let the input be 2.
描けない。変形の順序は演算の順序に従う。ある入力での関数の値を求めるとき、対応する出力は演算の順序に従って計算される。だから先に縮小を行った。たとえば、この順に従って入力を2としてみよ。