第4章一次関数Linear Functions
4.3 Fitting Linear Models to Data4.3 データへの一次モデルの当てはめ
Learning Objectives 学習目標
In this section, you will:
この節を終えると、次のことができるようになる。
• Draw and interpret scatter diagrams.• Use a graphing utility to find the line of best fit.• Distinguish between linear and nonlinear relations.• Fit a regression line to a set of data and use the linear model to make predictions.
・散布図を描き、読み取る。・グラフ作成ツールで最もよく当てはまる直線を求める。・一次の関係と一次でない関係を見分ける。・一組の資料に回帰直線を当てはめ、その一次のモデルで予測する。
A professor is attempting to identify trends among final exam scores. His class has a mixture of students, so he wonders if there is any relationship between age and final exam scores. One way for him to analyze the scores is by creating a diagram that relates the age of each student to the exam score received. In this section, we will examine one such diagram known as a scatter plot.
ある教授が期末試験の点数の傾向を見つけようとしている。彼の講義にはいろいろな学生がいるので、年齢と期末試験の点数のあいだに何か関係があるだろうかと考えている。点数を調べる一つの方法は、各学生の年齢と得た点数を結びつける図を作ることである。この節では、散布図と呼ばれるそうした図の一つを調べる。
Drawing and Interpreting Scatter Plots散布図を描き、読み取る
A scatter plot is a graph of plotted points that may show a relationship between two sets of data. If the relationship is from a linear model, or a model that is nearly linear, the professor can draw conclusions using his knowledge of linear functions. Figure 1 shows a sample scatter plot.
散布図とは、二組の資料のあいだの関係を示しうる点を打ったグラフである。その関係が一次のモデル、あるいはほぼ一次のモデルによるものなら、教授は一次関数の知識を使って結論を導ける。図1に散布図の例を示す。
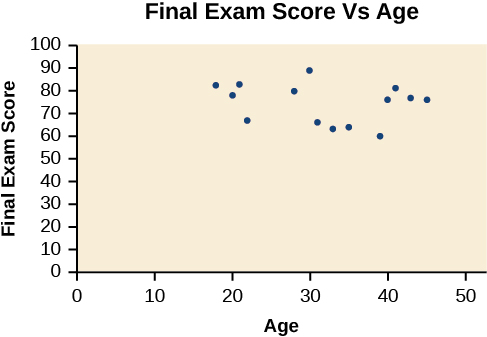
Notice this scatter plot does not indicate a linear relationship. The points do not appear to follow a trend. In other words, there does not appear to be a relationship between the age of the student and the score on the final exam.
この散布図は一次の関係を示していないことに注意せよ。点は傾向をなしていないように見える。言い換えると、学生の年齢と期末試験の点数のあいだに関係は無さそうである。
Example 1例1
Using a Scatter Plot to Investigate Cricket Chirps散布図でコオロギの鳴き声を調べる
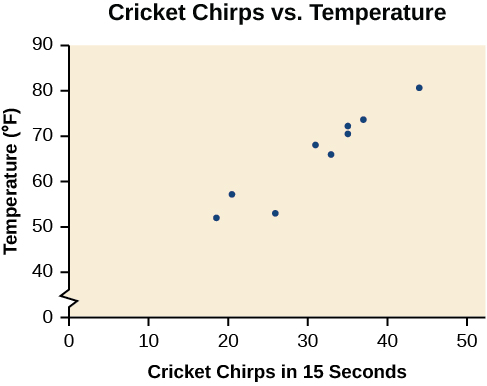
The table below shows the number of cricket chirps in 15 seconds, for several different air temperatures, in degrees Fahrenheit5. Plot this data, and determine whether the data appears to be linearly related.
下の表は、いくつかの気温(華氏)について、15秒間のコオロギの鳴き声の回数を示す。この資料の点を打ち、一次の関係がありそうかどうかを判定せよ。
Selected data from
次の資料からデータを抜粋した。
. Retrieved Aug 3, 2010
参照日:2010年8月3日。
| Chirps鳴き声の回数 | 44 | 35 | 20.4 | 33 | 31 | 35 | 18.5 | 37 | 26 |
| Temperature気温 | 80.5 | 70.5 | 57 | 66 | 68 | 72 | 52 | 73.5 | 53 |
Solution 解答
Plotting this data, as depicted in Figure 2 suggests that there may be a trend. We can see from the trend in the data that the number of chirps increases as the temperature increases. The trend appears to be roughly linear, though certainly not perfectly so.
図2のようにこの資料の点を打つと、傾向がありそうに見える。資料の傾向から、気温が上がるにつれて鳴き声の回数が増えることが分かる。傾向はおおむね一次に見えるが、完全にそうというわけではない。
Finding the Line of Best Fit最もよく当てはまる直線を求める
Once we recognize a need for a linear function to model that data, the natural follow-up question is “what is that linear function?” One way to approximate our linear function is to sketch the line that seems to best fit the data. Then we can extend the line until we can verify the y-intercept. We can approximate the slope of the line by extending it until we can estimate the
資料を表すのに一次関数が要ると分かれば、次に出てくる当然の問いは「その一次関数は何か」である。一次関数を近似する一つの方法は、資料にいちばんよく当てはまりそうな直線を引いてみることである。そのうえで、y切片が確かめられるところまでその直線を伸ばせばよい。 を見積もれるところまで伸ばせば、直線の傾きも近似できる。
Example 2例2
Finding a Line of Best Fit最もよく当てはまる直線を求める
Find a linear function that fits the data in Table 1 by “eyeballing” a line that seems to fit.
当てはまりそうな直線を「目分量で」引いて、表1の資料に当てはまる一次関数を求めよ。
Solution 解答
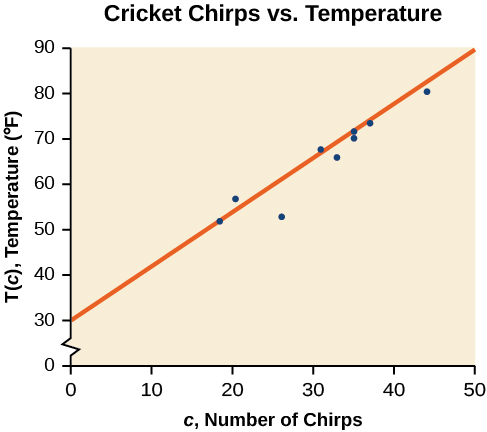
On a graph, we could try sketching a line. Using the starting and ending points of our hand drawn line, points (0, 30) and (50, 90), this graph has a slope of
グラフの上で直線を引いてみられる。手で引いた直線の始点と終点、点 (0, 30) と (50, 90) を使うと、このグラフの傾きは次のようになる。
and a y-intercept at 30. This gives an equation of
そして y切片は30である。よって方程式は次のようになる。
where is the number of chirps in 15 seconds, and is the temperature in degrees Fahrenheit. The resulting equation is represented in Figure 3.
ここで は15秒間の鳴き声の回数、 は華氏の気温である。できた方程式を図3に示す。
Analysis 考察
This linear equation can then be used to approximate answers to various questions we might ask about the trend.
この一次方程式を使えば、傾向について尋ねたいさまざまな問いの答えを近似できる。
Recognizing Interpolation or Extrapolation内挿と外挿を見分ける
While the data for most examples does not fall perfectly on the line, the equation is our best guess as to how the relationship will behave outside of the values for which we have data. We use a process known as interpolation when we predict a value inside the domain and range of the data. The process of extrapolation is used when we predict a value outside the domain and range of the data.
たいていの例では資料は直線にぴったり乗らないが、この方程式は、資料のある範囲の外で関係がどうふるまうかについての最良の見当である。資料の定義域と値域の内側で値を予測することを内挿という。資料の定義域と値域の外で値を予測することを外挿という。
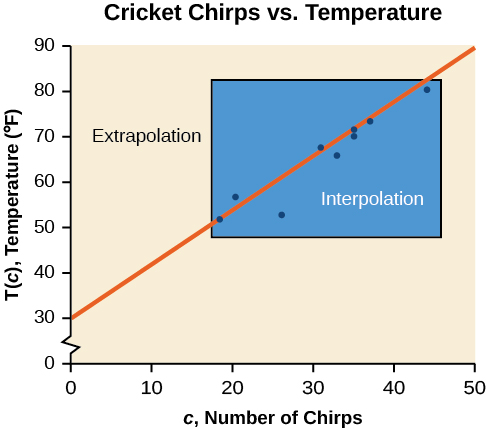
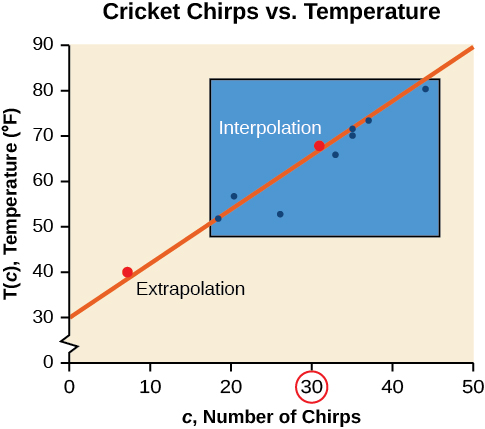
Figure 4 compares the two processes for the cricket-chirp data addressed in Example 2. We can see that interpolation would occur if we used our model to predict temperature when the values for chirps are between 18.5 and 44. Extrapolation would occur if we used our model to predict temperature when the values for chirps are less than 18.5 or greater than 44.
図4に、例2で扱ったコオロギの鳴き声の資料について、この二つの手続きを並べて示す。鳴き声の回数が18.5から44のあいだのときに気温を予測するなら内挿になる。鳴き声の回数が18.5未満または44より多いときに気温を予測するなら外挿になる。
There is a difference between making predictions inside the domain and range of values for which we have data and outside that domain and range. Predicting a value outside of the domain and range has its limitations. When our model no longer applies after a certain point, it is sometimes called model breakdown. For example, predicting a cost function for a period of two years may involve examining the data where the input is the time in years and the output is the cost. But if we try to extrapolate a cost when that is in 50 years, the model would not apply because we could not account for factors fifty years in the future.
資料のある値の定義域と値域の内側で予測することと、その外で予測することは違う。定義域と値域の外での予測には限界がある。ある点より先でモデルが通用しなくなることを、モデルの破綻ということがある。たとえば2年間の費用の関数を予測するなら、入力を年、出力を費用とする資料を調べることになるだろう。しかし すなわち50年後の費用を外挿しようとしても、50年先の要因を勘定に入れられないので、このモデルは通用しない。
Interpolation and Extrapolation 内挿と外挿
Different methods of making predictions are used to analyze data.
資料を調べるには、いろいろな予測の方法が使われる。
The method of interpolation involves predicting a value inside the domain and/or range of the data.
The method of extrapolation involves predicting a value outside the domain and/or range of the data.
Model breakdown occurs at the point when the model no longer applies.
内挿の方法は、資料の定義域や値域の内側で値を予測する。外挿の方法は、資料の定義域や値域の外で値を予測する。モデルの破綻は、そのモデルが通用しなくなった時点で起こる。
Example 3例3
Understanding Interpolation and Extrapolation内挿と外挿を理解する
Use the cricket data from Table 1 to answer the following questions:
表1のコオロギの資料を使って、次の問いに答えよ。
ⓐWould predicting the temperature when crickets are chirping 30 times in 15 seconds be interpolation or extrapolation? Make the prediction, and discuss whether it is reasonable.ⓑWould predicting the number of chirps crickets will make at 40 degrees be interpolation or extrapolation? Make the prediction, and discuss whether it is reasonable.
ⓐ15秒間に30回鳴いているときの気温を予測するのは、内挿か外挿か。予測を行い、それが理にかなっているかを論ぜよ。ⓑ40度のときにコオロギが何回鳴くかを予測するのは、内挿か外挿か。予測を行い、それが理にかなっているかを論ぜよ。
Solution 解答
ⓐThe number of chirps in the data provided varied from 18.5 to 44. A prediction at 30 chirps per 15 seconds is inside the domain of our data, so would be interpolation. Using our model:Based on the data we have, this value seems reasonable.ⓑThe temperature values varied from 52 to 80.5. Predicting the number of chirps at 40 degrees is extrapolation because 40 is outside the range of our data. Using our model:
ⓐ与えられた資料の鳴き声の回数は18.5から44までである。15秒あたり30回での予測は資料の定義域の内側なので、内挿になる。このモデルを使うと、手元の資料からすると、この値は理にかなっているように見える。ⓑ気温の値は52から80.5までである。40は資料の範囲の外なので、40度での鳴き声の回数の予測は外挿である。このモデルを使うと、
We can compare the regions of interpolation and extrapolation using Figure 5.
図5を使って、内挿と外挿の範囲を見比べられる。
Analysis 考察
Our model predicts the crickets would chirp 8.33 times in 15 seconds. While this might be possible, we have no reason to believe our model is valid outside the domain and range. In fact, generally crickets stop chirping altogether below around 50 degrees.
このモデルは、コオロギが15秒間に8.33回鳴くと予測する。ありうるかもしれないが、資料の定義域と値域の外でこのモデルが通用すると信じる理由は無い。実際、コオロギはおよそ50度を下回るとまったく鳴かなくなるのがふつうである。
Try It #1やってみよう1
According to the data from Table 1, what temperature can we predict it is if we counted 20 chirps in 15 seconds?
表1の資料によれば、15秒間に20回鳴いていたとき、気温はいくらと予測できるか。
Finding the Line of Best Fit Using a Graphing Utilityグラフ作成ツールで最もよく当てはまる直線を求める
While eyeballing a line works reasonably well, there are statistical techniques for fitting a line to data that minimize the differences between the line and data values6. One such technique is called least squares regression and can be computed by many graphing calculators, spreadsheet software, statistical software, and many web-based calculators7. Least squares regression is one means to determine the line that best fits the data, and here we will refer to this method as linear regression.
目分量で直線を引く方法もそれなりにうまくいくが、直線と資料の値との差を最小にするように直線を当てはめる統計の手法がある。その一つが最小二乗回帰で、多くのグラフ電卓・表計算ソフト・統計ソフト、そして多くのウェブ上の計算機で計算できる。最小二乗回帰は資料に最もよく当てはまる直線を決める手立ての一つであり、ここではこの方法を線形回帰と呼ぶ。
Technically, the method minimizes the sum of the squared differences in the vertical direction between the line and the data values.
厳密には、各データ点から直線までの鉛直方向の差を二乗し、その総和が最小になる直線を求める方法である。
For example,
たとえば、
How To 手順
Given data of input and corresponding outputs from a linear function, find the best fit line using linear regression.
一次関数の入力と対応する出力の資料が与えられたとき、線形回帰で最もよく当てはまる直線を求める。
1. Enter the input in List 1 (L1).2. Enter the output in List 2 (L2).3. On a graphing utility, select Linear Regression (LinReg).
1. 入力を List 1(L1)に入れる。2. 出力を List 2(L2)に入れる。3. グラフ作成ツールで Linear Regression(LinReg)を選ぶ。
Example 4例4
Finding a Least Squares Regression Line最小二乗回帰の直線を求める
Find the least squares regression line using the cricket-chirp data in Table 2.
表2のコオロギの鳴き声の資料を使って、最小二乗回帰の直線を求めよ。
Solution 解答
1. Enter the input (chirps) in List 1 (L1).2. Enter the output (temperature) in List 2 (L2). See Table 2. L1 44 35 20.4 33 31 35 18.5 37 26 L2 80.5 70.5 57 66 68 72 52 73.5 53 Table 23. On a graphing utility, select Linear Regression (LinReg). Using the cricket chirp data from earlier, with technology we obtain the equation:
1. 入力(鳴き声の回数)を List 1(L1)に入れる。2. 出力(気温)を List 2(L2)に入れる。表2を見よ。L1 44 35 20.4 33 31 35 18.5 37 26 L2 80.5 70.5 57 66 68 72 52 73.5 53 表23. グラフ作成ツールで Linear Regression(LinReg)を選ぶ。先ほどのコオロギの鳴き声の資料に機器を使うと、次の方程式が得られる。
Analysis 考察
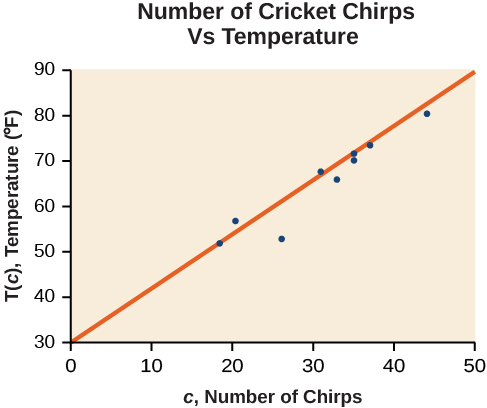
Notice that this line is quite similar to the equation we “eyeballed” but should fit the data better. Notice also that using this equation would change our prediction for the temperature when hearing 30 chirps in 15 seconds from 66 degrees to:
この直線が「目分量で」引いた方程式とかなり近いが、資料により合っているはずであることに注意せよ。またこの方程式を使うと、15秒間に30回鳴くのを聞いたときの気温の予測が、66度から次の値に変わることにも注意せよ。
The graph of the scatter plot with the least squares regression line is shown in Figure 6.
最小二乗回帰の直線を重ねた散布図を図6に示す。
Q&A 疑問と答え
Will there ever be a case where two different lines will serve as the best fit for the data?
二本の違う直線が、どちらも資料に最もよく当てはまる直線になることはあるか。
No. There is only one best fit line.
無い。最もよく当てはまる直線は一本だけである。
Distinguishing Between Linear and Nonlinear Models一次のモデルと一次でないモデルを見分ける
As we saw above with the cricket-chirp model, some data exhibit strong linear trends, but other data, like the final exam scores plotted by age, are clearly nonlinear. Most calculators and computer software can also provide us with the correlation coefficient, which is a measure of how closely the line fits the data. Many graphing calculators require the user to turn a "diagnostic on" selection to find the correlation coefficient, which mathematicians label as The correlation coefficient provides an easy way to get an idea of how close to a line the data falls.
上のコオロギの鳴き声のモデルで見たように、強い一次の傾向を示す資料もあれば、年齢に対して打った期末試験の点数のように、明らかに一次でない資料もある。たいていの電卓と計算機のソフトは相関係数も出してくれる。相関係数は、直線が資料にどれだけよく当てはまっているかを測るものである。多くのグラフ電卓では、相関係数を出すのに「diagnostic on」を選ぶ必要がある。数学ではこれを と書く。相関係数を見れば、資料が直線にどれだけ近いかをすぐにつかめる。
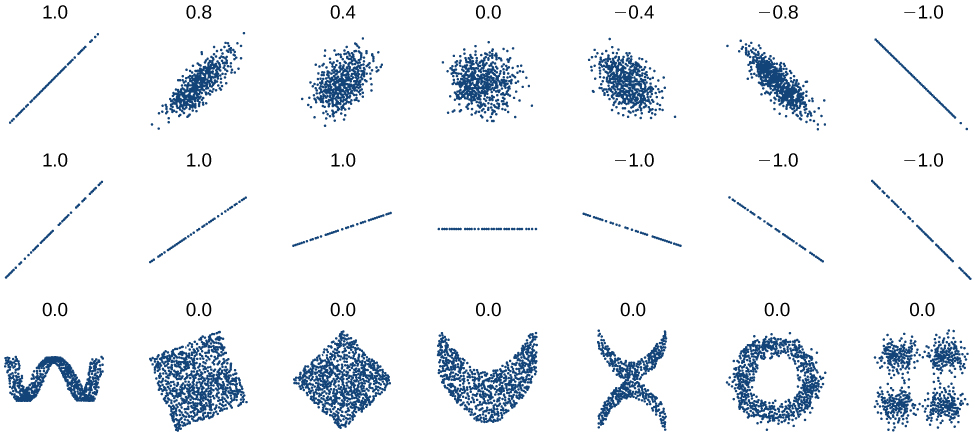
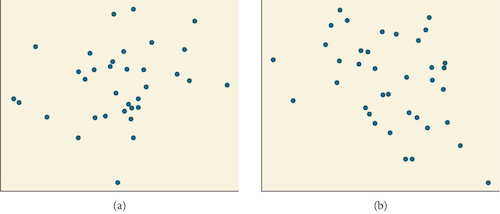
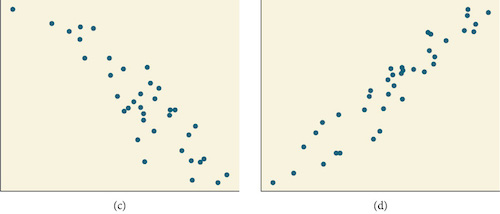
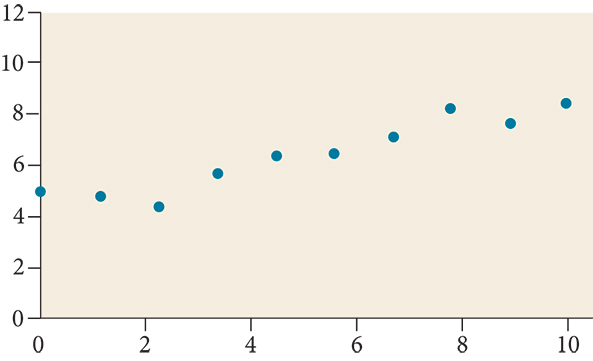
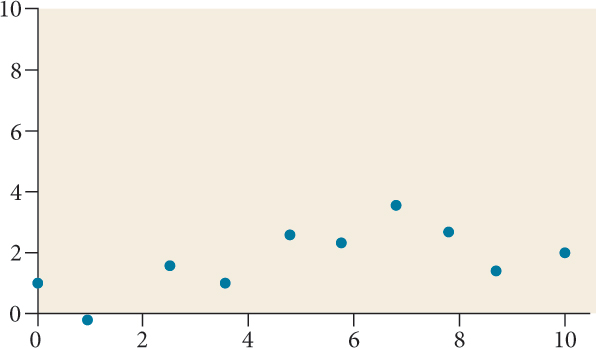
We should compute the correlation coefficient only for data that follows a linear pattern or to determine the degree to which a data set is linear. If the data exhibits a nonlinear pattern, the correlation coefficient for a linear regression is meaningless. To get a sense for the relationship between the value of and the graph of the data, Figure 7 shows some large data sets with their correlation coefficients. Remember, for all plots, the horizontal axis shows the input and the vertical axis shows the output.
相関係数を計算すべきなのは、一次の型に従う資料についてか、資料がどれだけ一次に近いかを判定するときだけである。資料が一次でない型を示すなら、線形回帰の相関係数は意味を持たない。 の値と資料のグラフの関係をつかむために、図7に大きな資料の組とその相関係数をいくつか示す。どの図でも、横の軸が入力、縦の軸が出力を示すことを覚えておこう。
Correlation Coefficient 相関係数
The correlation coefficient is a value, between –1 and 1.
相関係数は、–1 と 1 のあいだの値 である。
• suggests a positive (increasing) relationship• suggests a negative (decreasing) relationship• The closer the value is to 0, the more scattered the data.• The closer the value is to 1 or –1, the less scattered the data is.
・ は正の(増加する)関係を示す。・ は負の(減少する)関係を示す。・値が0に近いほど、資料は散らばっている。・値が1または–1に近いほど、資料の散らばりは小さい。
Example 5例5
Finding a Correlation Coefficient相関係数を求める
Calculate the correlation coefficient for cricket-chirp data in Table 1.
表1のコオロギの鳴き声の資料について、相関係数を計算せよ。
Solution 解答
Because the data appear to follow a linear pattern, we can use technology to calculate Enter the inputs and corresponding outputs and select the Linear Regression. The calculator will also provide you with the correlation coefficient, This value is very close to 1, which suggests a strong increasing linear relationship.
資料は一次の型に従っているように見えるので、機器を使って を計算できる。入力と対応する出力を入れて Linear Regression を選ぶ。電卓は相関係数 も出してくれる。この値は1にきわめて近く、強い増加の一次の関係を示している。
Note: For some calculators, the Diagnostics must be turned "on" in order to get the correlation coefficient when linear regression is performed: [2nd]>[0]>[alpha][x–1], then scroll to DIAGNOSTICSON.
注意: 電卓によっては、線形回帰のときに相関係数を出すために Diagnostics を「on」にしなければならない。[2nd]>[0]>[alpha][x–1] と押し、DIAGNOSTICSON まで進む。
Fitting a Regression Line to a Set of Data一組の資料に回帰直線を当てはめる
Once we determine that a set of data is linear using the correlation coefficient, we can use the regression line to make predictions. As we learned above, a regression line is a line that is closest to the data in the scatter plot, which means that only one such line is a best fit for the data.
相関係数で一組の資料が一次だと判定できたら、回帰直線を使って予測できる。上で学んだとおり、回帰直線とは散布図の資料にもっとも近い直線であり、資料に最もよく当てはまる直線は一本だけである。
Example 6例6
Using a Regression Line to Make Predictions回帰直線を使って予測する
Gasoline consumption in the United States has been steadily increasing. Consumption data from 1994 to 2004 is shown in Table 3.8 Determine whether the trend is linear, and if so, find a model for the data. Use the model to predict the consumption in 2008.
合衆国のガソリンの消費量は着実に増えてきた。1994年から2004年までの消費量の資料を表3に示す。この傾向が一次かどうかを判定し、一次ならこの資料を表すモデルを求めよ。そのモデルを使って2008年の消費量を予測せよ。
| Year年 | '94 | '95 | '96 | '97 | '98 | '99 | '00 | '01 | '02 | '03 | '04 |
| Consumption (billions of gallons)消費量(十億ガロン) | 113 | 116 | 118 | 119 | 123 | 125 | 126 | 128 | 131 | 133 | 136 |
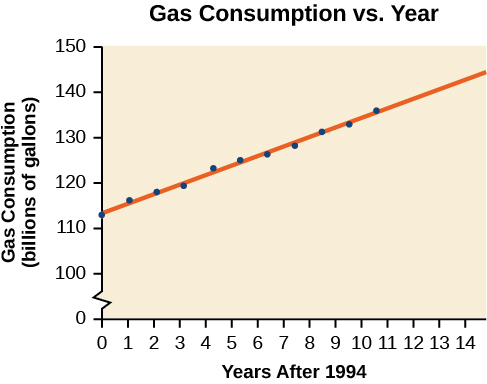
The scatter plot of the data, including the least squares regression line, is shown in Figure 8.
最小二乗回帰の直線を重ねた、この資料の散布図を図8に示す。
Solution 解答
We can introduce a new input variable, representing years since 1994.
1994年からの年数を表す新しい入力の変数 を導ける。
The least squares regression equation is:
最小二乗回帰の方程式は次のとおりである。
Using technology, the correlation coefficient was calculated to be 0.9965, suggesting a very strong increasing linear trend.
機器を使うと相関係数は0.9965と計算され、きわめて強い増加の一次の傾向を示している。
Using this to predict consumption in 2008
これを使って2008年()の消費量を予測する。
The model predicts 144.244 billion gallons of gasoline consumption in 2008.
このモデルは、2008年のガソリン消費量を1,442.44億ガロンと予測する。
Try It #2やってみよう2
Use the model we created using technology in Example 6 to predict the gas consumption in 2011. Is this an interpolation or an extrapolation?
例6で機器を使って作ったモデルを使い、2011年のガソリン消費量を予測せよ。これは内挿か外挿か。
Media 教材
Access these online resources for additional instruction and practice with fitting linear models to data.
資料への一次のモデルの当てはめについての説明と練習をさらに求めるなら、次のオンライン教材にあたるとよい。
• Introduction to Regression Analysis• Linear Regression
・回帰分析のはじめに・線形回帰
Verbal言葉で答える問題
2. What is interpolation when using a linear model?
2. 一次のモデルを使うときの内挿とは何か。
4. Explain the difference between a positive and a negative correlation coefficient.
4. 相関係数が正の場合と負の場合の違いを説明せよ。
Algebraic代数の問題
6. A regression was run to determine whether there is a relationship between hours of TV watched per day and number of sit-ups a person can do The results of the regression are given below. Use this to predict the number of sit-ups a person who watches 11 hours of TV can do.
6. 1日にテレビを見る時間 と、その人ができる腹筋の回数 のあいだに関係があるかを調べるため、回帰を行った。その結果を下に示す。これを使って、1日に11時間テレビを見る人ができる腹筋の回数を予測せよ。
7. A regression was run to determine whether there is a relationship between the diameter of a tree ( , in inches) and the tree’s age ( , in years). The results of the regression are given below. Use this to predict the age of a tree with diameter 10 inches.
7. 木の直径(、インチ)と木の樹齢(、年)のあいだに関係があるかを調べるため、回帰を行った。その結果を下に示す。これを使って、直径10インチの木の樹齢を予測せよ。
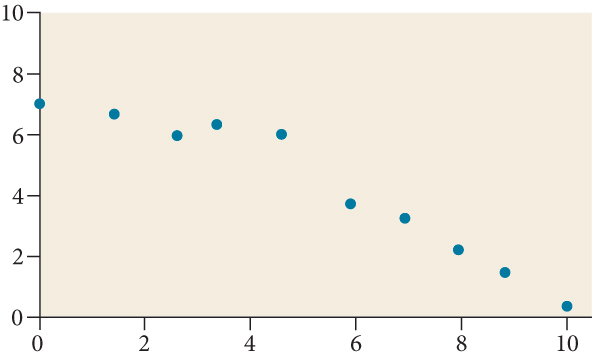
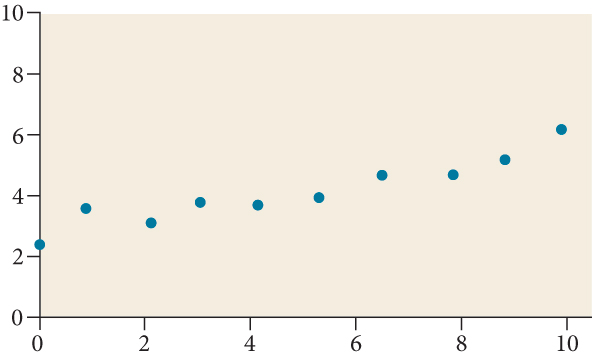
For the following exercises, draw a scatter plot for the data provided. Does the data appear to be linearly related?
次の各問について、与えられた資料の散布図を描け。資料に一次の関係がありそうか。
| 0 | 2 | 4 | 6 | 8 | 10 |
| –22 | –19 | –15 | –11 | –6 | –2 |
| 1 | 2 | 3 | 4 | 5 | 6 |
| 46 | 50 | 59 | 75 | 100 | 136 |
| 100 | 250 | 300 | 450 | 600 | 750 |
| 12 | 12.6 | 13.1 | 14 | 14.5 | 15.2 |
| 1 | 3 | 5 | 7 | 9 | 11 |
| 1 | 9 | 28 | 65 | 125 | 216 |
12. For the following data, draw a scatter plot. If we wanted to know when the population would reach 15,000, would the answer involve interpolation or extrapolation? Eyeball the line, and estimate the answer.
12. 次の資料について散布図を描け。人口が15,000人に達する時期を知りたいとき、その答えは内挿によるか外挿によるか。直線を目分量で引き、答えを見積もれ。
| Year年 | Population人口 |
|---|---|
| 1990 | 11,500 |
| 1995 | 12,100 |
| 2000 | 12,700 |
| 2005 | 13,000 |
| 2010 | 13,750 |
13. For the following data, draw a scatter plot. If we wanted to know when the temperature would reach 28°F, would the answer involve interpolation or extrapolation? Eyeball the line and estimate the answer.
13. 次の資料について散布図を描け。気温が28°F に達する時期を知りたいとき、その答えは内挿によるか外挿によるか。直線を目分量で引き、答えを見積もれ。
| Temperature,°F気温(°F) | 16 | 18 | 20 | 25 | 30 |
| Time, seconds時間(秒) | 46 | 50 | 54 | 55 | 62 |
Graphicalグラフの問題
Numeric数値の問題
22. The U.S. Census tracks the percentage of persons 25 years or older who are college graduates. That data for several years is given in Table 4.9 Determine whether the trend appears linear. If so, and assuming the trend continues, in what year will the percentage exceed 35%?
22. 合衆国の国勢調査は、25歳以上で大学を出た人の割合を追っている。何年か分の資料を表4に示す。傾向が一次に見えるかを判定せよ。一次に見え、その傾向が続くとすると、この割合が35%を超えるのは何年か。
Based on data from
次の資料のデータに基づく。
. Accessed 5/1/2014.
閲覧日:2014年5月1日。
| Year年 | Percent Graduates卒業者の割合 |
|---|---|
| 1990 | 21.3 |
| 1992 | 21.4 |
| 1994 | 22.2 |
| 1996 | 23.6 |
| 1998 | 24.4 |
| 2000 | 25.6 |
| 2002 | 26.7 |
| 2004 | 27.7 |
| 2006 | 28 |
| 2008 | 29.4 |
23. The U.S. import of wine (in hectoliters) for several years is given in Table 5. Determine whether the trend appears linear. If so, and assuming the trend continues, in what year will imports exceed 12,000 hectoliters?
23. 合衆国のぶどう酒の輸入量(ヘクトリットル)を何年か分、表5に示す。傾向が一次に見えるかを判定せよ。一次に見え、その傾向が続くとすると、輸入量が12,000ヘクトリットルを超えるのは何年か。
| Year年 | Imports輸入量 |
|---|---|
| 1992 | 2665 |
| 1994 | 2688 |
| 1996 | 3565 |
| 1998 | 4129 |
| 2000 | 4584 |
| 2002 | 5655 |
| 2004 | 6549 |
| 2006 | 7950 |
| 2008 | 8487 |
| 2009 | 9462 |
24. Table 6 shows the year and the number of people unemployed in a particular city for several years. Determine whether the trend appears linear. If so, and assuming the trend continues, in what year will the number of unemployed reach 5?
24. 表6に、ある都市の年と失業者の数を何年か分示す。傾向が一次に見えるかを判定せよ。一次に見え、その傾向が続くとすると、失業者の数が5人になるのは何年か。
| Year年 | Number Unemployed失業者の数 |
|---|---|
| 1990 | 750 |
| 1992 | 670 |
| 1994 | 650 |
| 1996 | 605 |
| 1998 | 550 |
| 2000 | 510 |
| 2002 | 460 |
| 2004 | 420 |
| 2006 | 380 |
| 2008 | 320 |
Technology機器を使う問題
For the following exercises, use each set of data to calculate the regression line using a calculator or other technology tool, and determine the correlation coefficient to 3 decimal places of accuracy.
次の各問について、電卓またはその他の機器を使って各資料の組から回帰直線を計算し、相関係数を小数第三位まで求めよ。
| 8 | 15 | 26 | 31 | 56 | |
| 23 | 41 | 53 | 72 | 103 |
| 5 | 7 | 10 | 12 | 15 | |
| 4 | 12 | 17 | 22 | 24 |
| 3 | 21.9 | 10 | 18.54 |
| 4 | 22.22 | 11 | 15.76 |
| 5 | 22.74 | 12 | 13.68 |
| 6 | 22.26 | 13 | 14.1 |
| 7 | 20.78 | 14 | 14.02 |
| 8 | 17.6 | 15 | 11.94 |
| 9 | 16.52 | 16 | 12.76 |
| 4 | 44.8 |
| 5 | 43.1 |
| 6 | 38.8 |
| 7 | 39 |
| 8 | 38 |
| 9 | 32.7 |
| 10 | 30.1 |
| 11 | 29.3 |
| 12 | 27 |
| 13 | 25.8 |
| 21 | 25 | 30 | 31 | 40 | 50 | |
| 17 | 11 | 2 | –1 | –18 | –40 |
| 100 | 2000 |
| 80 | 1798 |
| 60 | 1589 |
| 55 | 1580 |
| 40 | 1390 |
| 20 | 1202 |
| 900 | 988 | 1000 | 1010 | 1200 | 1205 | |
| 70 | 80 | 82 | 84 | 105 | 108 |
Extensions発展問題
32. Graph Pick a set of five ordered pairs using inputs and use linear regression to verify that the function is a good fit for the data.
32. のグラフを描け。入力 を使って順序対を五組選び、線形回帰でこの関数が資料によく当てはまることを確かめよ。
For the following exercises, consider this scenario: The profit of a company decreased steadily over a ten-year span. The following ordered pairs shows dollars and the number of units sold in hundreds and the profit in thousands of dollars over the ten-year span, (number of units sold, profit) for specific recorded years:
次の各問は、この場面について考える。ある会社の利益は10年にわたって着実に減った。次の順序対は、その10年のうち記録のある年について、百単位で数えた販売個数と千ドル単位の利益を(販売個数, 利益)の形で示している。
34. Use linear regression to determine a function where the profit in thousands of dollars depends on the number of units sold in hundreds.
34. 線形回帰で関数 を求めよ。ここで千ドル単位の利益は、百単位で数えた販売個数に依る。
36. Find to the nearest tenth and interpret the y-intercept.
36. y切片を小数第一位まで求め、その意味を述べよ。
Real-World Applications応用問題
For the following exercises, consider this scenario: The population of a city increased steadily over a ten-year span. The following ordered pairs shows the population and the year over the ten-year span, (population, year) for specific recorded years:
次の各問は、この場面について考える。ある都市の人口は10年にわたって着実に増えた。次の順序対は、その10年のうち記録のある年について、人口と年を(人口, 年)の形で示している。
38. Predict when the population will hit 8,000.
38. 人口が8,000人に達する時期を予測せよ。
For the following exercises, consider this scenario: The profit of a company increased steadily over a ten-year span. The following ordered pairs show the number of units sold in hundreds and the profit in thousands of dollars over the ten year span, (number of units sold, profit) for specific recorded years:
次の各問は、この場面について考える。ある会社の利益は10年にわたって着実に増えた。次の順序対は、その10年のうち記録のある年について、百単位で数えた販売個数と千ドル単位の利益を(販売個数, 利益)の形で示している。
40. Predict when the profit will exceed one million dollars.
40. 利益が100万ドルを超える時期を予測せよ。
For the following exercises, consider this scenario: The profit of a company decreased steadily over a ten-year span. The following ordered pairs show dollars and the number of units sold in hundreds and the profit in thousands of dollars over the ten-year span (number of units sold, profit) for specific recorded years:
次の各問は、この場面について考える。ある会社の利益は10年にわたって着実に減った。次の順序対は、その10年のうち記録のある年について、百単位で数えた販売個数と千ドル単位の利益を(販売個数, 利益)の形で示している。
42. Predict when the profit will dip below the $25,000 threshold.
42. 利益が25,000ドルの境を下回る時期を予測せよ。