第4章一次関数Linear Functions
4.2 Modeling with Linear Functions4.2 一次関数で表す
Learning Objectives 学習目標
In this section, you will:
この節を終えると、次のことができるようになる。
• Build linear models from verbal descriptions.• Model a set of data with a linear function.
・言葉による説明から一次のモデルを組み立てる。・一組の資料を一次関数で表す。
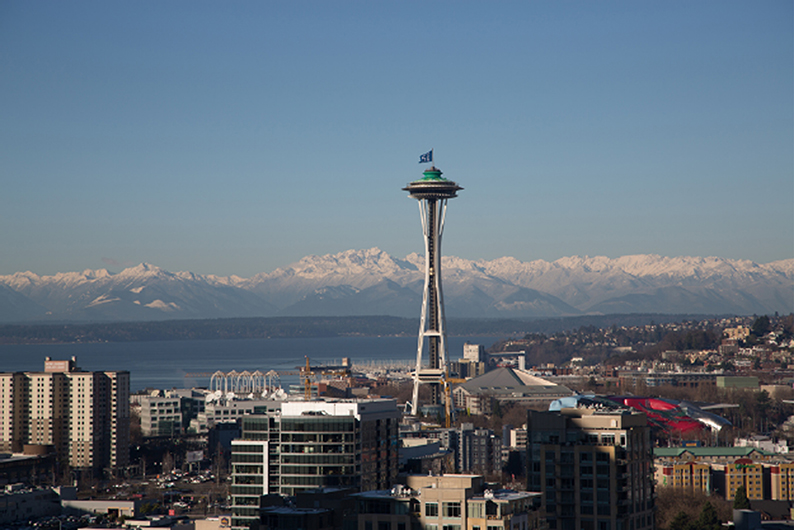
Elan is a college student who plans to spend a summer in Seattle. Elan has saved $3,500 for their trip and anticipates spending $400 each week on rent, food, and activities. How can we write a linear model to represent this situation? What would be the x-intercept, and what can Elan learn from it? To answer these and related questions, we can create a model using a linear function. Models such as this one can be extremely useful for analyzing relationships and making predictions based on those relationships. In this section, we will explore examples of linear function models.
Elan は大学生で、夏をシアトルで過ごすつもりでいる。旅行のために3,500ドルを貯め、家賃・食事・活動に週400ドルを使うと見込んでいる。この場面を表す一次のモデルをどう書けばよいか。x切片は何になり、そこから Elan は何を知れるか。こうした問いに答えるため、一次関数を使ってモデルを作れる。この種のモデルは、関係を調べ、その関係をもとに予測をするのにきわめて役に立つ。この節では、一次関数のモデルの例を調べる。
Building Linear Models from Verbal Descriptions言葉による説明から一次のモデルを組み立てる
When building linear models to solve problems involving quantities with a constant rate of change, we typically follow the same problem strategies that we would use for any type of function. Let’s briefly review them:
変化の割合が一定な量を含む問題を解くために一次のモデルを組み立てるときも、たいていはどんな型の関数でも使う同じ手順に従う。手短に確かめておこう。
1. Identify changing quantities, and then define descriptive variables to represent those quantities. When appropriate, sketch a picture or define a coordinate system.2. Carefully read the problem to identify important information. Look for information that provides values for the variables or values for parts of the functional model, such as slope and initial value.3. Carefully read the problem to determine what we are trying to find, identify, solve, or interpret.4. Identify a solution pathway from the provided information to what we are trying to find. Often this will involve checking and tracking units, building a table, or even finding a formula for the function being used to model the problem.5. When needed, write a formula for the function.6. Solve or evaluate the function using the formula.7. Reflect on whether your answer is reasonable for the given situation and whether it makes sense mathematically.8. Clearly convey your result using appropriate units, and answer in full sentences when necessary.
1. 変わる量を見分け、その量を表す中身を思わせる変数を定める。必要なら絵を描くか、座標系を定める。2. 問題を注意深く読み、大事な情報を見つける。変数の値や、傾きや初めの値といった関数のモデルの一部の値を与える情報を探す。3. 問題を注意深く読み、何を求め、見分け、解き、あるいは読み取ろうとしているのかを決める。4. 与えられた情報から求めたいものへ至る道筋を見つける。多くの場合、単位を確かめて追い、表を作り、あるいは問題を表す関数の式を求めることになる。5. 必要なら、その関数の式を書く。6. その式を使って解くか、値を求める。7. 答えがその場面にとって理にかなっているか、数学として筋が通っているかを振り返る。8. 適切な単位を使って結果をはっきり伝え、必要なら完全な文で答える。
Now let’s take a look at the student in Seattle. In Elan’s situation, there are two changing quantities: time and money. The amount of money they have remaining while on vacation depends on how long they stay. We can use this information to define our variables, including units.
ではシアトルの学生を見てみよう。Elan の場面では、変わる量が二つある。時間と金である。休暇中に残っている金額は、滞在の長さに依る。この情報を使って、単位も含めて変数を定められる。
So, the amount of money remaining depends on the number of weeks: .
よって残っている金額は週数に依る。
Notice that the unit of dollars per week matches the unit of our output variable divided by our input variable. Also, because the slope is negative, the linear function is decreasing. This should make sense because she is spending money each week.
1週あたりのドルという単位が、出力の変数を入力の変数で割った単位と合っていることに注意せよ。また傾きが負なので、この一次関数は減少する。毎週金を使っているのだから、これは理にかなっているはずである。
The rate of change is constant, so we can start with the linear model Then we can substitute the intercept and slope provided.
変化の割合が一定なので、一次のモデル から始められる。そのうえで与えられた切片と傾きを代入する。
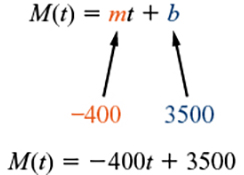
To find the t-intercept (horizontal axis intercept), we set the output to zero, and solve for the input.
t切片(横の軸との交点)を求めるには、出力を0とおいて入力について解く。
The t-intercept (horizontal axis intercept) is 8.75 weeks. Because this represents the input value when the output will be zero, we could say that Elan will have no money left after 8.75 weeks.
t切片(横の軸との交点)は8.75週である。これは出力が0になるときの入力値を表すので、Elan は8.75週後に金が尽きるといえる。
When modeling any real-life scenario with functions, there is typically a limited domain over which that model will be valid—almost no trend continues indefinitely. Here the domain refers to the number of weeks. In this case, it doesn’t make sense to talk about input values less than zero. A negative input value could refer to a number of weeks before Elan saved $3,500, but the scenario discussed poses the question once they saved $3,500 because this is when the trip and subsequent spending starts. It is also likely that this model is not valid after the t-intercept (horizontal axis intercept), unless Elan uses a credit card and goes into debt. The domain represents the set of input values, so the reasonable domain for this function is
現実の場面を関数で表すとき、たいていそのモデルが通用する定義域には限りがある。無限に続く傾向はほとんど無いからである。ここでの定義域は週数を指す。この場合、0より小さい入力値を考えても意味が無い。負の入力値は Elan が3,500ドルを貯める前の週数を指すことになるが、ここで扱っている場面は3,500ドルを貯めた時点から問うている。旅行とそれに伴う支出が始まるのがそのときだからである。また、Elan が信用払いを使って借金をしない限り、t切片(横の軸との交点)より先ではこのモデルは通用しないだろう。定義域は入力値の集合を表すので、この関数の理にかなった定義域は である。
In this example, we were given a written description of the situation. We followed the steps of modeling a problem to analyze the information. However, the information provided may not always be the same. Sometimes we might be provided with an intercept. Other times we might be provided with an output value. We must be careful to analyze the information we are given, and use it appropriately to build a linear model.
この例では、場面が文章で与えられていた。問題を表す手順に従って情報を調べた。しかし与えられる情報がいつも同じとは限らない。切片が与えられることもある。出力値が与えられることもある。与えられた情報をよく調べ、それを適切に使って一次のモデルを組み立てるよう気をつけなければならない。
Using a Given Intercept to Build a Model与えられた切片からモデルを組み立てる
Some real-world problems provide the vertical axis intercept, which is the constant or initial value. Once the vertical axis intercept is known, the t-intercept (horizontal axis intercept) can be calculated. Suppose, for example, that Hannah plans to pay off a no-interest loan from her parents. Her loan balance is $1,000. She plans to pay $250 per month until her balance is $0. The y-intercept is the initial amount of her debt, or $1,000. The rate of change, or slope, is -$250 per month. We can then use the slope-intercept form and the given information to develop a linear model.
現実の問題では、縦の軸との交点、すなわち定数または初めの値が与えられることがある。縦の軸との交点が分かれば、t切片(横の軸との交点)を計算できる。たとえば Hannah が親から借りた無利子の借金を返すつもりだとしよう。借金の残高は1,000ドルである。残高が0ドルになるまで月々250ドル返す予定である。y切片は借金の初めの額、すなわち1,000ドルである。変化の割合すなわち傾きは月あたり −250ドルである。よって傾き切片形と与えられた情報から、一次のモデルを作れる。
Now we can set the function equal to 0, and solve for to find the x-intercept.
ここでこの関数を0とおき、 について解けば x切片が求まる。
The x-intercept is the number of months it takes her to reach a balance of $0. The x-intercept is 4 months, so it will take Hannah four months to pay off her loan.
x切片は、残高が0ドルになるまでの月数である。x切片は4か月なので、Hannah は4か月で借金を返し終える。
Using a Given Input and Output to Build a Model与えられた入力と出力からモデルを組み立てる
Many real-world applications are not as direct as the ones we just considered. Instead they require us to identify some aspect of a linear function. We might sometimes instead be asked to evaluate the linear model at a given input or set the equation of the linear model equal to a specified output.
現実の応用の多くは、いま考えたほど直接的ではない。むしろ一次関数のどこかを見分けることを求められる。与えられた入力での一次のモデルの値を求めるよう言われることも、一次のモデルの方程式を決まった出力に等しいとおくよう言われることもある。
How To 手順
Given a word problem that includes two pairs of input and output values, use the linear function to solve a problem.
入力と出力の組が二つ含まれる文章題が与えられたとき、一次関数を使ってその問題を解く。
1. Identify the input and output values.2. Convert the data to two coordinate pairs.3. Find the slope.4. Write the linear model.5. Use the model to make a prediction by evaluating the function at a given x-value.6. Use the model to identify an x-value that results in a given y-value.7. Answer the question posed.
1. 入力値と出力値を見分ける。2. 資料を二つの座標の組に直す。3. 傾きを求める。4. 一次のモデルを書く。5. 与えられた x の値で関数の値を求め、モデルを使って予測する。6. モデルを使って、与えられた y の値になる x の値を求める。7. 問われたことに答える。
Example 1例1
Using a Linear Model to Investigate a Town’s Population一次のモデルで町の人口を調べる
A town’s population has been growing linearly. In 2004, the population was 6,200. By 2009, the population had grown to 8,100. Assume this trend continues.
ある町の人口は一次で増えてきた。2004年の人口は6,200人だった。2009年には8,100人に増えていた。この傾向が続くとする。
ⓐPredict the population in 2013.ⓑIdentify the year in which the population will reach 15,000.
ⓐ2013年の人口を予測せよ。ⓑ人口が15,000人に達する年を答えよ。
Solution 解答
The two changing quantities are the population size and time. While we could use the actual year value as the input quantity, doing so tends to lead to very cumbersome equations because the y-intercept would correspond to the year 0, more than 2000 years ago!
変わる量は人口の大きさと時間の二つである。西暦の年をそのまま入力の量として使うこともできるが、そうすると y切片が西暦0年、すなわち2000年以上前に対応してしまい、たいてい非常に扱いにくい方程式になる。
To make computation a little nicer, we will define our input as the number of years since 2004.
計算を少し楽にするため、入力を2004年からの年数と定める。
To predict the population in 2013 ( ), we would first need an equation for the population. Likewise, to find when the population would reach 15,000, we would need to solve for the input that would provide an output of 15,000. To write an equation, we need the initial value and the rate of change, or slope.
2013年()の人口を予測するには、まず人口の方程式が要る。同じく、人口が15,000人に達する時期を求めるには、出力が15,000になる入力について解く必要がある。方程式を書くには、初めの値と変化の割合すなわち傾きが要る。
To determine the rate of change, we will use the change in output per change in input.
変化の割合を決めるには、入力の変化に対する出力の変化を使う。
The problem gives us two input-output pairs. Converting them to match our defined variables, the year 2004 would correspond to giving the point Notice that through our clever choice of variable definition, we have “given” ourselves the y-intercept of the function. The year 2009 would correspond to giving the point
問題は入出力の組を二つ与えている。定めた変数に合わせて直すと、2004年は に当たり、点 が得られる。変数の定め方をうまく選んだおかげで、この関数の y切片を自分に「与えて」いることに注意せよ。2009年は に当たり、点 が得られる。
The two coordinate pairs are and Recall that we encountered examples in which we were provided two points earlier in the chapter. We can use these values to calculate the slope.
二つの座標の組は と である。この章の前の方で、二点が与えられる例に出くわしたのを思い出そう。この値を使って傾きを計算できる。
We already know the y-intercept of the line, so we can immediately write the equation:
直線の y切片はすでに分かっているので、すぐに方程式を書ける。
To predict the population in 2013, we evaluate our function at
2013年の人口を予測するには、 での関数の値を求める。
If the trend continues, our model predicts a population of 9,620 in 2013.
この傾向が続けば、このモデルは2013年の人口を9,620人と予測する。
To find when the population will reach 15,000, we can set and solve for
人口が15,000人に達する時期を求めるには、 とおいて について解けばよい。
Our model predicts the population will reach 15,000 in a little more than 23 years after 2004, or somewhere around the year 2027.
このモデルは、2004年から23年余り後、すなわち2027年ごろに人口が15,000人に達すると予測する。
Try It #1やってみよう1
A company sells doughnuts. They incur a fixed cost of $25,000 for rent, insurance, and other expenses. It costs $0.25 to produce each doughnut.
ある会社が揚げ菓子を売っている。家賃・保険・その他の費用として25,000ドルの固定費がかかる。1個作るのに0.25ドルかかる。
ⓐWrite a linear model to represent the cost of the company as a function of the number of doughnuts produced.
ⓑFind and interpret the y-intercept.
ⓐ作った個数 の関数として、この会社の費用 を表す一次のモデルを書け。ⓑy切片を求め、その意味を述べよ。
Try It #2やってみよう2
A city’s population has been growing linearly. In 2008, the population was 28,200. By 2012, the population was 36,800. Assume this trend continues.
ある都市の人口は一次で増えてきた。2008年の人口は28,200人だった。2012年には36,800人になった。この傾向が続くとする。
ⓐPredict the population in 2014.ⓑIdentify the year in which the population will reach 54,000.
ⓐ2014年の人口を予測せよ。ⓑ人口が54,000人に達する年を答えよ。
Using a Diagram to Build a Model図を描いてモデルを組み立てる
It is useful for many real-world applications to draw a picture to gain a sense of how the variables representing the input and output may be used to answer a question. To draw the picture, first consider what the problem is asking for. Then, determine the input and the output. The diagram should relate the variables. Often, geometrical shapes or figures are drawn. Distances are often traced out. If a right triangle is sketched, the Pythagorean Theorem relates the sides. If a rectangle is sketched, labeling width and height is helpful.
現実の応用の多くでは、入力と出力を表す変数を使って問いにどう答えるかをつかむために、絵を描くと役に立つ。絵を描くには、まず問題が何を求めているかを考える。そのうえで入力と出力を決める。図は変数どうしを結びつけるものにする。しばしば図形が描かれる。距離を書き込むことも多い。直角三角形を描けば、ピタゴラスの定理が辺どうしを結びつける。長方形を描くなら、縦と横に印を付けると役に立つ。
Example 2例2
Using a Diagram to Model Distance Walked図を描いて歩いた距離を表す
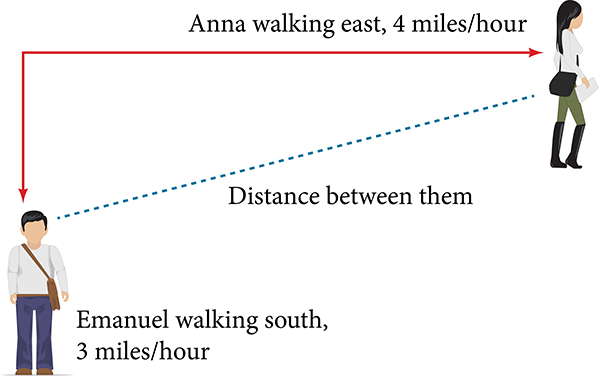
Anna and Emanuel start at the same intersection. Anna walks east at 4 miles per hour while Emanuel walks south at 3 miles per hour. They are communicating with a two-way radio that has a range of 2 miles. How long after they start walking will they fall out of radio contact?
Anna と Emanuel が同じ交差点から出発する。Anna は時速4マイルで東へ、Emanuel は時速3マイルで南へ歩く。二人は届く範囲が2マイルの双方向無線で連絡を取っている。歩き始めてからどれだけ経つと無線が届かなくなるか。
Solution 解答
In essence, we can partially answer this question by saying they will fall out of radio contact when they are 2 miles apart, which leads us to ask a new question:
この問いには、二人が2マイル離れたときに無線が届かなくなる、と答えれば半分は答えたことになる。すると新しい問いが出てくる。
"How long will it take them to be 2 miles apart"?
「二人が2マイル離れるまでにどれだけかかるか」
In this problem, our changing quantities are time and position, but ultimately we need to know how long will it take for them to be 2 miles apart. We can see that time will be our input variable, so we’ll define our input and output variables.
この問題で変わる量は時間と位置だが、結局のところ知りたいのは二人が2マイル離れるまでの時間である。時間が入力の変数になると分かるので、入力と出力の変数を定めよう。
Because it is not obvious how to define our output variable, we’ll start by drawing a picture such as Figure 2.
出力の変数をどう定めるかは自明でないので、まず図2のような絵を描くところから始める。
Initial Value: They both start at the same intersection so when the distance traveled by each person should also be 0. Thus the initial value for each is 0.
初めの値: 二人は同じ交差点から出発するので、 のときそれぞれが進んだ距離も0のはずである。よってどちらの初めの値も0である。
Rate of Change: Anna is walking 4 miles per hour and Emanuel is walking 3 miles per hour, which are both rates of change. The slope for is 4 and the slope for is 3.
変化の割合: Anna は時速4マイル、Emanuel は時速3マイルで歩いており、どちらも変化の割合である。 の傾きは4、 の傾きは3である。
Using those values, we can write formulas for the distance each person has walked.
これらの値を使えば、二人がそれぞれ歩いた距離の式を書ける。
For this problem, the distances from the starting point are important. To notate these, we can define a coordinate system, identifying the “starting point” at the intersection where they both started. Then we can use the variable, which we introduced above, to represent Anna’s position, and define it to be a measurement from the starting point in the eastward direction. Likewise, can use the variable, to represent Emanuel’s position, measured from the starting point in the southward direction. Note that in defining the coordinate system, we specified both the starting point of the measurement and the direction of measure.
この問題では、出発点からの距離が大事である。それを書き表すために、二人が出発した交差点を「出発点」として座標系を定められる。そのうえで、先に導いた変数 で Anna の位置を表し、出発点から東向きに測った量と定める。同じく変数 で Emanuel の位置を表し、出発点から南向きに測った量とする。座標系を定めるときに、測り始めの点と測る向きの両方を決めたことに注意せよ。
We can then define a third variable, to be the measurement of the distance between Anna and Emanuel. Showing the variables on the diagram is often helpful, as we can see from Figure 3.
そのうえで三つ目の変数 を、Anna と Emanuel のあいだの距離と定められる。図3のように、変数を図に書き込むと役に立つことが多い。
Recall that we need to know how long it takes for the distance between them, to equal 2 miles. Notice that for any given input the outputs and represent distances.
二人のあいだの距離 が2マイルになるまでの時間を知る必要があったことを思い出そう。どの入力 についても、出力 と が距離を表すことに注意せよ。
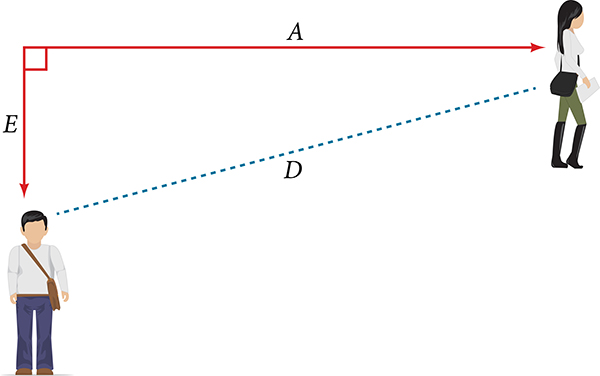
Figure 2 shows us that we can use the Pythagorean Theorem because we have drawn a right angle.
図2から、直角を描いたのでピタゴラスの定理が使えると分かる。
Using the Pythagorean Theorem, we get:
ピタゴラスの定理を使うと、次が得られる。
In this scenario we are considering only positive values of so our distance will always be positive. We can simplify this answer to This means that the distance between Anna and Emanuel is also a linear function. Because is a linear function, we can now answer the question of when the distance between them will reach 2 miles. We will set the output and solve for
この場面では の正の値だけを考えるので、距離 はつねに正になる。この答えは に簡単にできる。つまり Anna と Emanuel のあいだの距離も一次関数である。 が一次関数なので、二人のあいだの距離が2マイルになる時期を求められる。出力を とおいて について解く。
They will fall out of radio contact in 0.4 hour, or 24 minutes.
二人は0.4時間、すなわち24分後に無線が届かなくなる。
Q&A 疑問と答え
Should I draw diagrams when given information based on a geometric shape?
図形をもとにした情報が与えられたら、図を描くべきか。
Yes. Sketch the figure and label the quantities and unknowns on the sketch.
描くべきである。図形の概形を描き、分かっている量と分からない量をその図に書き込むこと。
Example 3例3
Using a Diagram to Model Distance Between Cities図を描いて都市間の距離を表す
There is a straight road leading from the town of Westborough to Agritown 30 miles east and 10 miles north. Partway down this road, it junctions with a second road, perpendicular to the first, leading to the town of Eastborough. If the town of Eastborough is located 20 miles directly east of the town of Westborough, how far is the road junction from Westborough?
Westborough の町から、東へ30マイル、北へ10マイルの Agritown まで、まっすぐな道が通じている。この道の途中で、これに垂直な二本目の道が分かれ、Eastborough の町へ通じている。Eastborough が Westborough のまっすぐ東20マイルにあるとき、分岐点は Westborough からどれだけ離れているか。
Solution 解答
It might help here to draw a picture of the situation. See Figure 4. It would then be helpful to introduce a coordinate system. While we could place the origin anywhere, placing it at Westborough seems convenient. This puts Agritown at coordinates and Eastborough at
ここでは場面の絵を描くと分かりやすい。図4を見よ。そのうえで座標系を導くとよい。原点はどこに置いてもよいが、Westborough に置くのが便利に思える。そうすると Agritown は座標 、Eastborough は になる。
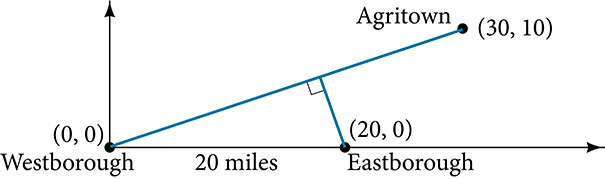
Using this point along with the origin, we can find the slope of the line from Westborough to Agritown.
この点と原点を使えば、Westborough から Agritown への直線の傾きを求められる。
Now we can write an equation to describe the road from Westborough to Agritown.
これで Westborough から Agritown への道を表す方程式を書ける。
From this, we can determine the perpendicular road to Eastborough will have slope Because the town of Eastborough is at the point (20, 0), we can find the equation.
ここから、Eastborough へ向かう垂直な道の傾きが だと決まる。Eastborough は点 (20, 0) にあるので、その方程式を求められる。
We can now find the coordinates of the junction of the roads by finding the intersection of these lines. Setting them equal,
これで、この二直線の交点を求めれば道の分岐点の座標が分かる。両者を等しいとおくと、
The roads intersect at the point (18, 6). Using the distance formula, we can now find the distance from Westborough to the junction.
道は点 (18, 6) で交わる。距離の公式を使えば、Westborough から分岐点までの距離を求められる。
Analysis 考察
One nice use of linear models is to take advantage of the fact that the graphs of these functions are lines. This means real-world applications discussing maps need linear functions to model the distances between reference points.
一次のモデルのよい使い道の一つは、これらの関数のグラフが直線であることを活かすことである。つまり、地図を扱う現実の応用では、基準点どうしの距離を表すのに一次関数が要る。
Try It #3やってみよう3
There is a straight road leading from the town of Timpson to Ashburn 60 miles east and 12 miles north. Partway down the road, it junctions with a second road, perpendicular to the first, leading to the town of Garrison. If the town of Garrison is located 22 miles directly east of the town of Timpson, how far is the road junction from Timpson?
Timpson の町から、東へ60マイル、北へ12マイルの Ashburn まで、まっすぐな道が通じている。この道の途中で、これに垂直な二本目の道が分かれ、Garrison の町へ通じている。Garrison が Timpson のまっすぐ東22マイルにあるとき、分岐点は Timpson からどれだけ離れているか。
Modeling a Set of Data with Linear Functions一組の資料を一次関数で表す
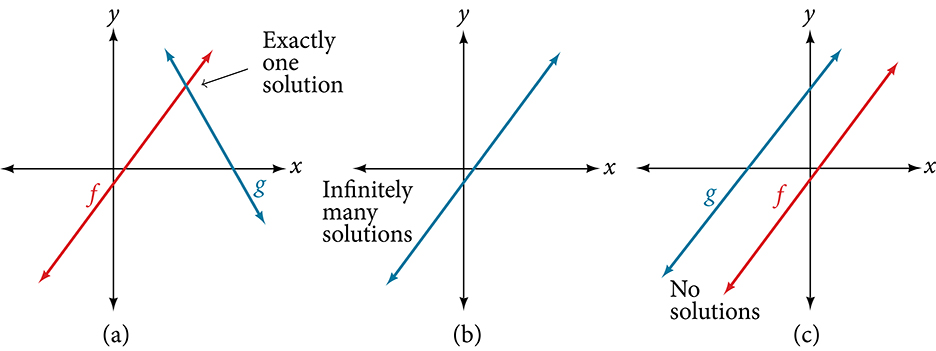
Real-world situations including two or more linear functions may be modeled with a system of linear equations. Remember, when solving a system of linear equations, we are looking for points the two lines have in common. Typically, there are three types of answers possible, as shown in Figure 5.
二つ以上の一次関数を含む現実の場面は、連立一次方程式で表せる。連立一次方程式を解くとは、二本の直線に共通する点を探すことだったのを思い出そう。図5のように、答えはたいてい三通りありうる。
How To 手順
Given a situation that represents a system of linear equations, write the system of equations and identify the solution.
連立一次方程式で表される場面が与えられたとき、連立方程式を書き、その解を答える。
1. Identify the input and output of each linear model.2. Identify the slope and y-intercept of each linear model.3. Find the solution by setting the two linear functions equal to another and solving for or find the point of intersection on a graph.
1. 各一次のモデルの入力と出力を見分ける。2. 各一次のモデルの傾きと y切片を見分ける。3. 二つの一次関数を等しいとおいて について解くか、グラフ上で交点を求めて解を出す。
Example 4例4
Building a System of Linear Models to Choose a Truck Rental Company連立一次のモデルを作ってトラックの貸出業者を選ぶ
Jamal is choosing between two truck-rental companies. The first, Keep on Trucking, Inc., charges an up-front fee of $20, then 59 cents a mile. The second, Move It Your Way, charges an up-front fee of $16, then 63 cents a mile4. When will Keep on Trucking, Inc. be the better choice for Jamal?
Jamal は二つのトラック貸出業者のどちらにするかを選んでいる。一つ目の Keep on Trucking 社は前払いで20ドル、その後1マイルにつき59セントを請求する。二つ目の Move It Your Way 社は前払いで16ドル、その後1マイルにつき63セントを請求する。Jamal にとって Keep on Trucking 社の方が得になるのはどんなときか。
Rates retrieved Aug 2, 2010 from
料金の参照日:2010年8月2日。出典:
and
および
Solution 解答
The two important quantities in this problem are the cost and the number of miles driven. Because we have two companies to consider, we will define two functions in Table 1.
この問題で大事な量は費用と走行マイル数の二つである。業者が二つあるので、表1のように関数を二つ定める。
| Input入力 | distance driven in miles 走行距離(マイル) |
| Outputs出力 | cost, in dollars, for renting from Keep on Trucking cost, in dollars, for renting from Move It Your Way Keep on Trucking で借りたときの費用(ドル) Move It Your Way で借りたときの費用(ドル) |
| Initial Value初めの値 | Up-front fee: and 前払い金: と |
| Rate of Change変化の割合 | /mile and /mile1マイルあたり と |
A linear function is of the form Using the rates of change and initial charges, we can write the equations
一次関数は の形をとる。変化の割合と初めの料金を使えば、方程式を書ける。
Using these equations, we can determine when Keep on Trucking, Inc., will be the better choice. Because all we have to make that decision from is the costs, we are looking for when Move It Your Way, will cost less, or when The solution pathway will lead us to find the equations for the two functions, find the intersection, and then see where the function is smaller.
この方程式を使えば、Keep on Trucking 社の方が得になるのはいつかを決められる。判断の材料は費用だけなので、Move It Your Way 社の方が安くなるとき、すなわち となるときを探す。二つの関数の方程式を求め、交点を求め、そのうえで の関数が小さくなるところを見る、という道筋になる。
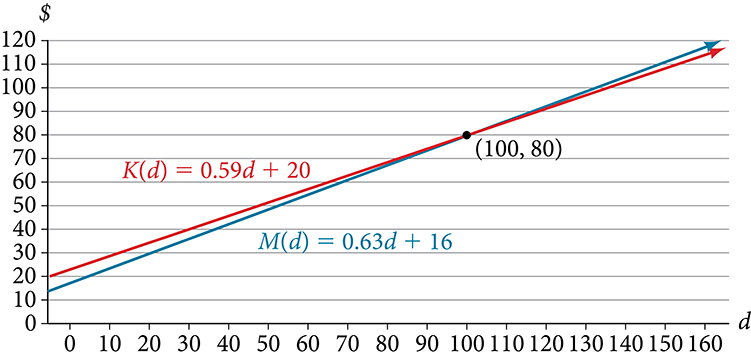
These graphs are sketched in Figure 6, with in blue.
これらのグラフを図6に描く。 は青である。
To find the intersection, we set the equations equal and solve:
交点を求めるには、方程式を等しいとおいて解く。
This tells us that the cost from the two companies will be the same if 100 miles are driven. Either by looking at the graph, or noting that is growing at a slower rate, we can conclude that Keep on Trucking, Inc. will be the cheaper price when more than 100 miles are driven, that is .
これは、100マイル走ると二社の費用が同じになることを教えてくれる。グラフを見るか、 の伸びの方が緩やかであることに気づけば、100マイルより多く走るとき、すなわち のときに Keep on Trucking 社の方が安いと結論できる。
Media 教材
Access this online resource for additional instruction and practice with linear function models.
一次関数のモデルについての説明と練習をさらに求めるなら、次のオンライン教材にあたるとよい。
• Interpreting a Linear Function
・一次関数を読み取る
Verbal言葉で答える問題
2. Explain how to find the output variable in a word problem that uses a linear function.
2. 一次関数を使う文章題で、出力の変数をどう見つけるかを説明せよ。
4. Explain how to determine the slope in a word problem that uses a linear function.
4. 一次関数を使う文章題で、傾きをどう決めるかを説明せよ。
Algebraic代数の問題
6. Find the area of a triangle bounded by the x-axis, the line and the line perpendicular to that passes through the origin.
6. x軸、直線 、そして原点を通り に垂直な直線で囲まれた三角形の面積を求めよ。
8. Find the area of a parallelogram bounded by the x-axis, the line the line and the line parallel to passing through
8. x軸、直線 、直線 、そして を通り に平行な直線で囲まれた平行四辺形の面積を求めよ。
For the following exercises, consider this scenario: A town’s population has been decreasing at a constant rate. In 2010 the population was 5,900. By 2012 the population had dropped to 4,700. Assume this trend continues.
次の各問は、この場面について考える。ある町の人口は一定の割合で減ってきた。2010年の人口は5,900人だった。2012年には4,700人に減った。この傾向が続くとする。
10. Identify the year in which the population will reach 0.
10. 人口が0になる年を答えよ。
For the following exercises, consider this scenario: A town’s population has been increased at a constant rate. In 2010 the population was 46,020. By 2012 the population had increased to 52,070. Assume this trend continues.
次の各問は、この場面について考える。ある町の人口は一定の割合で増えてきた。2010年の人口は46,020人だった。2012年には52,070人に増えた。この傾向が続くとする。
12. Identify the year in which the population will reach 75,000.
12. 人口が75,000人に達する年を答えよ。
For the following exercises, consider this scenario: A town has an initial population of 75,000. It grows at a constant rate of 2,500 per year for 5 years.
次の各問は、この場面について考える。ある町の初めの人口は75,000人である。5年にわたって年に2,500人ずつ一定の割合で増える。
14. Find a reasonable domain and range for the function
14. 関数 の理にかなった定義域と値域を求めよ。
16. If the function is graphed, find and interpret the slope of the function.
16. 関数 のグラフを描いたとき、その傾きを求め、意味を述べよ。
18. What is the population in the year 12 years from the onset of the model?
18. モデルを立ててから12年後の人口はいくらか。
For the following exercises, consider this scenario: The weight of a newborn is 7.5 pounds. The baby gained one-half pound a month for its first year.
次の各問は、この場面について考える。ある新生児の体重は7.5ポンドである。この赤ん坊は最初の1年、月に0.5ポンドずつ増えた。
20. Find a reasonable domain and range for the function
20. 関数 の理にかなった定義域と値域を求めよ。
22. If the function W is graphed, find and interpret the slope of the function.
22. 関数 W のグラフを描いたとき、その傾きを求め、意味を述べよ。
24. What is the output when the input is 6.2?
24. 入力が6.2のときの出力はいくらか。
For the following exercises, consider this scenario: The number of people afflicted with the common cold in the winter months steadily decreased by 205 each year from 2005 until 2010. In 2005, 12,025 people were inflicted.
次の各問は、この場面について考える。冬季に風邪にかかる人の数は、2005年から2010年まで毎年205人ずつ着実に減った。2005年には12,025人がかかった。
26. Find a reasonable domain and range for the function
26. 関数 の理にかなった定義域と値域を求めよ。
28. If the function is graphed, find and interpret the slope of the function.
28. 関数 のグラフを描いたとき、その傾きを求め、意味を述べよ。
30. In what year will the number of people afflicted with the common cold be 9,700?
30. 風邪にかかる人の数が9,700人になるのは何年か。
Graphicalグラフの問題
For the following exercises, use the graph in Figure 7, which shows the profit, in thousands of dollars, of a company in a given year, where represents the number of years since 1980.
次の各問では、図7のグラフを使え。これは年 におけるある会社の利益 (千ドル)を示す。ここで は1980年からの年数である。
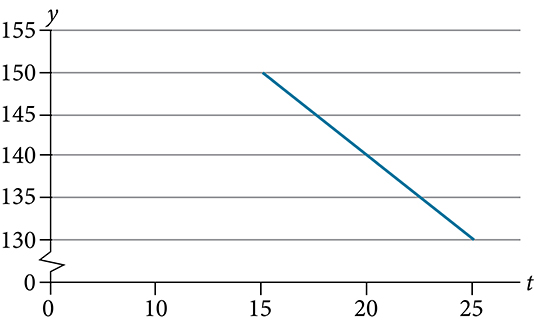
32. Find and interpret the y-intercept.
32. y切片を求め、その意味を述べよ。
34. Find and interpret the slope.
34. 傾きを求め、その意味を述べよ。
For the following exercises, use the graph in Figure 8, which shows the profit, in thousands of dollars, of a company in a given year, where represents the number of years since 1980.
次の各問では、図8のグラフを使え。これは年 におけるある会社の利益 (千ドル)を示す。ここで は1980年からの年数である。
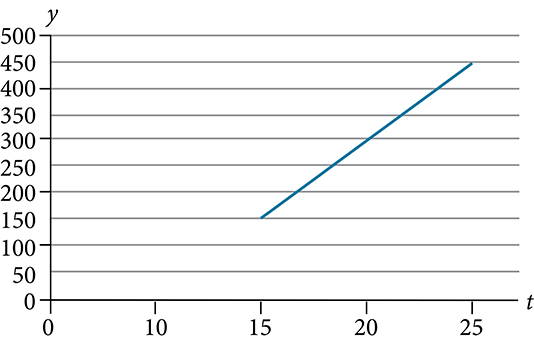
36. Find and interpret the y-intercept.
36. y切片を求め、その意味を述べよ。
38. Find and interpret the slope.
38. 傾きを求め、その意味を述べよ。
Numeric数値の問題
For the following exercises, use the median home values in Mississippi and Hawaii (adjusted for inflation) shown in Table 2. Assume that the house values are changing linearly.
次の各問では、表2に示したミシシッピ州とハワイ州の住宅価格の中央値(物価の変動を調整済み)を使え。住宅の価値は一次で変わるものとする。
| Year年 | Mississippiミシシッピ | Hawaiiハワイ |
|---|---|---|
| 1950 | $25,200 | $74,400 |
| 2000 | $71,400 | $272,700 |
40. If these trends were to continue, what would be the median home value in Mississippi in 2010?
40. この傾向が続いたとすると、2010年のミシシッピ州の住宅価格の中央値はいくらになるか。
For the following exercises, use the median home values in Indiana and Alabama (adjusted for inflation) shown in Table 3. Assume that the house values are changing linearly.
次の各問では、表3に示したインディアナ州とアラバマ州の住宅価格の中央値(物価の変動を調整済み)を使え。住宅の価値は一次で変わるものとする。
| Year年 | Indianaインディアナ | Alabamaアラバマ |
|---|---|---|
| 1950 | $37,700 | $27,100 |
| 2000 | $94,300 | $85,100 |
42. In which state have home values increased at a higher rate?
42. 住宅の価値がより高い割合で上がったのはどちらの州か。
44. If we assume the linear trend existed before 1950 and continues after 2000, the two states’ median house values will be (or were) equal in what year? (The answer might be absurd.)
44. 1950年より前もこの一次の傾向があり、2000年より後も続くとすると、両州の住宅価格の中央値が等しくなる(あるいは等しかった)のは何年か。(答えはばかげたものになるかもしれない。)
Real-World Applications応用問題
45. In 2004, a school population was 1001. By 2008 the population had grown to 1697. Assume the population is changing linearly.
45. 2004年、ある学校の在籍者数は1001人だった。2008年には1697人に増えていた。在籍者数は一次で変わるものとする。
ⓐHow much did the population grow between the year 2004 and 2008?ⓑHow long did it take the population to grow from 1001 students to 1697 students?ⓒWhat is the average population growth per year?ⓓWhat was the population in the year 2000?ⓔFind an equation for the population, of the school t years after 2000.ⓕUsing your equation, predict the population of the school in 2011.
ⓐ2004年から2008年のあいだに在籍者数はどれだけ増えたか。ⓑ在籍者数が1001人から1697人に増えるのにどれだけかかったか。ⓒ1年あたりの平均の増加数はいくらか。ⓓ2000年の在籍者数はいくらだったか。ⓔ2000年から t 年後の学校の在籍者数 を表す方程式を求めよ。ⓕその方程式を使って、2011年の学校の在籍者数を予測せよ。
46. In 2003, a town’s population was 1431. By 2007 the population had grown to 2134. Assume the population is changing linearly.
46. 2003年、ある町の人口は1431人だった。2007年には2134人に増えていた。人口は一次で変わるものとする。
ⓐHow much did the population grow between the year 2003 and 2007?ⓑHow long did it take the population to grow from 1431 people to 2134 people?ⓒWhat is the average population growth per year?ⓓWhat was the population in the year 2000?ⓔFind an equation for the population, of the town years after 2000.ⓕUsing your equation, predict the population of the town in 2014.
ⓐ2003年から2007年のあいだに人口はどれだけ増えたか。ⓑ人口が1431人から2134人に増えるのにどれだけかかったか。ⓒ1年あたりの平均の増加数はいくらか。ⓓ2000年の人口はいくらだったか。ⓔ2000年から 年後の町の人口 を表す方程式を求めよ。ⓕその方程式を使って、2014年の町の人口を予測せよ。
47. A phone company has a monthly cellular plan where a customer pays a flat monthly fee and then a certain amount of money per minute used for voice or video calling. If a customer uses 410 minutes, the monthly cost will be $71.50. If the customer uses 720 minutes, the monthly cost will be $118.
47. ある電話会社の月々の携帯電話の契約では、客は定額の月額料金に加えて、音声通話や映像通話に使った1分あたり決まった額を払う。410分使うと月々の費用は71.50ドルになる。720分使うと月々の費用は118ドルになる。
ⓐFind a linear equation for the monthly cost of the cell plan as a function of x, the number of monthly minutes used.ⓑInterpret the slope and y-intercept of the equation.ⓒUse your equation to find the total monthly cost if 687 minutes are used.
ⓐ月に使った分数 x の関数として、この契約の月々の費用を表す一次方程式を求めよ。ⓑこの方程式の傾きと y切片の意味を述べよ。ⓒその方程式を使って、687分使ったときの月々の費用の合計を求めよ。
48. A phone company has a monthly cellular data plan where a customer pays a flat monthly fee of $10 and then a certain amount of money per megabyte (MB) of data used on the phone. If a customer uses 20 MB, the monthly cost will be $11.20. If the customer uses 130 MB, the monthly cost will be $17.80.
48. ある電話会社の月々のデータ通信の契約では、客は定額の月額料金10ドルに加えて、電話で使ったデータ1メガバイト(MB)あたり決まった額を払う。20MB 使うと月々の費用は11.20ドルになる。130MB 使うと月々の費用は17.80ドルになる。
ⓐFind a linear equation for the monthly cost of the data plan as a function of the number of MB used.ⓑInterpret the slope and y-intercept of the equation.ⓒUse your equation to find the total monthly cost if 250 MB are used.
ⓐ使った MB 数 の関数として、この契約の月々の費用を表す一次方程式を求めよ。ⓑこの方程式の傾きと y切片の意味を述べよ。ⓒその方程式を使って、250MB 使ったときの月々の費用の合計を求めよ。
49. In 1990, the moose population in a park was measured to be 4,360. By 1999, the population was measured again to be 5,880. Assume the population continues to change linearly.
49. 1990年、ある公園のヘラジカの数は4,360頭と測られた。1999年に再び測ると5,880頭だった。個体数は一次で変わり続けるものとする。
ⓐFind a formula for the moose population, P since 1991.ⓑWhat does your model predict the moose population to be in 2003?
ⓐ1991年からのヘラジカの数 P の式を求めよ。ⓑこのモデルは、2003年のヘラジカの数をいくらと予測するか。
50. In 2003, the owl population in a park was measured to be 340. By 2007, the population was measured again to be 285. The population changes linearly. Let the input be years since 2003.
50. 2003年、ある公園のフクロウの数は340羽と測られた。2007年に再び測ると285羽だった。個体数は一次で変わる。入力を2003年からの年数とせよ。
ⓐFind a formula for the owl population, Let the input be years since 2003.ⓑWhat does your model predict the owl population to be in 2012?
ⓐフクロウの数 の式を求めよ。入力は2003年からの年数とする。ⓑこのモデルは、2012年のフクロウの数をいくらと予測するか。
51. The Federal Helium Reserve held about 16 billion cubic feet of helium in 2010 and is being depleted by about 2.1 billion cubic feet each year.
51. 連邦ヘリウム備蓄は2010年におよそ160億立方フィートのヘリウムを保有しており、毎年およそ21億立方フィートずつ減っている。
ⓐGive a linear equation for the remaining federal helium reserves, in terms of the number of years since 2010.ⓑIn 2015, what will the helium reserves be?ⓒIf the rate of depletion doesn’t change, in what year will the Federal Helium Reserve be depleted?
ⓐ2010年からの年数 を使って、残っている連邦ヘリウム備蓄 を表す一次方程式を書け。ⓑ2015年のヘリウム備蓄はいくらになるか。ⓒ減る割合が変わらないとすると、連邦ヘリウム備蓄が尽きるのは何年か。
52. Suppose the world’s oil reserves in 2014 are 1,820 billion barrels. If, on average, the total reserves are decreasing by 25 billion barrels of oil each year:
52. 2014年の世界の石油埋蔵量が1,820億バレルだとする。埋蔵量の合計が平均して毎年250億バレルずつ減るとすると、
ⓐGive a linear equation for the remaining oil reserves, in terms of the number of years since now.ⓑSeven years from now, what will the oil reserves be?ⓒIf the rate at which the reserves are decreasing is constant, when will the world’s oil reserves be depleted?
ⓐ現在からの年数 を使って、残っている石油埋蔵量 を表す一次方程式を書け。ⓑ7年後の石油埋蔵量はいくらになるか。ⓒ埋蔵量が減る割合が一定なら、世界の石油埋蔵量が尽きるのはいつか。
53. You are choosing between two different prepaid cell phone plans. The first plan charges a rate of 26 cents per minute. The second plan charges a monthly fee of $19.95 plus 11 cents per minute. How many minutes would you have to use in a month in order for the second plan to be preferable?
53. 二つの前払い式の携帯電話の契約のどちらにするかを選んでいる。一つ目は1分あたり26セントを請求する。二つ目は月額19.95ドルに加えて1分あたり11セントを請求する。二つ目の方が得になるには、1か月に何分使う必要があるか。
54. You are choosing between two different window washing companies. The first charges $5 per window. The second charges a base fee of $40 plus $3 per window. How many windows would you need to have for the second company to be preferable?
54. 二つの窓拭き業者のどちらにするかを選んでいる。一つ目は窓1枚あたり5ドル。二つ目は基本料金40ドルに加えて窓1枚あたり3ドル。二つ目の方が得になるには、窓が何枚必要か。
55. When hired at a new job selling jewelry, you are given two pay options:
55. 宝飾品を売る新しい仕事に就くとき、二つの給与の選び方を示される。
Option A: Base salary of $17,000 a year with a commission of 12% of your sales
案A: 年間基本給17,000ドルに、売上の12%の歩合
Option B: Base salary of $20,000 a year with a commission of 5% of your sales
案B: 年間基本給20,000ドルに、売上の5%の歩合
How much jewelry would you need to sell for option A to produce a larger income?
案Aの方が収入が多くなるには、宝飾品をいくら売る必要があるか。
56. When hired at a new job selling electronics, you are given two pay options:
56. 電子機器を売る新しい仕事に就くとき、二つの給与の選び方を示される。
Option A: Base salary of $14,000 a year with a commission of 10% of your sales
案A: 年間基本給14,000ドルに、売上の10%の歩合
Option B: Base salary of $19,000 a year with a commission of 4% of your sales
案B: 年間基本給19,000ドルに、売上の4%の歩合
How much electronics would you need to sell for option A to produce a larger income?
案Aの方が収入が多くなるには、電子機器をいくら売る必要があるか。
57. When hired at a new job selling electronics, you are given two pay options:
57. 電子機器を売る新しい仕事に就くとき、二つの給与の選び方を示される。
Option A: Base salary of $20,000 a year with a commission of 12% of your sales
案A: 年間基本給20,000ドルに、売上の12%の歩合
Option B: Base salary of $26,000 a year with a commission of 3% of your sales
案B: 年間基本給26,000ドルに、売上の3%の歩合
How much electronics would you need to sell for option A to produce a larger income?
案Aの方が収入が多くなるには、電子機器をいくら売る必要があるか。
58. When hired at a new job selling electronics, you are given two pay options:
58. 電子機器を売る新しい仕事に就くとき、二つの給与の選び方を示される。
Option A: Base salary of $10,000 a year with a commission of 9% of your sales
案A: 年間基本給10,000ドルに、売上の9%の歩合
Option B: Base salary of $20,000 a year with a commission of 4% of your sales
案B: 年間基本給20,000ドルに、売上の4%の歩合
How much electronics would you need to sell for option A to produce a larger income?
案Aの方が収入が多くなるには、電子機器をいくら売る必要があるか。