第4章一次関数Linear Functions
Interpreting Slope as a Rate of Change傾きを変化の割合として読む
In the examples we have seen so far, the slope was provided to us. However, we often need to calculate the slope given input and output values. Recall that given two values for the input, and and two corresponding values for the output, and —which can be represented by a set of points, and —we can calculate the slope
これまでの例では傾きが与えられていた。しかし入力値と出力値から傾きを計算しなければならないことも多い。二つの入力値 、 と、それに対応する二つの出力値 、 ——これらは点の組 と で表せる——が与えられれば、傾き を計算できたのを思い出そう。
Note that in function notation we can obtain two corresponding values for the output and for the function and so we could equivalently write
関数の表記では、関数 について と という対応する二つの出力値 、 が得られることに注意せよ。よって同じことを次のようにも書ける。
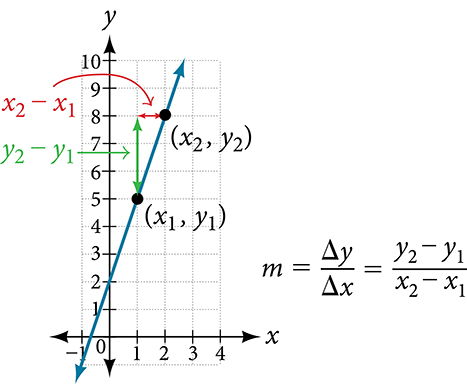
Figure 6 indicates how the slope of the line between the points, and is calculated. Recall that the slope measures steepness, or slant. The greater the absolute value of the slope, the steeper the slant is.
図6に、点 と のあいだの直線の傾きの計算の仕方を示す。傾きは急さ、すなわち傾き具合を測るものだったのを思い出そう。傾きの絶対値が大きいほど急である。
Q&A 疑問と答え
Are the units for slope always
傾きの単位はつねに か。
Yes. Think of the units as the change of output value for each unit of change in input value. An example of slope could be miles per hour or dollars per day. Notice the units appear as a ratio of units for the output per units for the input.
そうである。単位は、入力値が1単位変わるごとの出力値の変化だと考えよう。傾きの例としては、マイル毎時や1日あたりのドルなどがある。単位が、入力の単位あたりの出力の単位という比の形で現れることに注意せよ。
Calculate Slope 傾きの求め方
The slope, or rate of change, of a function can be calculated according to the following:
関数 の傾き、すなわち変化の割合は、次のように計算できる。
where and are input values, and are output values.
ここで と は入力値、 と は出力値である。
How To 手順
Given two points from a linear function, calculate and interpret the slope.
一次関数の二点が与えられたとき、傾きを計算してその意味を読む。
1. Determine the units for output and input values.2. Calculate the change of output values and change of input values.3. Interpret the slope as the change in output values per unit of the input value.
1. 出力値と入力値の単位を決める。2. 出力値の変化と入力値の変化を計算する。3. 傾きを、入力値1単位あたりの出力値の変化として読む。
Example 3例3
Finding the Slope of a Linear Function一次関数の傾きを求める
If is a linear function, and and are points on the line, find the slope. Is this function increasing or decreasing?
が一次関数で、 と がその直線上の点のとき、傾きを求めよ。この関数は増加するか、減少するか。
Solution 解答
The coordinate pairs are and To find the rate of change, we divide the change in output by the change in input.
座標の組は と である。変化の割合を求めるには、出力の変化を入力の変化で割る。
We could also write the slope as The function is increasing because
傾きは とも書ける。 なので、この関数は増加する。
Analysis 考察
As noted earlier, the order in which we write the points does not matter when we compute the slope of the line as long as the first output value, or y-coordinate, used corresponds with the first input value, or x-coordinate, used. Note that if we had reversed them, we would have obtained the same slope.
先に述べたとおり、直線の傾きを計算するとき、点を書く順序は関係ない。ただし、使う一つ目の出力値すなわち y座標が、使う一つ目の入力値すなわち x座標と対応してさえいればよい。順序を入れ替えても同じ傾きになることに注意せよ。
Try It #1やってみよう1
If is a linear function, and and are points on the line, find the slope. Is this function increasing or decreasing?
が一次関数で、 と がその直線上の点のとき、傾きを求めよ。この関数は増加するか、減少するか。
Example 4例4
Finding the Population Change from a Linear Function一次関数から人口の変化を求める
The population of a city increased from 23,400 to 27,800 between 2008 and 2012. Find the change of population per year if we assume the change was constant from 2008 to 2012.
ある都市の人口は、2008年から2012年のあいだに23,400人から27,800人に増えた。2008年から2012年まで変化が一定だったとして、1年あたりの人口の変化を求めよ。
Solution 解答
The rate of change relates the change in population to the change in time. The population increased by people over the four-year time interval. To find the rate of change, divide the change in the number of people by the number of years.
変化の割合は、人口の変化と時間の変化を結びつける。4年の期間に人口は 人増えた。変化の割合を求めるには、人数の変化を年数で割る。
So the population increased by 1,100 people per year.
よって人口は1年あたり1,100人増えた。
Analysis 考察
Because we are told that the population increased, we would expect the slope to be positive. This positive slope we calculated is therefore reasonable.
人口が増えたと言われているので、傾きは正になるはずである。よって、計算した正の傾きは理にかなっている。
Try It #2やってみよう2
The population of a small town increased from 1,442 to 1,868 between 2009 and 2012. Find the change of population per year if we assume the change was constant from 2009 to 2012.
ある小さな町の人口は、2009年から2012年のあいだに1,442人から1,868人に増えた。2009年から2012年まで変化が一定だったとして、1年あたりの人口の変化を求めよ。