第7章中心極限定理
7.1 The Central Limit Theorem for Sample Means (Averages)7.1 標本平均に対する中心極限定理
Suppose X is a random variable with a distribution that may be known or unknown (it can be any distribution). Using a subscript that matches the random variable, suppose:
英語のヒント
Xを、既知または未知の分布に従う確率変数とする(どのような分布でもよい)。確率変数に対応する添字を使い、次のように定める:
- μX = the mean of XμX = Xの平均
- σX = the standard deviation of XσX = Xの標準偏差
If you draw random samples of size n, then as n increases, the random variable which consists of sample means, tends to be normally distributed and
大きさnの無作為標本を抽出すると、nが大きくなるにつれて、標本平均からなる確率変数は正規分布に近づき、次の関係が成り立つ。
The central limit theorem for sample means says that if you repeatedly draw samples of a given size (such as repeatedly rolling ten dice) and calculate their means, those means tend to follow a normal distribution (the sampling distribution). As sample sizes increase, the distribution of means more closely follows the normal distribution. The normal distribution has the same mean as the original distribution and a variance that equals the original variance divided by the sample size. Standard deviation is the square root of variance, so the standard deviation of the sampling distribution is the standard deviation of the original distribution divided by the square root of n. The variable n is the number of values that are averaged together, not the number of times the experiment is done.
英語のヒント
標本平均に対する中心極限定理は、決まった大きさの標本を繰り返し抽出し(たとえば10個のサイコロを繰り返し振り)、それぞれの平均を求めると、その平均は正規分布(標本分布)に従う傾向がある、というものである。標本の大きさが増すと、平均の分布は正規分布にいっそう近づく。この正規分布の平均は元の分布の平均と同じで、分散は元の分散を標本の大きさで割ったものに等しい。標準偏差は分散の平方根なので、標本分布の標準偏差は、元の分布の標準偏差をnの平方根で割ったものになる。変数nは、平均を取る値の個数であり、実験を行う回数ではない。
To put it more formally, if you draw random samples of size n, the distribution of the random variable , which consists of sample means, is called the sampling distribution of the mean. The sampling distribution of the mean approaches a normal distribution as n, the sample size, increases.
英語のヒント
より形式的に述べると、大きさnの無作為標本を抽出したとき、標本平均からなる確率変数の分布を、平均の標本分布という。標本の大きさnが増すにつれて、平均の標本分布は正規分布に近づく。
The random variable has a different z-score associated with it from that of the random variable X. The mean is the value of in one sample.
英語のヒント
確率変数に対応するzスコアは、確率変数Xのzスコアとは異なる。平均は、ある1つの標本におけるの値である。
μX is the average of both X and .
μXはXとの両方の平均である。
standard deviation of and is called the standard error of the mean.
英語のヒント
の標準偏差であり、平均の標準誤差と呼ばれる。
Using the Calculator電卓の操作
Example 7.1例題 7.1
An unknown distribution has a mean of 90 and a standard deviation of 15. Samples of size n = 25 are drawn randomly from the population.
未知の分布の平均が90、標準偏差が15である。この母集団から大きさn = 25の標本を無作為に抽出する。
a. Find the probability that the sample mean is between 85 and 92.
英語のヒント
a. 標本平均が85から92の間にある確率を求める。
Solution解き方
a. Let X = one value from the original unknown population. The probability question asks you to find a probability for the sample mean.
a. X = 元の未知の母集団から得られる1つの値とする。この確率の問題では、標本平均についての確率を求める。
Let = the mean of a sample of size 25. Since μX = 90, σX = 15, and n = 25,
= 大きさ25の標本の平均とする。μX = 90、σX = 15、n = 25なので、
~ N.
Find P(85 < < 92). Draw a graph.
P(85 < < 92)を求める。グラフを描く。
P(85 < < 92) = 0.6997
The probability that the sample mean is between 85 and 92 is 0.6997.
標本平均が85から92の間にある確率は0.6997である。
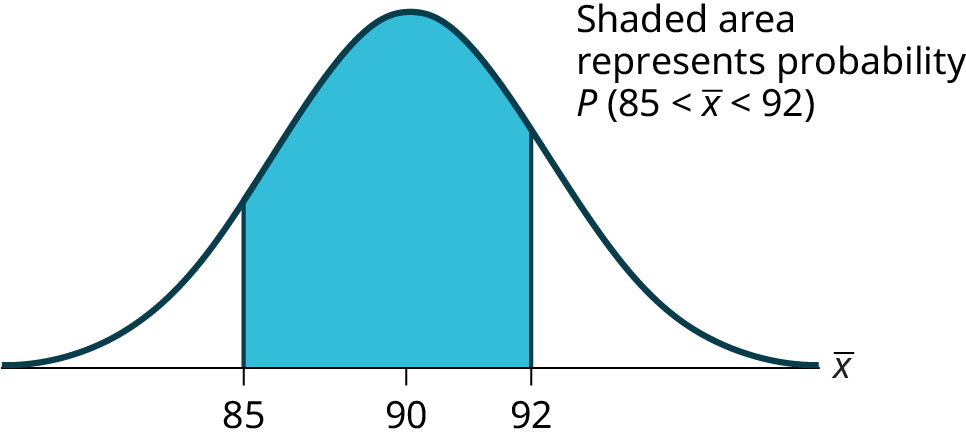

Figure 7.2図 7.2
Using the Calculator電卓の操作
b. Find the value that is two standard deviations above the expected value, 90, of the sample mean.
b. 標本平均の期待値90より、標準偏差2個分だけ上にある値を求める。
Solution解き方
b. To find the value that is two standard deviations above the expected value 90, use the formula:
b. 期待値90より標準偏差2個分だけ上にある値を求めるには、次の公式を使う:
value = μx + (#ofTSDEVs)
値 = μx +(標準偏差の個数)
value = 90 + 2 = 96
値 = 90 + 2 = 96
The value that is two standard deviations above the expected value is 96.
期待値より標準偏差2個分だけ上にある値は96である。
The standard error of the mean is = = 3. Recall that the standard error of the mean is a description of how far (on average) that the sample mean will be from the population mean in repeated simple random samples of size n.
英語のヒント
平均の標準誤差は = = 3である。平均の標準誤差は、大きさnの単純無作為標本を繰り返し抽出したとき、標本平均が母平均から平均的にどれほど離れるかを表すものであることを思い出そう。
Example 7.2例題 7.2
The length of time, in hours, it takes an "over 40" group of people to play one soccer match is normally distributed with a mean of two hours and a standard deviation of 0.5 hours. A sample of size n = 50 is drawn randomly from the population. Find the probability that the sample mean is between 1.8 hours and 2.3 hours.
「40歳超」の人々のグループがサッカーを1試合するのにかかる時間は、平均2時間、標準偏差0.5時間の正規分布に従う。この母集団から大きさn = 50の標本を無作為に抽出する。標本平均が1.8時間から2.3時間の間にある確率を求める。
Solution解き方
Let X = the time, in hours, it takes to play one soccer match.
X = サッカーを1試合するのにかかる時間(時間単位)とする。
The probability question asks you to find a probability for the sample mean time, in hours, it takes to play one soccer match.
この問題では、サッカーを1試合するのにかかる時間(時間単位)の標本平均について、確率を求める。
Let = the mean time, in hours, it takes to play one soccer match.
= サッカーを1試合するのにかかる平均時間(時間単位)とする。
If μX = _________, σX = __________, and n = ___________, then ~ N(______, ______) by the central limit theorem for means.
μX = _________、σX = __________、n = ___________なら、平均に対する中心極限定理により、 ~ N(______, ______)となる。
μX = 2, σX = 0.5, n = 50, and X ~ N
μX = 2、σX = 0.5、n = 50、X ~ N
Find P(1.8 < < 2.3). Draw a graph.
P(1.8 < < 2.3)を求める。グラフを描く。
P(1.8 < < 2.3) = 0.9977
normalcdf = 0.9977The probability that the mean time is between 1.8 hours and 2.3 hours is 0.9977.
平均時間が1.8時間から2.3時間の間にある確率は0.9977である。
Using the Calculator電卓の操作
Example 7.3例題 7.3
In a recent study, it was reported that the mean age of iPad users is 34 years. Suppose the standard deviation is 15 years. Take a sample of size n = 100.
最近の研究で、iPad利用者の平均年齢は34歳と報告された。標準偏差を15歳とする。大きさn = 100の標本を取る。
- What are the mean and standard deviation for the sample mean ages of iPad users?iPad利用者の年齢の標本平均について、平均と標準偏差はいくつか。
- What does the distribution look like?分布はどのような形になるか。
- Find the probability that the sample mean age is more than 30 years (the reported mean age of iPad users in this particular study).年齢の標本平均が30歳(この研究で報告されたiPad利用者の平均年齢)を超える確率を求める。
- Find the 95th percentile for the sample mean age (to one decimal place).年齢の標本平均の第95パーセンタイルを、小数第1位まで求める。
Solution解き方
- Since the sample mean tends to target the population mean, we have μχ = μ = 34. The sample standard deviation is given by σχ = = = = 1.5標本平均は母平均を中心とする傾向があるので、μχ = μ = 34となる。標本の標準偏差は、σχ = = = = 1.5で与えられる。
- The central limit theorem states that for large sample sizes(n), the sampling distribution will be approximately normal.中心極限定理によると、標本の大きさnが大きいと、標本分布は近似的に正規分布になる。
- The probability that the sample mean age is more than 30 is given by =
normalcdf(30,E99,34,1.5) = 0.9962年齢の標本平均が30歳を超える確率は、 = normalcdf(30,E99,34,1.5) = 0.9962で与えられる。 - Let k = the 95th percentile.
k = invNorm = 36.5k = 第95パーセンタイルとする。k = invNorm = 36.5
Example 7.4例題 7.4
The mean number of minutes for app engagement by an iPad user is 8.2 minutes. Suppose the standard deviation is one minute. Take a sample of 60.
英語のヒント
iPad利用者のアプリ利用時間の平均は8.2分である。標準偏差を1分とする。大きさ60の標本を取る。
- What are the mean and standard deviation for the sample mean number of minutes for app engagement by an iPad user?iPad利用者のアプリ利用時間の標本平均について、平均と標準偏差はいくつか。
- What is the standard error of the mean?平均の標準誤差はいくつか。
- Find the 90th percentile for the sample mean time of minutes for app engagement by an iPad user. Interpret this value in a complete sentence.iPad利用者のアプリ利用時間の標本平均について、第90パーセンタイルを求める。この値の意味を完全な文で説明する。
- Find the probability that the sample mean is between eight minutes and 8.5 minutes.標本平均が8分から8.5分の間にある確率を求める。
Solution解き方
- This allows us to calculate the probability of sample means of a particular distance from the mean, in repeated samples of size 60.
英語のヒント
これにより、大きさ60の標本を繰り返し取るとき、標本平均が平均からある距離にある確率を求められる。 - Let k = the 90th percentile
k =invNorm= 8.37. This values indicates that 90 percent of the average app engagement time for iPad users is less than 8.37 minutes.k = 第90パーセンタイルとする。k = invNorm = 8.37。この値は、iPad利用者の平均アプリ利用時間の90%が8.37分未満であることを示す。 - P(8 < < 8.5) =
normalcdf= 0.9293