第7章中心極限定理
7.3 Using the Central Limit Theorem7.3 中心極限定理の利用
It is important for you to understand when to use the central limit theorem. If you are being asked to find the probability of the mean, use the clt for the mean. If you are being asked to find the probability of a sum or total, use the clt for sums. This also applies to percentiles for means and sums.
英語のヒント
中心極限定理をいつ使うかを理解することは重要である。平均についての確率を求めるよう問われた場合は、平均に対する中心極限定理を使う。和や合計についての確率を求めるよう問われた場合は、和に対する中心極限定理を使う。平均や和のパーセンタイルについても同じことが当てはまる。
Examples of the Central Limit Theorem中心極限定理の例
Law of Large Numbers大数の法則
The law of large numbers says that if you take samples of larger and larger size from any population, then the mean of the sample tends to get closer and closer to μ. From the central limit theorem, we know that as n gets larger and larger, the sample means follow a normal distribution. The larger n gets, the smaller the standard deviation gets. (Remember that the standard deviation for is .) This means that the sample mean must be close to the population mean μ. We can say that μ is the value that the sample means approach as n gets larger. The central limit theorem illustrates the law of large numbers.
英語のヒント
大数の法則によると、どの母集団からでも、次第に大きな標本を取っていくと、標本平均はμにいっそう近づく。中心極限定理から、nが次第に大きくなるにつれて、標本平均は正規分布に従うと分かる。nが大きいほど、標準偏差は小さくなる(の標準偏差はであることを思い出そう)。このことは、標本平均が母平均μに近くなければならないことを意味する。μは、nが大きくなるにつれて標本平均が近づく値であるといえる。中心極限定理は大数の法則を示している。
Central Limit Theorem for the Mean and Sum Examples平均と和に対する中心極限定理の例
Example 7.8例題 7.8
A study involving stress is conducted among the students on a college campus. The stress scores follow a uniform distribution with the lowest stress score equal to one and the highest equal to five. Using a sample of 75 students, find:
英語のヒント
ある大学の学生を対象に、ストレスに関する調査を行う。ストレス得点は、最低得点1、最高得点5の一様分布に従う。75人の学生の標本を使い、次を求める:
- The probability that the mean stress score for the 75 students is less than two.75人の学生の平均ストレス得点が2未満となる確率。
- The 90th percentile for the mean stress score for the 75 students.75人の学生の平均ストレス得点の第90パーセンタイル。
- The probability that the total of the 75 stress scores is less than 200.75人のストレス得点の合計が200未満となる確率。
- The 90th percentile for the total stress score for the 75 students.75人の学生の合計ストレス得点の第90パーセンタイル。
Let X = one stress score.
X = 1人のストレス得点とする。
Problems a and b ask you to find a probability or a percentile for a mean. Problems c and d ask you to find a probability or a percentile for a total or sum. The sample size, n, is equal to 75.
問題aとbでは、平均についての確率またはパーセンタイルを求める。問題cとdでは、合計または和についての確率またはパーセンタイルを求める。標本の大きさnは75である。
Since the individual stress scores follow a uniform distribution, X ~ U(1, 5) where a = 1 and b = 5 (See Continuous Random Variables for an explanation on the uniform distribution).
個々のストレス得点は一様分布に従うので、X ~ U(1, 5)であり、a = 1、b = 5となる(一様分布の説明は「連続確率変数」を参照)。
μX = = = 3
σX = =
σX = =
For problems a. and b., let = the mean stress score for the 75 students. Then,
問題aとbでは、 = 75人の学生の平均ストレス得点とする。すると、
∼ N
a. Find P( < 2). Draw the graph.
a. P( < 2)を求める。グラフを描く。
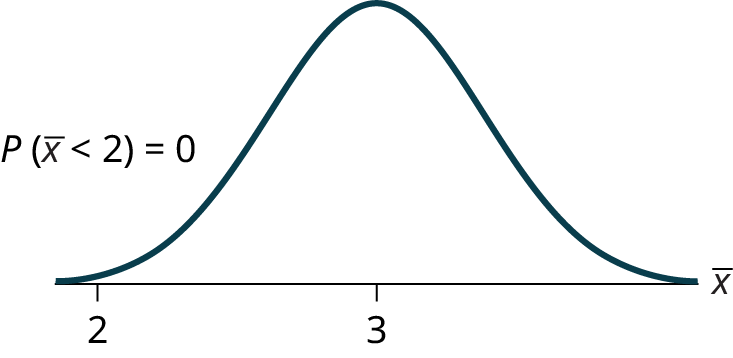
b. Find the 90th percentile for the mean of 75 stress scores. Draw a graph.
b. 75人のストレス得点の平均について、第90パーセンタイルを求める。グラフを描く。
Solution解き方
b. Let k = the 90th precentile.
b. k = 第90パーセンタイルとする。
Find k, where P( < k) = 0.90.
P( < k) = 0.90となるkを求める。
k = 3.2
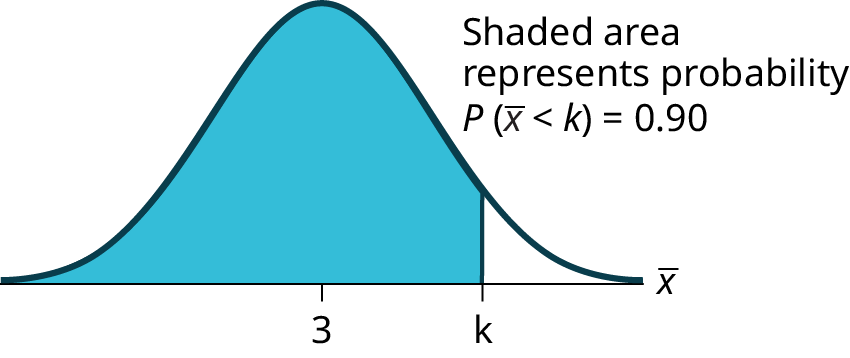
Figure 7.8図 7.8
The 90th percentile for the mean of 75 scores is about 3.2. This tells us that 90% of all the means of 75 stress scores are at most 3.2, and that 10% are at least 3.2.
75人の得点の平均の第90パーセンタイルは約3.2である。これは、75人のストレス得点の平均をすべて考えたとき、その90%が3.2以下で、10%が3.2以上であることを示す。
invNorm = 3.2For problems c and d, let ΣX = the sum of the 75 stress scores. Then, ΣX ~ N[(75)(3),(1.15)]
問題cとdでは、ΣX = 75人のストレス得点の和とする。すると、ΣX ~ N[(75)(3),(1.15)]となる。
c. Find P(Σx < 200). Draw the graph.
c. P(Σx < 200)を求める。グラフを描く。
Solution解き方
c. The mean of the sum of 75 stress scores is (75)(3) = 225
c. 75人のストレス得点の和の平均は、(75)(3) = 225である。
The standard deviation of the sum of 75 stress scores is
75人のストレス得点の和の標準偏差はである。
P(Σx < 200) = –0.0062
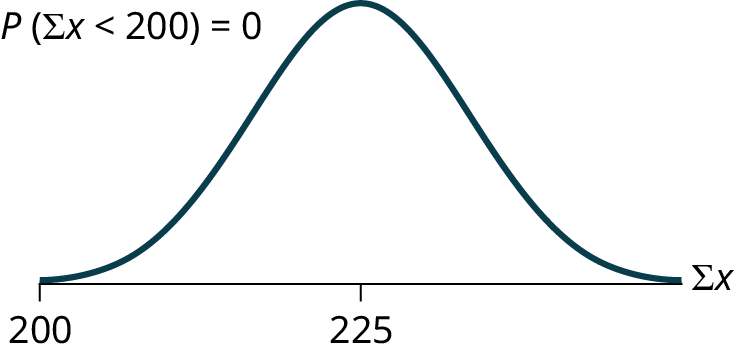
Figure 7.9図 7.9
The probability that the total of 75 scores is less than 200 is about 0.0062.
75人の得点の合計が200未満となる確率は、約0.0062である。
normalcdf (75,200,225,10).normalcdf (75,200,225,10)。
d. Find the 90th percentile for the total of 75 stress scores. Draw a graph.
d. 75人のストレス得点の合計について、第90パーセンタイルを求める。グラフを描く。
Solution解き方
d. Let k = the 90th percentile.
d. k = 第90パーセンタイルとする。
Find k where P(Σx < k) = 0.90.
P(Σx < k) = 0.90となるkを求める。
k = 237.8
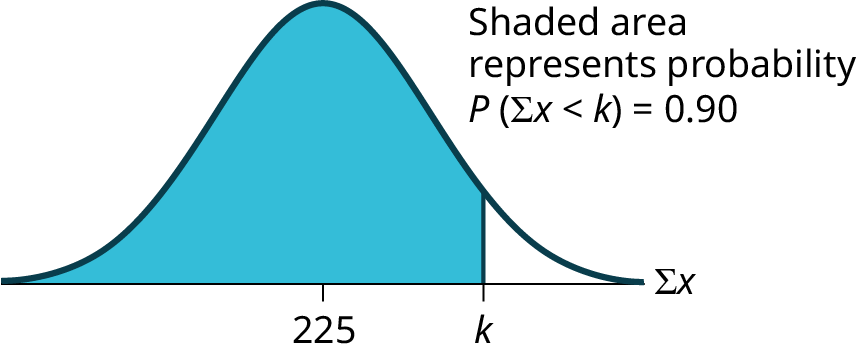
Figure 7.10図 7.10
The 90th percentile for the sum of 75 scores is about 237.8. This tells us that 90% of all the sums of 75 scores are no more than 237.8 and 10% are no less than 237.8.
75人の得点の和の第90パーセンタイルは約237.8である。これは、75人の得点の和をすべて考えたとき、その90%が237.8以下で、10%が237.8以上であることを示す。
invNorm(0.90,(75)(3),(1.15)) = 237.8Example 7.9例題 7.9
Suppose that a market research analyst for a cell phone company conducts a study of their customers who exceed the time allowance included on their basic cell phone contract; the analyst finds that for those people who exceed the time included in their basic contract, the excess time used follows an exponential distribution with a mean of 22 minutes.
英語のヒント
ある携帯電話会社の市場調査分析者が、基本契約に含まれる通話時間を超過した顧客を調査するとする。分析の結果、基本契約の時間を超過した顧客の超過利用時間は、平均22分の指数分布に従うことが分かった。
Consider a random sample of 80 customers who exceed the time allowance included in their basic cell phone contract.
携帯電話の基本契約に含まれる通話時間を超過した顧客80人の無作為標本について考える。
Let X = the excess time used by one INDIVIDUAL cell phone customer who exceeds his contracted time allowance.
X = 契約で認められた時間を超過した携帯電話の顧客1人の超過利用時間とする。
X ∼ Exp. From previous chapters, we know that μ = 22 and σ = 22.
X ∼ Exp。前の章から、μ = 22、σ = 22であることが分かる。
Let = the mean excess time used by a sample of n = 80 customers who exceed their contracted time allowance.
= 契約で認められた時間を超過した顧客n = 80人の標本の平均超過利用時間とする。
~ N by the central limit theorem for sample means
標本平均に対する中心極限定理により、 ~ Nとなる。
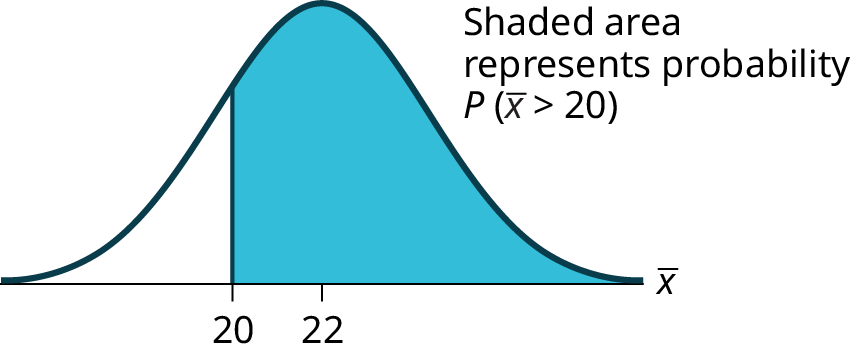
- Find the probability that the mean excess time used by the 80 customers in the sample is longer than 20 minutes. This is asking us to find P( > 20). Draw the graph.標本の顧客80人の平均超過利用時間が20分を超える確率を求める。これはP( > 20)を求める問いである。グラフを描く。
- Suppose that one customer who exceeds the time limit for his cell phone contract is randomly selected. Find the probability that this individual customer's excess time is longer than 20 minutes. This is asking us to find P(x > 20).携帯電話の契約時間を超過した顧客を1人、無作為に選ぶとする。この顧客個人の超過時間が20分を超える確率を求める。これはP(x > 20)を求める問いである。
- Explain why the probabilities in parts a and b are different.aとbの確率が異なる理由を説明する。
Using the clt to find probability中心極限定理を使って確率を求める
Solution解き方
- Find: P( > 20)求める確率:P( > 20)P( > 20) = 0.79199 using
normalcdfnormalcdfを使うと、P( > 20) = 0.79199となる。The probability is 0.7919 that the mean excess time used is more than 20 minutes, for a sample of 80 customers who exceed their contracted time allowance.契約で認められた時間を超過した顧客80人の標本について、平均超過利用時間が20分を超える確率は0.7919である。Figure 7.11図 7.11 - Find P(x > 20). Remember to use the exponential distribution for an individual: .
or e(–0.04545(20)) = 0.4029P(x > 20)を求める。個人については指数分布を使うことを忘れないようにする。、すなわちe(–0.04545(20)) = 0.4029。 - P(x > 20) = 0.4029 but P( > 20) = 0.7919P(x > 20) = 0.4029であるが、P( > 20) = 0.7919である。
- The probabilities are not equal because we use different distributions to calculate the probability for individuals and for means.個々の値と平均では、確率を求める際に使う分布が異なるので、確率は等しくならない。
- When asked to find the probability of an individual value, use the stated distribution of its random variable; do not use the clt. Use the clt with the normal distribution when you are being asked to find the probability for a mean.
英語のヒント
個々の値の確率を求めるよう問われた場合は、中心極限定理を使わず、与えられた確率変数の分布を使う。平均の確率を求めるよう問われた場合は、中心極限定理と正規分布を使う。
Using the clt to find percentiles中心極限定理を使ってパーセンタイルを求める
Find the 95th percentile for the sample mean excess time for samples of 80 customers who exceed their basic contract time allowances. Draw a graph.
基本契約で認められた時間を超過した顧客80人の標本について、超過時間の標本平均の第95パーセンタイルを求める。グラフを描く。
Solution解き方
Let k = the 95th percentile. Find k where P( < k) = 0.95
k = 第95パーセンタイルとする。P( < k) = 0.95となるkを求める。
k = 26.0 using
invNorm = 26.0invNorm = 26.0を使うと、k = 26.0となる。
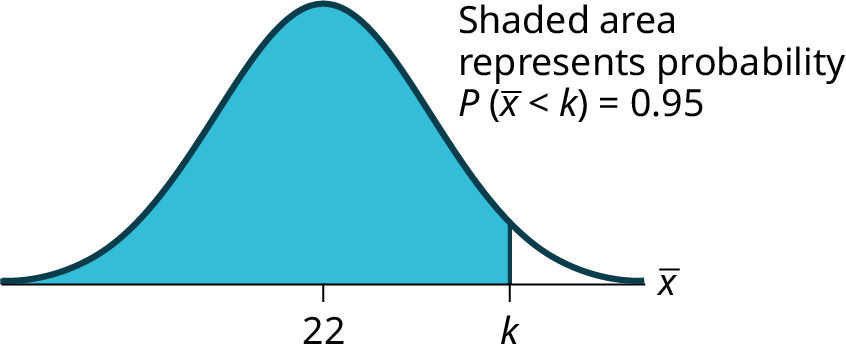


Figure 7.12図 7.12
The 95th percentile for the sample mean excess time used is about 26.0 minutes for random samples of 80 customers who exceed their contractual allowed time.
契約で認められた時間を超過した顧客80人の無作為標本では、超過利用時間の標本平均の第95パーセンタイルは約26.0分である。
Ninety five percent of such samples would have means under 26 minutes; only five percent of such samples would have means above 26 minutes.
このような標本の95%は平均が26分未満となり、平均が26分を超える標本は5%だけである。
Example 7.10例題 7.10
In the United States, a robbery occurs every two minutes, on average, according to a number of studies. Suppose the standard deviation is 0.5 minutes and the sample size is 100.
英語のヒント
複数の研究によると、米国では平均して2分ごとに強盗が発生する。標準偏差を0.5分、標本の大きさを100とする。
- Find the median, the first quartile, and the third quartile for the sample mean time of robberies in the United States.米国で強盗が発生する時間間隔の標本平均について、中央値、第1四分位数、第3四分位数を求める。
- Find the median, the first quartile, and the third quartile for the sum of sample times of robberies in the United States.米国で強盗が発生する時間間隔の標本の和について、中央値、第1四分位数、第3四分位数を求める。
- Find the probability that a robbery occurs on the average between 1.75 and 1.85 minutes.強盗が発生する平均時間間隔が1.75分から1.85分の間にある確率を求める。
- Find the value that is two standard deviations above the sample mean.標本平均より標準偏差2個分だけ上にある値を求める。
- Find the IQR for the sum of the sample times.標本の時間間隔の和について、IQRを求める。
Solution解き方
- We have, μx = μ = 2 and σx = = = 0.05. Therefore:μx = μ = 2、σx = = = 0.05である。したがって、
- 50th percentile = μx = μ = 2第50パーセンタイル = μx = μ = 2
- 25th percentile = invNorm(0.25,2,0.05) = 1.97第25パーセンタイル = invNorm(0.25,2,0.05) = 1.97
- 75th percentile = invNorm(0.75,2,0.05) = 2.03第75パーセンタイル = invNorm(0.75,2,0.05) = 2.03
- We have μΣx = n(μx) = 100(2) = 200 and σμx = (σx) = 10(0.5) = 5. ThereforeμΣx = n(μx) = 100(2) = 200、σμx = (σx) = 10(0.5) = 5である。したがって、
- 50th percentile = μΣx = n(μx) = 100(2) = 200第50パーセンタイル = μΣx = n(μx) = 100(2) = 200
- 25th percentile = invNorm(0.25,200,5) = 196.63第25パーセンタイル = invNorm(0.25,200,5) = 196.63
- 75th percentile = invNorm(0.75,200,5) = 203.37第75パーセンタイル = invNorm(0.75,200,5) = 203.37
- P(1.75 < < 1.85) =
normalcdf(1.75,1.85,2,0.05) = 0.0013 - Using the z-score equation, , and solving for x, we have x = 2(0.05) + 2 = 2.1zスコアの式を使い、xについて解くと、x = 2(0.05) + 2 = 2.1となる。
- The IQR is 75th percentile – 25th percentile = 203.37 – 196.63 = 6.74IQRは、第75パーセンタイル − 第25パーセンタイル = 203.37 − 196.63 = 6.74である。
Example 7.11例題 7.11
A study was done regarding attendance at Broadway shows in New York City. The age range of the attendees was 14 to 61. The mean age was 30.9 years with a standard deviation of nine years.
英語のヒント
ニューヨーク市のブロードウェイ公演の観客について調査が行われた。観客の年齢の範囲は14歳から61歳、平均年齢は30.9歳、標準偏差は9歳であった。
- In a sample of 25 attendees, what is the probability that the mean age is less than 35?観客25人の標本で、平均年齢が35歳未満となる確率はいくつか。
- Is it likely that the mean age of the sample group could be more than 50 years? Interpret the results.標本集団の平均年齢が50歳を超えることは起こりそうか。結果を解釈する。
- In a sample of 49 attendees, what is the probability that the sum of the ages is no less than 1,600?観客49人の標本で、年齢の和が1,600年以上となる確率はいくつか。
- Is it likely that the sum of the ages of the 49 attendees is at most 1,595? Interpret the results.49人の観客の年齢の和が1,595年以下になることは起こりそうか。結果を解釈する。
- Find the 95th percentile for the sample mean age of 65 attendees. Interpret the results.観客65人の標本平均年齢の第95パーセンタイルを求める。結果を解釈する。
- Find the 90th percentile for the sum of the ages of 65 attendees. Interpret the results.観客65人の年齢の和の第90パーセンタイルを求める。結果を解釈する。
Solution解き方
- P( < 35) =
normalcdf(-E99,35,30.9,1.8) = 0.9886 - P( > 50) =
normalcdf(50, E99,30.9,1.8) ≈ 0. For this sample group, it is almost impossible for the group’s average age to be more than 50. However, it is still possible for an individual in this group to have an age greater than 50.P( > 50) = normalcdf(50, E99,30.9,1.8) ≈ 0。この標本集団の平均年齢が50歳を超えることは、ほぼありえない。しかし、この集団に50歳を超える個人がいることは可能である。 - P(Σx ≥ 1,600) =
normalcdf(1600,E99,1514.10,63) = 0.0864 - P(Σx ≤ 1,595) =
normalcdf(-E99,1595,1514.10,63) = 0.9005. This means that there is a 90% chance that the sum of the ages for the sample group n = 49 is at most 1595.P(Σx ≤ 1,595) = normalcdf(-E99,1595,1514.10,63) = 0.9005。これは、n = 49の標本集団の年齢の和が1,595年以下となる確率が90%であることを意味する。 - The 95th percentile =
invNorm(0.95,30.9,1.1) = 32.7. This indicates that 95% of the attendees in the sample of 65 are younger than 32.7 years, on average.第95パーセンタイル = invNorm(0.95,30.9,1.1) = 32.7。これは、65人の標本の観客の95%は、平均して32.7歳未満であることを示す。 - The 90th percentile =
invNorm(0.90,2008.5,72.56) = 2101.5. This indicates that 90% of the attendees in the sample of 65 have a sum of ages less than 2,101.5 years.第90パーセンタイル = invNorm(0.90,2008.5,72.56) = 2101.5。これは、65人の標本の観客の90%で、年齢の和が2,101.5年未満であることを示す。
Example 7.12例題 7.12
Suppose in a local Kindergarten through 12th grade (K - 12) school district, 53 percent of the population favor a charter school for grades K through 5. A simple random sample of 300 is surveyed.
英語のヒント
ある地域の幼稚園から第12学年まで(K–12)の学区で、住民の53%が、幼稚園から第5学年までのチャータースクールを支持しているとする。300人の単純無作為標本を調査する。
- Find the probability that at least 150 favor a charter school.少なくとも150人がチャータースクールを支持する確率を求める。
- Find the probability that at most 160 favor a charter school.チャータースクールを支持する人が160人以下となる確率を求める。
- Find the probability that more than 155 favor a charter school.チャータースクールを支持する人が155人を超える確率を求める。
- Find the probability that fewer than 147 favor a charter school.チャータースクールを支持する人が147人未満となる確率を求める。
- Find the probability that exactly 175 favor a charter school.ちょうど175人がチャータースクールを支持する確率を求める。
Let X = the number that favor a charter school for grades K trough 5. X ~ B(n, p) where n = 300 and p = 0.53. Since np > 5 and nq > 5, use the normal approximation to the binomial. The formulas for the mean and standard deviation are μ = np and σ = . The mean is 159 and the standard deviation is 8.6447. The random variable for the normal distribution is Y. Y ~ N(159, 8.6447). See The Normal Distribution for help with calculator instructions.
X = 幼稚園から第5学年までのチャータースクールを支持する人数とする。X ~ B(n, p)であり、n = 300、p = 0.53である。np > 5かつnq > 5なので、二項分布の正規近似を使う。平均と標準偏差の公式はμ = np、σ = である。平均は159、標準偏差は8.6447である。正規分布の確率変数をYとする。Y ~ N(159, 8.6447)。計算機の操作方法については「正規分布」を参照する。
For part a, you include 150 so P(X ≥ 150) has normal approximation P(Y ≥ 149.5) = 0.8641.
aでは150を含めるので、P(X ≥ 150)の正規近似はP(Y ≥ 149.5) = 0.8641となる。
normalcdf(149.5,10^99,159,8.6447) = 0.8641.normalcdf(149.5,10^99,159,8.6447) = 0.8641。
For part b, you include 160 so P(X ≤ 160) has normal appraximation P(Y ≤ 160.5) = 0.5689.
bでは160を含めるので、P(X ≤ 160)の正規近似はP(Y ≤ 160.5) = 0.5689となる。
normalcdf(0,160.5,159,8.6447) = 0.5689For part c, you exclude 155 so P(X > 155) has normal approximation P(y > 155.5) = 0.6572.
英語のヒント
cでは155を含めないので、P(X > 155)の正規近似はP(y > 155.5) = 0.6572となる。
normalcdf(155.5,10^99,159,8.6447) = 0.6572.normalcdf(155.5,10^99,159,8.6447) = 0.6572。
For part d, you exclude 147 so P(X < 147) has normal approximation P(Y < 146.5) = 0.0741.
dでは147を含めないので、P(X < 147)の正規近似はP(Y < 146.5) = 0.0741となる。
normalcdf(0,146.5,159,8.6447) = 0.0741For part e,P(X = 175) has normal approximation P(174.5 < Y < 175.5) = 0.0083.
eでは、P(X = 175)の正規近似はP(174.5 < Y < 175.5) = 0.0083となる。
normalcdf(174.5,175.5,159,8.6447) = 0.0083Because of calculators and computer software that let you calculate binomial probabilities for large values of n easily, it is not necessary to use the the normal approximation to the binomial distribution, provided that you have access to these technology tools. Most school labs have Microsoft Excel, an example of computer software that calculates binomial probabilities. Many students have access to the TI-83 or 84 series calculators, and they easily calculate probabilities for the binomial distribution. If you type in "binomial probability distribution calculation" in an Internet browser, you can find at least one online calculator for the binomial.
英語のヒント
大きなnの二項確率を簡単に計算できる計算機やコンピューターソフトウェアがあるので、そうした技術的な道具を利用できるなら、二項分布の正規近似を使う必要はない。多くの学校の実習室にはMicrosoft Excelがあり、これも二項確率を計算できるソフトウェアの1つである。多くの学生はTI-83または84シリーズの計算機を利用でき、これらを使えば二項分布の確率を簡単に求められる。インターネットのブラウザーに「binomial probability distribution calculation」と入力すれば、少なくとも1つは二項分布を計算するオンライン計算機が見つかる。
For Example 7.12, the probabilities are calculated using the following binomial distribution: (n = 300 and p = 0.53). Compare the binomial and normal distribution answers. See Discrete Random Variables for help with calculator instructions for the binomial.
P(X ≥ 150) :
1 - binomialcdf(300,0.53,149) = 0.8641P(X ≥ 150):1 − binomialcdf(300,0.53,149) = 0.8641
P(X ≤ 160) :
binomialcdf(300,0.53,160) = 0.5684P(X ≤ 160):binomialcdf(300,0.53,160) = 0.5684
P(X > 155) :
1 - binomialcdf(300,0.53,155) = 0.6576P(X > 155):1 − binomialcdf(300,0.53,155) = 0.6576
P(X < 147) :
binomialcdf(300,0.53,146) = 0.0742P(X < 147):binomialcdf(300,0.53,146) = 0.0742
P(X = 175) :(You use the binomial pdf.)
binomialpdf(300,0.53,175) = 0.0083P(X = 175):二項分布のpdfを使う。binomialpdf(300,0.53,175) = 0.0083