第7章中心極限定理
References参考文献
Baran, Daya. “20 Percent of Americans Have Never Used Email.”WebGuild, 2010. Available online at http://www.webguild.org/20080519/20-percent-of-americans-have-never-used-email (accessed May 17, 2013).
Baran, Daya「米国人の20%は電子メールを一度も使ったことがない」WebGuild、2010年。オンライン掲載:http://www.webguild.org/20080519/20-percent-of-americans-have-never-used-email(2013年5月17日閲覧)。
Data from The Flurry Blog, 2013. Available online at http://blog.flurry.com (accessed May 17, 2013).
データ:The Flurry Blog、2013年。オンライン掲載:http://blog.flurry.com(2013年5月17日閲覧)。
Data from the United States Department of Agriculture.
データ:米国農務省。
Chapter Review章の復習
In a population whose distribution may be known or unknown, if the size (n) of samples is sufficiently large, the distribution of the sample means will be approximately normal. The mean of the sample means will equal the population mean. The standard deviation of the distribution of the sample means, called the standard error of the mean, is equal to the population standard deviation divided by the square root of the sample size (n).
分布が既知または未知の母集団において、標本の大きさnが十分大きければ、標本平均の分布は近似的に正規分布となる。標本平均の平均は母平均に等しい。標本平均の分布の標準偏差は平均の標準誤差と呼ばれ、母標準偏差を標本の大きさnの平方根で割ったものに等しい。
Formula Review公式の復習
The Central Limit Theorem for Sample Means: ~ N
標本平均に対する中心極限定理: ~ N
The Mean : μx
の平均:μx
Central Limit Theorem for Sample Means z-score and standard error of the mean:
標本平均に対する中心極限定理におけるzスコアと平均の標準誤差:
Standard Error of the Mean (Standard Deviation ()):
平均の標準誤差(の標準偏差):
Exercises 1–6練習問題 1–6
Use the following information to answer the next six exercises: Yoonie is a personnel manager in a large corporation. Each month she must review 16 of the employees. From past experience, she has found that the reviews take her approximately four hours each to do with a population standard deviation of 1.2 hours. Let Χ be the random variable representing the time it takes her to complete one review. Assume Χ is normally distributed. Let be the random variable representing the mean time to complete the 16 reviews. Assume that the 16 reviews represent a random set of reviews.
英語のヒント
次の情報を使い、続く6問に答える。ユーニーは大企業の人事部長であり、毎月16人の従業員の勤務評定を行わなければならない。過去の経験から、評定には1人あたり約4時間かかり、母標準偏差は1.2時間であると分かっている。1人の評定を終えるまでの時間を表す確率変数をΧとする。Χは正規分布に従うと仮定する。16人の評定を終えるまでの平均時間を表す確率変数をとする。この16件の評定は無作為な評定の集合であると仮定する。
Exercise 1問題 1
What is the mean, standard deviation, and sample size?
平均、標準偏差、標本の大きさはいくつか。
Solution解き方
mean = 4 hours; standard deviation = 1.2 hours; sample size = 16
平均 = 4時間、標準偏差 = 1.2時間、標本の大きさ = 16
Exercise 2問題 2
Complete the distributions.
分布の表記を完成させる。
- X ~ _____(_____,_____)
- ~ _____(_____,_____)
Exercise 3問題 3
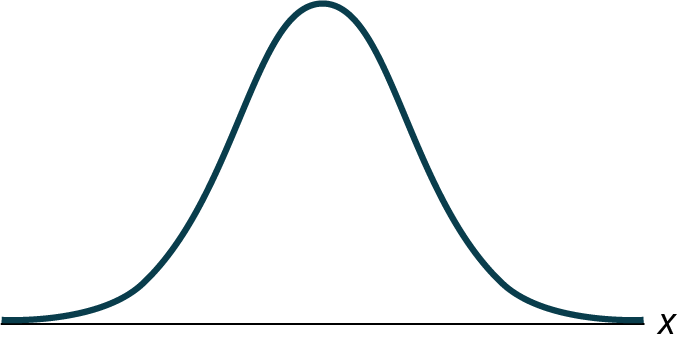
Find the probability that one review will take Yoonie from 3.5 to 4.25 hours. Sketch the graph, labeling and scaling the horizontal axis. Shade the region corresponding to the probability.
英語のヒント
ユーニーが1人の評定に3.5時間から4.25時間かかる確率を求める。グラフの概形を描き、横軸にラベルと目盛りを付ける。求める確率に対応する領域を塗る。
- Figure 7.3図 7.3
- P(________ < x < ________) = _______
Solution解き方
a. Answers may vary.
b. 3.5, 4.25, 0.2441
b. 3.5, 4.25, 0.2441
a. 解答はさまざまである。b. 3.5、4.25、0.2441
Exercise 4問題 4
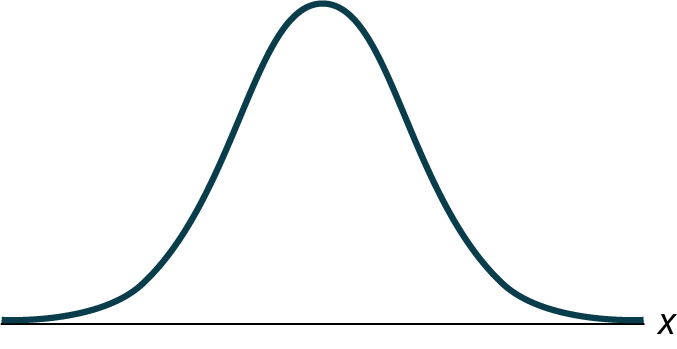
Find the probability that the mean of a month’s reviews will take Yoonie from 3.5 to 4.25 hrs. Sketch the graph, labeling and scaling the horizontal axis. Shade the region corresponding to the probability.
ユーニーの1か月分の評定の平均時間が3.5時間から4.25時間となる確率を求める。グラフの概形を描き、横軸にラベルと目盛りを付ける。求める確率に対応する領域を塗る。
- Figure 7.4図 7.4
- P(________________) = _______


Exercise 5問題 5
What causes the probabilities in Exercise 3 and Exercise 4 to be different?
Solution解き方
The fact that the two distributions are different accounts for the different probabilities.
英語のヒント
2つの分布が異なるため、確率も異なる。
Exercise 6問題 6
Find the 95th percentile for the mean time to complete one month's reviews. Sketch the graph.
1か月分の評定を終えるまでの平均時間について、第95パーセンタイルを求める。グラフの概形を描く。
- Figure 7.5図 7.5
- The 95th Percentile =____________第95パーセンタイル =____________
Homework宿題
Exercises 7–17練習問題 7–17
Exercise 7問題 7
Previously, De Anza statistics students estimated that the amount of change daytime statistics students carry is exponentially distributed with a mean of $0.88. Suppose that we randomly pick 25 daytime statistics students.
英語のヒント
以前、デ・アンザ・カレッジで統計学を学ぶ学生たちは、昼間の統計学の授業を受ける学生が持ち歩く小銭の金額は、平均0.88ドルの指数分布に従うと推定した。昼間の統計学の授業を受ける学生を25人、無作為に選ぶとする。
- In words, Χ = ____________言葉で表すと、Χ = ____________
- Χ ~ _____(_____,_____)
- In words, = ____________言葉で表すと、 = ____________
- ~ ______ (______, ______)
- Find the probability that an individual had between $0.80 and $1.00. Graph the situation, and shade in the area to be determined.1人の持つ金額が0.80ドルから1.00ドルの間にある確率を求める。状況をグラフに表し、求める面積にあたる部分を塗る。
- Find the probability that the average of the 25 students was between $0.80 and $1.00. Graph the situation, and shade in the area to be determined.25人の学生の平均金額が0.80ドルから1.00ドルの間にある確率を求める。状況をグラフに表し、求める面積にあたる部分を塗る。
- Explain why there is a difference in part e and part f.eとfで違いが生じる理由を説明する。
Solution解き方
- Χ = amount of change a student carriesΧ = 学生が持ち歩く小銭の金額
- = average amount of change carried by a sample of 25 sstudents.= 25人の学生の標本が持ち歩く小銭の平均金額。
- ~ N(0.88, 0.176)
- 0.0819
- 0.4276
- The distributions are different. Part e asks about the probability for an individual and part f asks about the probability of the mean value for a sample of 25.分布が異なる。eは1人についての確率を尋ね、fは25人の標本の平均値についての確率を尋ねている。
Exercise 8問題 8
Suppose that the distance of fly balls hit to the outfield (in baseball) is normally distributed with a mean of 250 feet and a standard deviation of 50 feet. We randomly sample 49 fly balls.
英語のヒント
野球で外野に打ち上げたフライの飛距離は、平均250フィート、標準偏差50フィートの正規分布に従うとする。49本のフライを無作為に抽出する。
- If = average distance in feet for 49 fly balls, then ~ _______(_______,_______)= 49本のフライの平均飛距離(フィート)とすると、 ~ _______(_______,_______)
- What is the probability that the 49 balls traveled an average of less than 240 feet? Sketch the graph. Scale the horizontal axis for . Shade the region corresponding to the probability. Find the probability.49本の打球の平均飛距離が240フィート未満となる確率はいくつか。グラフの概形を描く。の横軸に目盛りを付ける。確率に対応する領域を塗り、確率を求める。
- Find the 80th percentile of the distribution of the average of 49 fly balls.49本のフライの平均飛距離の分布について、第80パーセンタイルを求める。
Exercise 9問題 9
According to the Internal Revenue Service, the average length of time for an individual to complete (keep records for, learn, prepare, copy, assemble, and send) IRS Form 1040 is 10.53 hours (without any attached schedules). The distribution is unknown. Let us assume that the standard deviation is two hours. Suppose we randomly sample 36 taxpayers.
英語のヒント
米国内国歳入庁(IRS)によると、個人がIRSの書式1040を完成させるまでの平均時間は、付属の別表がない場合、10.53時間である。これには、記録の保存、学習、作成、複写、取りまとめ、送付が含まれる。分布は未知である。標準偏差を2時間と仮定する。納税者36人を無作為に抽出するとする。
- In words, Χ = _____________言葉で表すと、Χ = _____________
- In words, = _____________言葉で表すと、 = _____________
- ~ _____(_____,_____)
- Would you be surprised if the 36 taxpayers finished their Form 1040s in an average of more than 12 hours? Explain why or why not in complete sentences.36人の納税者が書式1040を完成させるのに、平均12時間を超える時間がかかったら驚くか。驚く、または驚かない理由を、完全な文で説明する。
- Would you be surprised if one taxpayer finished their Form 1040 in more than 12 hours? In a complete sentence, explain why.1人の納税者が書式1040を完成させるのに12時間を超える時間がかかったら驚くか。完全な文で理由を説明する。
Solution解き方
- length of time for an individual to complete IRS form 1040, in hours.個人がIRSの書式1040を完成させるまでの時間(時間単位)。
- mean length of time for a sample of 36 taxpayers to complete IRS form 1040, in hours.36人の納税者の標本がIRSの書式1040を完成させるまでの平均時間(時間単位)。
- N
- Yes. I would be surprised, because the probability is almost 0.はい。確率がほぼ0なので、驚くだろう。
- No. I would not be totally surprised because the probability is 0.2312いいえ。確率は0.2312なので、それほど驚かないだろう。
Exercise 10問題 10
Suppose that a category of world-class runners are known to run a marathon (26 miles) in an average of 145 minutes with a standard deviation of 14 minutes. Consider 49 of the races. Let the average of the 49 races.
ある種目の世界級のランナーがマラソン(26マイル)を走る時間は、平均145分、標準偏差14分であることが分かっているとする。49レースについて考える。をその49レースの平均とする。
- ~ _____(_____,_____)
- Find the probability that the runner will average between 142 and 146 minutes in these 49 marathons.この49回のマラソンで、ランナーの平均時間が142分から146分の間にある確率を求める。
- Find the 80th percentile for the average of these 49 marathons.この49回のマラソンの平均について、第80パーセンタイルを求める。
- Find the median of the average running times.平均走行時間の中央値を求める。
Exercise 11問題 11
The length of songs in a collector’s Apple Music album collection is uniformly distributed from two to 3.5 minutes. Suppose we randomly pick five albums from the collection. There are a total of 43 songs on the five albums.
ある収集家のApple Musicのアルバム集に含まれる曲の長さは、2分から3.5分の一様分布に従う。このコレクションからアルバム5枚を無作為に選ぶとする。5枚のアルバムには合わせて43曲が含まれている。
- In words, Χ = _________言葉で表すと、Χ = _________
- Χ ~ _____________
- In words, = _____________言葉で表すと、 = _____________
- ~ _____(_____,_____)
- Find the first quartile for the average song length, .曲の平均の長さの第1四分位数を求める。
- The IQR (interquartile range) for the average song length, , is from ___ - ___.曲の平均の長さのIQR(四分位範囲)は、___から___までである。
Solution解き方
- the length of a song, in minutes, in the collectionコレクションに含まれる1曲の長さ(分単位)
- U(2, 3.5)
- the average length, in minutes, of the songs from a sample of five albums from the collectionコレクションから選んだアルバム5枚の標本に含まれる曲の平均の長さ(分単位)
- N(2.75, 0.0660)
- 2.71 minutes2.71分
- 0.09 minutes0.09分
Exercise 12問題 12
In 1940 the average size of a U.S. farm was 174 acres. Let’s say that the standard deviation was 55 acres. Suppose we randomly survey 38 farmers from 1940.
1940年の米国の農場の平均面積は174エーカーであった。標準偏差を55エーカーとする。1940年の農家38軒を無作為に調査するとする。
- In words, Χ = _____________言葉で表すと、Χ = _____________
- In words, = _____________言葉で表すと、 = _____________
- ~ _____(_____,_____)
- The IQR for is from _______ acres to _______ acres.のIQRは、_______エーカーから_______エーカーまでである。
Exercise 13問題 13
Determine which of the following are true and which are false. Then, in complete sentences, justify your answers.
英語のヒント
次の各記述について、正しいものと誤っているものを判定する。その後、完全な文で解答の理由を示す。
- When the sample size is large, the mean of is approximately equal to the mean of Χ.標本の大きさが大きいと、の平均はΧの平均にほぼ等しい。
- When the sample size is large, is approximately normally distributed.標本の大きさが大きいと、は近似的に正規分布に従う。
- When the sample size is large, the standard deviation of is approximately the same as the standard deviation of Χ.標本の大きさが大きいと、の標準偏差はΧの標準偏差とほぼ同じである。
Solution解き方
- True. The mean of a sampling distribution of the means is approximately the mean of the data distribution.正しい。平均の標本分布の平均は、データの分布の平均にほぼ等しい。
- True. According to the Central Limit Theorem, the larger the sample, the closer the sampling distribution of the means becomes normal.
英語のヒント
正しい。中心極限定理によると、標本が大きいほど、平均の標本分布は正規分布に近づく。 - False. The standard deviation of the sample distribution of the means will decrease as the sample size increases; however, the standard deviation of the sample distribution of the means will not equal the standard deviation of X.誤り。平均の標本分布の標準偏差は、標本の大きさが増すにつれて小さくなる。しかし、平均の標本分布の標準偏差がXの標準偏差に等しくなるわけではない。
Exercise 14問題 14
The percent of fat calories that a person in America consumes each day is normally distributed with a mean of about 36 and a standard deviation of about ten. Suppose that 16 individuals are randomly chosen. Let = average percent of fat calories.
英語のヒント
米国の個人が1日に摂取するカロリーのうち、脂肪からのカロリーが占める割合(%)は、平均約36、標準偏差約10の正規分布に従う。16人を無作為に選ぶとする。 = 脂肪からのカロリーの平均割合とする。
- ~ ______(______, ______)
- For the group of 16, find the probability that the average percent of fat calories consumed is more than five. Graph the situation and shade in the area to be determined.16人のグループについて、摂取する脂肪由来カロリーの平均割合が5%を超える確率を求める。状況をグラフに表し、求める面積にあたる部分を塗る。
- Find the first quartile for the average percent of fat calories.脂肪由来カロリーの平均割合の第1四分位数を求める。
Exercise 15問題 15
The distribution of income in some developing countries is considered wedge shaped (many low income people, very few middle income people, and even fewer high income people). Suppose we pick a country with a wedge shaped distribution. Let the average salary be $2,000 per year with a standard deviation of $8,000. We randomly survey 1,000 residents of that country.
英語のヒント
一部の発展途上国の所得分布は、くさび形であると考えられている。低所得者が多く、中所得者はごく少なく、高所得者はさらに少ない。くさび形の分布を持つ国を1つ選ぶとする。平均年収を2,000ドル、標準偏差を8,000ドルとする。その国の住民1,000人を無作為に調査する。
- In words, Χ = _____________言葉で表すと、Χ = _____________
- In words, = _____________言葉で表すと、 = _____________
- ~ _____(_____,_____)
- How is it possible for the standard deviation to be greater than the average?
英語のヒント
標準偏差が平均より大きくなることがあるのは、なぜか。 - Why is it more likely that the average of the 1,000 residents will be from $2,000 to $2,100 than from $2,100 to $2,200?1,000人の住民の平均が2,100ドルから2,200ドルの間になるより、2,000ドルから2,100ドルの間になるほうが起こりやすいのは、なぜか。
Solution解き方
- X = the yearly income of someone in a developing countryX = 発展途上国に住むある人の年収
- the average salary from samples of 1,000 residents of a developing country発展途上国の住民1,000人の標本における平均年収
- ∼ N
- Very wide differences in data values can have averages smaller than standard deviations.データの値に非常に大きな差があると、平均が標準偏差より小さくなることがある。
- The distribution of the sample mean will have higher probabilities closer to the population mean.
P(2000 < < 2100) = 0.1537
P(2100 < < 2200) = 0.1317標本平均の分布では、母平均に近いほど確率が高くなる。P(2000 < < 2100) = 0.1537。P(2100 < < 2200) = 0.1317。
Exercise 16問題 16
Which of the following is NOT TRUE about the distribution for averages?
平均の分布について、次のうち正しくないものはどれか。
- The mean, median, and mode are equal.
英語のヒント
平均、中央値、最頻値が等しい。 - The area under the curve is one.曲線の下の面積は1である。
- The curve never touches the x-axis.曲線がx軸に接することはない。
- The curve is skewed to the right.
英語のヒント
曲線は右に歪んでいる。
Exercise 17問題 17
The cost of unleaded gasoline in the Bay Area once followed an unknown distribution with a mean of $4.59 and a standard deviation of $0.10. Sixteen gas stations from the Bay Area are randomly chosen. We are interested in the average cost of gasoline for the 16 gas stations. The distribution to use for the average cost of gasoline for the 16 gas stations is:
英語のヒント
ある時期のベイエリアの無鉛ガソリン価格は、平均4.59ドル、標準偏差0.10ドルの未知の分布に従っていた。ベイエリアのガソリンスタンド16店を無作為に選ぶ。この16店のガソリン平均価格に関心がある。16店のガソリン平均価格について使う分布は、次のどれか:
- ~ N(4.59, 0.10)
- ~ N
- ~ N
- ~ N
Solution解き方
b
Average
平均
a number that describes the central tendency of the data; there are a number of specialized averages, including the arithmetic mean, weighted mean, median, mode, and geometric mean.
英語のヒント
データの中心的な傾向を表す数値。算術平均、加重平均、中央値、最頻値、幾何平均など、特定の目的に応じたさまざまな平均がある。
Central Limit Theorem
中心極限定理
Given a random variable (RV) with known mean μ and known standard deviation, σ, we are sampling with size n, and we are interested in two new RVs: the sample mean, , and the sample sum, ΣΧ. If the size (n) of the sample is sufficiently large, then ~ N(μ, ) and ΣΧ ~ N(nμ, ()(σ)). If the size (n) of the sample is sufficiently large, then the distribution of the sample means and the distribution of the sample sums will approximate a normal distributions regardless of the shape of the population. The mean of the sample means will equal the population mean, and the mean of the sample sums will equal n times the population mean. The standard deviation of the distribution of the sample means, , is called the standard error of the mean.
平均μと標準偏差σが既知の確率変数(RV)があり、大きさnの標本を抽出するとする。ここでは、標本平均と標本の和ΣΧという2つの新たな確率変数を考える。標本の大きさnが十分大きければ、 ~ N(μ, )、ΣΧ ~ N(nμ, ()(σ))となる。標本の大きさnが十分大きければ、母集団の形によらず、標本平均の分布と標本の和の分布は正規分布に近づく。標本平均の平均は母平均に等しく、標本の和の平均は母平均のn倍に等しい。標本平均の分布の標準偏差を、平均の標準誤差という。
Normal Distribution
正規分布
a continuous random variable (RV) with pdf , where μ is the mean of the distribution and σ is the standard deviation; notation: Χ ~ N(μ, σ). If μ = 0 and σ = 1, the RV is called a standard normal distribution.
確率密度関数がである連続確率変数。ここでμは分布の平均、σは標準偏差である。表記はΧ ~ N(μ, σ)。μ = 0、σ = 1のとき、この確率変数の分布を標準正規分布という。
Standard Error of the Mean
平均の標準誤差
the standard deviation of the distribution of the sample means, or .
標本平均の分布の標準偏差、すなわち。