第14章酸塩基平衡
Acid-Base Indicators酸塩基指示薬
Certain organic substances change color in dilute solution when the hydronium ion concentration reaches a particular value. For example, phenolphthalein is a colorless substance in any aqueous solution with a hydronium ion concentration greater than 5.0 10−9 M (pH < 8.3). In more basic solutions where the hydronium ion concentration is less than 5.0 10−9 M (pH > 8.3), it is red or pink. Substances such as phenolphthalein, which can be used to determine the pH of a solution, are called acid-base indicators. Acid-base indicators are either weak organic acids or weak organic bases.
英語のヒント
ある種の有機物は、希薄溶液中のオキソニウムイオン濃度が特定の値に達すると色を変える。例えば、フェノールフタレインは、オキソニウムイオン濃度が5.0 10−9 Mより大きい水溶液(pH < 8.3)では無色である。より塩基性の強い、オキソニウムイオン濃度が5.0 10−9 M未満の溶液(pH > 8.3)では、赤色または桃色になる。フェノールフタレインのように、溶液のpHを求めるために使える物質を、酸塩基指示薬という。酸塩基指示薬は、弱い有機酸または弱い有機塩基である。
The equilibrium in a solution of the acid-base indicator methyl orange, a weak acid, can be represented by an equation in which we use HIn as a simple representation for the complex methyl orange molecule:
弱酸である酸塩基指示薬メチルオレンジの溶液中の平衡は、複雑なメチルオレンジ分子をHInと略記すると、次の式で表せる。
The anion of methyl orange, In−, is yellow, and the nonionized form, HIn, is red. When we add acid to a solution of methyl orange, the increased hydronium ion concentration shifts the equilibrium toward the nonionized red form, in accordance with Le Châtelier’s principle. If we add base, we shift the equilibrium towards the yellow form. This behavior is completely analogous to the action of buffers.
英語のヒント
メチルオレンジの陰イオンIn−は黄色で、電離していない形のHInは赤色である。メチルオレンジ溶液に酸を加えると、オキソニウムイオン濃度が上昇し、ルシャトリエの原理に従って、平衡は電離していない赤色の形のほうへ移動する。塩基を加えると、平衡は黄色の形のほうへ移動する。このふるまいは、緩衝液の働きとまったく同様である。
The perceived color of an indicator solution is determined by the ratio of the concentrations of the two species In− and HIn. If most of the indicator (typically about 60−90% or more) is present as In−, the perceived color of the solution is yellow. If most is present as HIn, then the solution color appears red. The Henderson-Hasselbalch equation is useful for understanding the relationship between the pH of an indicator solution and its composition (thus, perceived color):
英語のヒント
指示薬溶液の見た目の色は、In−とHInという二つの化学種の濃度比で決まる。指示薬の大部分(通常は約60~90%以上)がIn−として存在すれば、溶液は黄色に見える。大部分がHInとして存在すれば赤色に見える。指示薬溶液のpHと組成(したがって見た目の色)の関係を理解するには、ヘンダーソン–ハッセルバルヒの式が役立つ。
In solutions where pH > pKa, the logarithmic term must be positive, indicating an excess of the conjugate base form of the indicator (yellow solution). When pH < pKa, the log term must be negative, indicating an excess of the conjugate acid (red solution). When the solution pH is close to the indicator pKa, appreciable amounts of both conjugate partners are present, and the solution color is that of an additive combination of each (yellow and red, yielding orange). The color change interval (or pH interval) for an acid-base indicator is defined as the range of pH values over which a change in color is observed, and for most indicators this range is approximately pKa ± 1.
英語のヒント
pH > pKaの溶液では、対数の項は正でなければならず、指示薬の共役塩基の形が多いことを示す(黄色の溶液)。pH < pKaでは対数の項は負で、共役酸のほうが多いことを示す(赤色の溶液)。pHが指示薬のpKaに近いときは、共役対の両方が十分な量だけ存在し、溶液はそれぞれの色を足し合わせた色になる(黄色と赤色から橙色が生じる)。酸塩基指示薬の変色域(またはpH変色域)は、色の変化が観察されるpHの範囲と定義され、多くの指示薬ではおよそpKa ± 1である。
There are many different acid-base indicators that cover a wide range of pH values and can be used to determine the approximate pH of an unknown solution by a process of elimination. Universal indicators and pH paper contain a mixture of indicators and exhibit different colors at different pHs. Figure 14.19 presents several indicators, their colors, and their color-change intervals.
英語のヒント
広いpH範囲に対応する多くの酸塩基指示薬があり、消去法で未知の溶液のおおよそのpHを求めるために使える。万能指示薬やpH試験紙には、複数の指示薬が混合されており、pHごとに異なる色を示す。図14.19に、いくつかの指示薬、その色、変色域を示す。
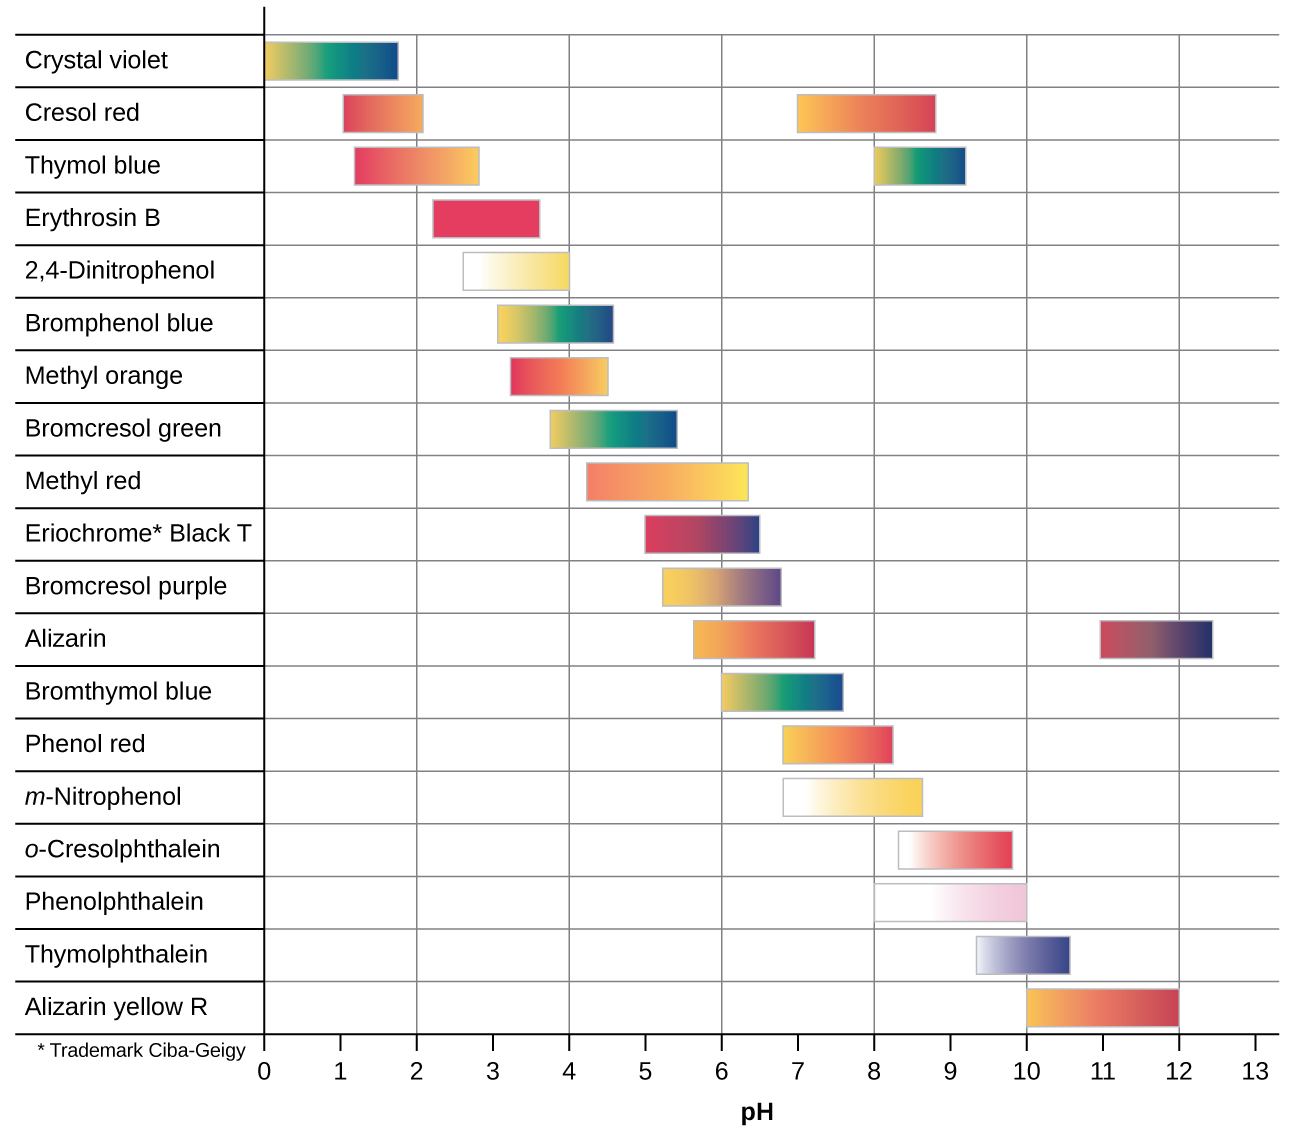
Figure 14.19図 14.19
This chart illustrates the color change intervals for several acid-base indicators.
いくつかの酸塩基指示薬の変色域を示す。
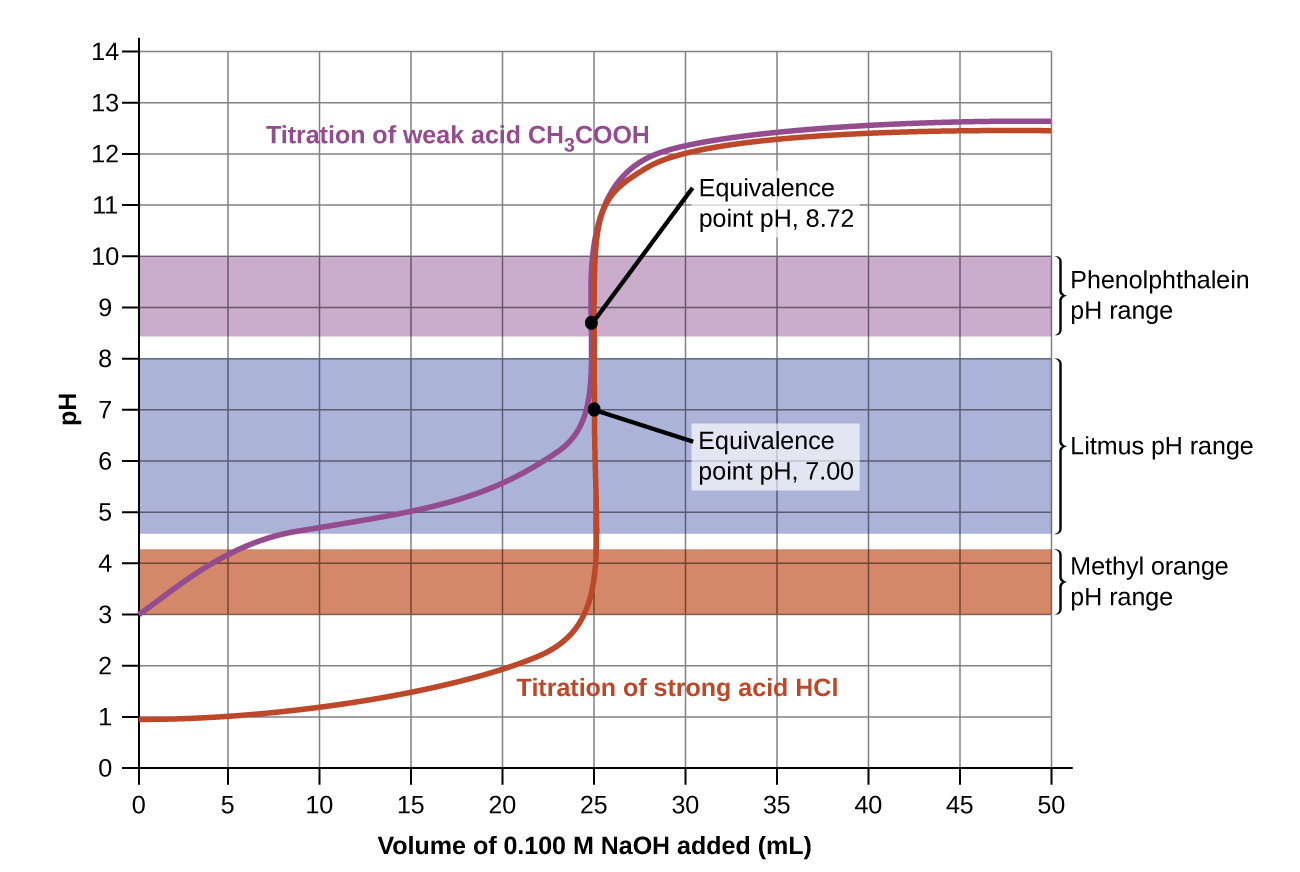


Figure 14.20図 14.20
Titration curves for strong and weak acids illustrating the proper choice of acid-base indicator. Any of the three indicators will exhibit a reasonably sharp color change at the equivalence point of the strong acid titration, but only phenolphthalein is suitable for use in the weak acid titration.
酸塩基指示薬の適切な選択を示す、強酸と弱酸の滴定曲線。強酸の滴定では3種類のどの指示薬も当量点で比較的明瞭に変色するが、弱酸の滴定に適しているのはフェノールフタレインだけである。
The titration curves shown in Figure 14.20 illustrate the choice of a suitable indicator for specific titrations. In the strong acid titration, use of any of the three indicators should yield reasonably sharp color changes and accurate end point determinations. For this titration, the solution pH reaches the lower limit of the methyl orange color change interval after addition of ~24 mL of titrant, at which point the initially red solution would begin to appear orange. When 25 mL of titrant has been added (the equivalence point), the pH is well above the upper limit and the solution will appear yellow. The titration's end point may then be estimated as the volume of titrant that yields a distinct orange-to-yellow color change. This color change would be challenging for most human eyes to precisely discern. More-accurate estimates of the titration end point are possible using either litmus or phenolphthalein, both of which exhibit color change intervals that are encompassed by the steep rise in pH that occurs around the 25.00 mL equivalence point.
英語のヒント
図14.20の滴定曲線は、特定の滴定に適した指示薬の選び方を示している。強酸の滴定では、3種類のどの指示薬を使っても、比較的明瞭な変色が起こり、終点を正確に求められるはずである。この滴定では、滴定液を約24 mL加えると溶液のpHがメチルオレンジの変色域の下限に達し、最初は赤かった溶液が橙色に見え始める。25 mL加えると(当量点)、pHは変色域の上限を十分に超え、溶液は黄色に見える。そこで、橙色から黄色への明瞭な変化が生じる滴定液の体積を、滴定の終点と見積もれる。しかし、この色の変化を人の目で正確に識別するのは、たいてい難しい。リトマスかフェノールフタレインを使えば、終点をより正確に見積もれる。両方の変色域が、25.00 mLの当量点付近で生じる急激なpH上昇の範囲に含まれるためである。
The weak acid titration curve in Figure 14.20 shows that only one of the three indicators is suitable for end point detection. If methyl orange is used in this titration, the solution will undergo a gradual red-to-orange-to-yellow color change over a relatively large volume interval (0–6 mL), completing the color change well before the equivalence point (25 mL) has been reached. Use of litmus would show a color change that begins after adding 7–8 mL of titrant and ends just before the equivalence point. Phenolphthalein, on the other hand, exhibits a color change interval that nicely brackets the abrupt change in pH occurring at the titration's equivalence point. A sharp color change from colorless to pink will be observed within a very small volume interval around the equivalence point.
英語のヒント
図14.20の弱酸の滴定曲線を見ると、3種類の指示薬のうち、終点検出に適しているのは一つだけである。この滴定でメチルオレンジを使うと、比較的広い体積範囲(0~6 mL)にわたって溶液の色が赤から橙、黄色へと徐々に変わり、当量点(25 mL)に達するずっと前に変色が完了する。リトマスでは、滴定液を7~8 mL加えた後に変色が始まり、当量点の直前に終わる。これに対して、フェノールフタレインの変色域は、当量点での急激なpH変化をうまく挟み込んでいる。当量点付近の非常に狭い体積範囲で、無色から桃色への明瞭な変化が観察される。