第4章一次関数Linear Functions
Writing the Equation for a Function from the Graph of a Line直線のグラフから関数の方程式を書く
Earlier, we wrote the equation for a linear function from a graph. Now we can extend what we know about graphing linear functions to analyze graphs a little more closely. Begin by taking a look at Figure 18. We can see right away that the graph crosses the y-axis at the point so this is the y-intercept.
先にグラフから一次関数の方程式を書いた。ここでは、一次関数のグラフについて学んだことを広げて、グラフをもう少し細かく調べよう。まず図18を見てみる。グラフが点 で y軸と交わることがすぐに分かるので、これが y切片である。
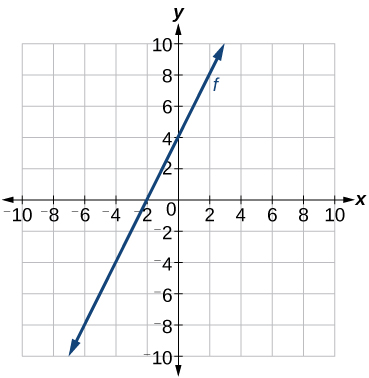
Then we can calculate the slope by finding the rise and run. We can choose any two points, but let’s look at the point To get from this point to the y-intercept, we must move up 4 units (rise) and to the right 2 units (run). So the slope must be
そのうえで、上がりと進みを求めれば傾きを計算できる。どの二点を選んでもよいが、点 を見てみよう。この点から y切片へ行くには、上へ4(上がり)、右へ2(進み)動かなければならない。よって傾きは次のようになる。
Substituting the slope and y-intercept into the slope-intercept form of a line gives
傾きと y切片を直線の傾き切片形に代入すると、次が得られる。
How To 手順
Given a graph of linear function, find the equation to describe the function.
一次関数のグラフが与えられたとき、その関数を述べる方程式を求める。
1. Identify the y-intercept of an equation.2. Choose two points to determine the slope.3. Substitute the y-intercept and slope into the slope-intercept form of a line.
1. 方程式の y切片を見分ける。2. 傾きを決めるために二点を選ぶ。3. y切片と傾きを直線の傾き切片形に代入する。
Example 14例14
Matching Linear Functions to Their Graphs一次関数とそのグラフを対応させる
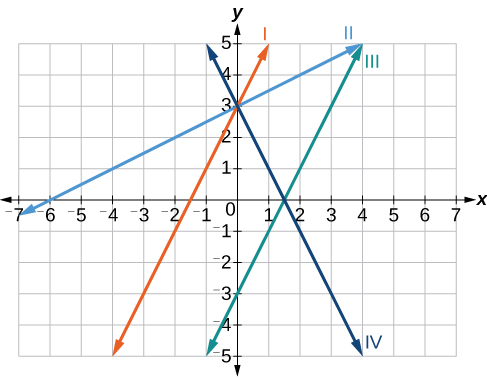
Match each equation of the linear functions with one of the lines in Figure 19.
一次関数の各方程式を、図19の直線のどれかと対応させよ。
Solution 解答
Analyze the information for each function.
それぞれの関数の情報を調べる。
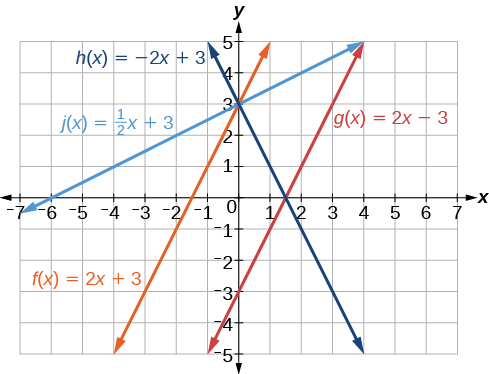
ⓐThis function has a slope of 2 and a y-intercept of 3. It must pass through the point (0, 3) and slant upward from left to right. We can use two points to find the slope, or we can compare it with the other functions listed. Function has the same slope, but a different y-intercept. Lines I and III have the same slant because they have the same slope. Line III does not pass through so must be represented by line I.ⓑThis function also has a slope of 2, but a y-intercept of It must pass through the point and slant upward from left to right. It must be represented by line III.ⓒThis function has a slope of –2 and a y-intercept of 3. This is the only function listed with a negative slope, so it must be represented by line IV because it slants downward from left to right.ⓓThis function has a slope of and a y-intercept of 3. It must pass through the point (0, 3) and slant upward from left to right. Lines I and II pass through but the slope of is less than the slope of so the line for must be flatter. This function is represented by Line II.
ⓐこの関数は傾き2、y切片3である。点 (0, 3) を通り、左から右へ上がるはずである。二点を使って傾きを求めてもよいし、並んだほかの関数と比べてもよい。関数 は傾きが同じだが y切片が違う。直線Iと直線IIIは傾きが同じなので、同じ傾き具合である。直線IIIは を通らないので、 は直線Iで表されるはずである。ⓑこの関数も傾きは2だが、y切片は である。点 を通り、左から右へ上がるはずである。直線IIIで表されるはずである。ⓒこの関数は傾き–2、y切片3である。並んだ関数の中で傾きが負なのはこれだけなので、左から右へ下がる直線IVで表されるはずである。ⓓこの関数は傾き 、y切片3である。点 (0, 3) を通り、左から右へ上がるはずである。直線Iと直線IIは を通るが、 の傾きは の傾きより小さいので、 の直線の方が緩やかなはずである。この関数は直線IIで表される。
Now we can re-label the lines as in Figure 20.
これで図20のように直線に名前を付け直せる。
Finding the x-intercept of a Line直線の x切片を求める
So far we have been finding the y-intercepts of a function: the point at which the graph of the function crosses the y-axis. Recall that a function may also have an x-intercept, which is the x-coordinate of the point where the graph of the function crosses the x-axis. In other words, it is the input value when the output value is zero.
ここまでは関数の y切片、すなわち関数のグラフが y軸と交わる点を求めてきた。関数には x切片もありうることを思い出そう。x切片とは、関数のグラフが x軸と交わる点の x座標である。言い換えると、出力値が0になるときの入力値である。
To find the x-intercept, set a function equal to zero and solve for the value of For example, consider the function shown.
x切片を求めるには、関数 を0とおいて の値について解く。たとえば次の関数を考えよう。
Set the function equal to 0 and solve for
関数を0とおいて について解く。
The graph of the function crosses the x-axis at the point
この関数のグラフは点 で x軸と交わる。
Q&A 疑問と答え
Do all linear functions have x-intercepts?
一次関数にはすべて x切片があるか。
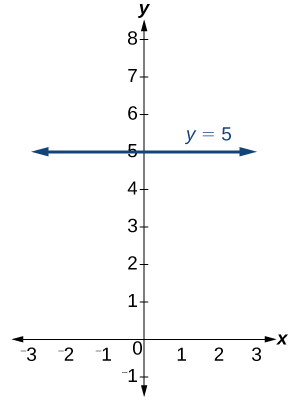
No. However, linear functions of the form where is a nonzero real number are the only examples of linear functions with no x-intercept. For example, is a horizontal line 5 units above the x-axis. This function has no x-intercepts, as shown in Figure 21.
無い。ただし x切片を持たない一次関数は、 を0でない実数とする の形のものだけである。たとえば は x軸より5上にある横の直線である。図21のように、この関数に x切片は無い。
x-interceptx切片
The x-intercept of the function is value of when It can be solved by the equation
関数の x切片とは、 のときの の値である。方程式 を解けば求まる。
Example 15例15
Finding an x-interceptx切片を求める
Find the x-intercept of
の x切片を求めよ。
Solution 解答
Set the function equal to zero to solve for
関数を0とおいて について解く。
The graph crosses the x-axis at the point
グラフは点 で x軸と交わる。
Analysis 考察
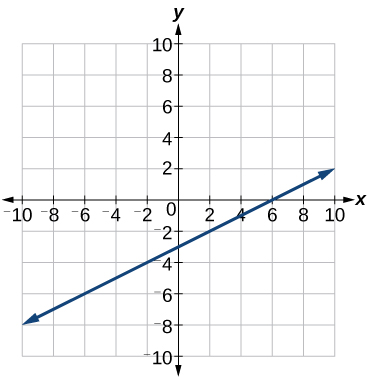
A graph of the function is shown in Figure 22. We can see that the x-intercept is as we expected.
この関数のグラフを図22に示す。見込みどおり x切片が であることが分かる。
Try It #8やってみよう8
Find the x-intercept of
の x切片を求めよ。
Describing Horizontal and Vertical Lines横の直線と縦の直線を述べる
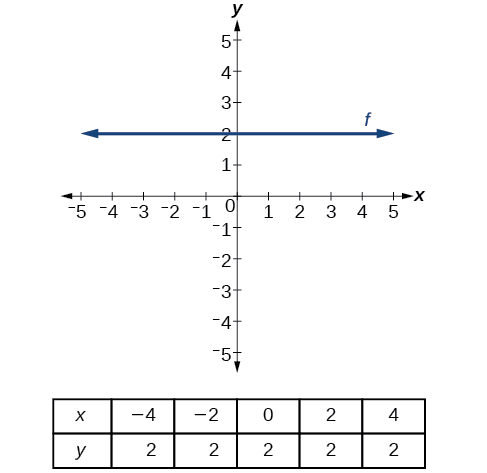
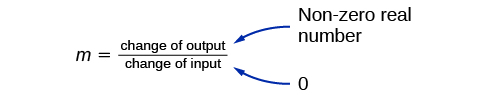
There are two special cases of lines on a graph—horizontal and vertical lines. A horizontal line indicates a constant output, or y-value. In Figure 23, we see that the output has a value of 2 for every input value. The change in outputs between any two points, therefore, is 0. In the slope formula, the numerator is 0, so the slope is 0. If we use in the equation the equation simplifies to In other words, the value of the function is a constant. This graph represents the function
グラフ上の直線には、横の直線と縦の直線という特別な場合が二つある。横の直線は、出力すなわち y の値が一定であることを示す。図23では、どの入力値でも出力の値が2であることが分かる。よってどの二点のあいだでも出力の変化は0である。傾きの公式では分子が0になるので、傾きは0である。方程式 で を使うと、方程式は に簡単になる。言い換えると、この関数の値は定数である。このグラフは関数 を表す。
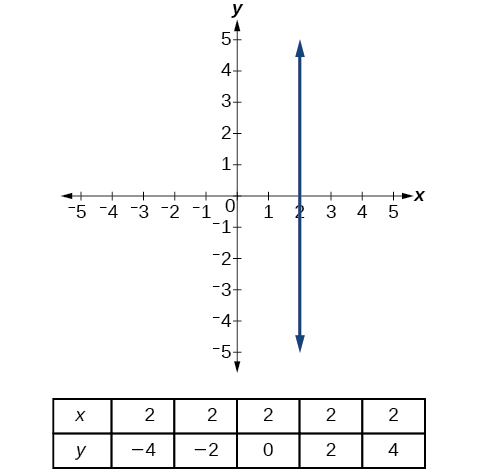
A vertical line indicates a constant input, or x-value. We can see that the input value for every point on the line is 2, but the output value varies. Because this input value is mapped to more than one output value, a vertical line does not represent a function. Notice that between any two points, the change in the input values is zero. In the slope formula, the denominator will be zero, so the slope of a vertical line is undefined.
縦の直線は、入力すなわち x の値が一定であることを示す。直線上のどの点でも入力値は2だが、出力値は変わることが分かる。この入力値が二つ以上の出力値に対応するので、縦の直線は関数を表さない。どの二点のあいだでも入力値の変化が0であることに注意せよ。傾きの公式では分母が0になるので、縦の直線の傾きは定義されない。
A vertical line, such as the one in Figure 25, has an x-intercept, but no y-intercept unless it’s the line This graph represents the line
図25のような縦の直線には x切片があるが、 の直線でない限り y切片は無い。このグラフは直線 を表す。
Horizontal and Vertical Lines 水平線と鉛直線
Lines can be horizontal or vertical.
直線は横にも縦にもなりうる。
A horizontal line is a line defined by an equation in the form
横の直線とは、 の形の方程式で定まる直線である。
A vertical line is a line defined by an equation in the form
縦の直線とは、 の形の方程式で定まる直線である。
Example 16例16
Writing the Equation of a Horizontal Line横の直線の方程式を書く
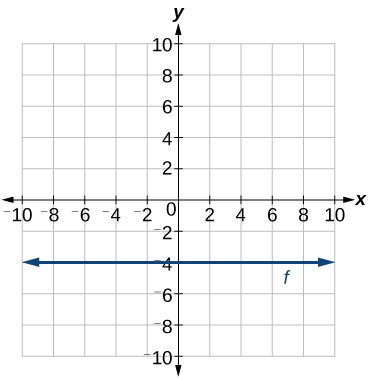
Write the equation of the line graphed in Figure 26.
図26に描かれた直線の方程式を書け。
Solution 解答
For any x-value, the y-value is so the equation is
どの x の値でも y の値は なので、方程式は である。
Example 17例17
Writing the Equation of a Vertical Line縦の直線の方程式を書く
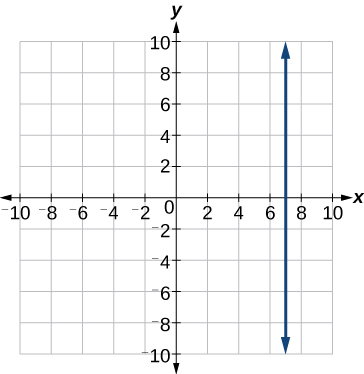
Write the equation of the line graphed in Figure 27.
図27に描かれた直線の方程式を書け。
Solution 解答
The constant x-value is so the equation is
一定の x の値は なので、方程式は である。