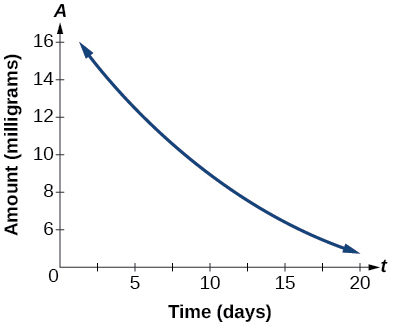
第3章関数Functions
3.3 Rates of Change and Behavior of Graphs3.3 変化の割合とグラフの特徴
Learning Objectives 学習目標
In this section, you will:
この節を終えると、次のことができるようになる。
• Find the average rate of change of a function.• Use a graph to determine where a function is increasing, decreasing, or constant.• Use a graph to locate local maxima and local minima.• Use a graph to locate the absolute maximum and absolute minimum.
・関数の平均変化率を求める。・グラフを使って、関数が増加・減少・一定のどこであるかを決める。・グラフを使って極大と極小の場所を見つける。・グラフを使って最大値と最小値の場所を見つける。
Gasoline costs have experienced some wild fluctuations over the last several decades. Table 15 lists the average cost, in dollars, of a gallon of gasoline for the years 2005–2012. The cost of gasoline can be considered as a function of year.
ガソリンの値段は、ここ数十年で激しく上下してきた。表15に、2005年から2012年までのガソリン1ガロンあたりの平均価格(ドル)を並べる。ガソリンの値段は年の関数とみなせる。
. Accessed 3/5/2014.
閲覧日:2014年3月5日。
| 2005 | 2006 | 2007 | 2008 | 2009 | 2010 | 2011 | 2012 | |
| 2.31 | 2.62 | 2.84 | 3.30 | 2.41 | 2.84 | 3.58 | 3.68 |
If we were interested only in how the gasoline prices changed between 2005 and 2012, we could compute that the cost per gallon had increased from $2.31 to $3.68, an increase of $1.37. While this is interesting, it might be more useful to look at how much the price changed per year. In this section, we will investigate changes such as these.
2005年から2012年のあいだにガソリンの値段がどう変わったかだけに関心があるなら、1ガロンあたり2.31ドルから3.68ドルへ、1.37ドル上がったと計算できる。これはこれで面白いが、1年あたりどれだけ値段が変わったかを見る方が役に立つかもしれない。この節では、こうした変化を調べる。
Finding the Average Rate of Change of a Function関数の平均変化率を求める
The price change per year is a rate of change because it describes how an output quantity changes relative to the change in the input quantity. We can see that the price of gasoline in Table 1 did not change by the same amount each year, so the rate of change was not constant. If we use only the beginning and ending data, we would be finding the average rate of change over the specified period of time. To find the average rate of change, we divide the change in the output value by the change in the input value.
1年あたりの値段の変化は変化の割合である。入力の量の変化に対して出力の量がどう変わるかを表しているからである。表1のガソリンの値段は毎年同じだけ変わってはいないので、変化の割合は一定ではなかった。始めと終わりの値だけを使えば、その期間にわたる平均変化率を求めることになる。平均変化率を求めるには、出力値の変化を入力値の変化で割る。
The Greek letter (delta) signifies the change in a quantity; we read the ratio as “delta-y over delta-x” or “the change in divided by the change in ” Occasionally we write instead of which still represents the change in the function’s output value resulting from a change to its input value. It does not mean we are changing the function into some other function.
ギリシア文字の (デルタ)は量の変化を表す。この比は「デルタyわるデルタx」または「 の変化を の変化で割ったもの」と読む。ときには の代わりに と書くこともあるが、これも入力値の変化によって生じる関数の出力値の変化を表している。関数を別の関数に変えるという意味ではない。
In our example, the gasoline price increased by $1.37 from 2005 to 2012. Over 7 years, the average rate of change was
先の例では、2005年から2012年にかけてガソリンの値段が1.37ドル上がった。7年にわたる平均変化率は次のとおりである。
On average, the price of gas increased by about 19.6¢ each year.
平均すると、ガソリンの値段は毎年およそ19.6セント上がった。
Other examples of rates of change include:
変化の割合のほかの例を挙げる。
• A population of rats increasing by 40 rats per week• A car traveling 68 miles per hour (distance traveled changes by 68 miles each hour as time passes)• A car driving 27 miles per gallon (distance traveled changes by 27 miles for each gallon)• The current through an electrical circuit increasing by 0.125 amperes for every volt of increased voltage• The amount of money in a college account decreasing by $4,000 per quarter
・ねずみの個体数が週に40匹ずつ増える・自動車が時速68マイルで進む(時が経つにつれ、進んだ距離が1時間ごとに68マイルずつ変わる)・自動車が1ガロンあたり27マイル走る(1ガロンごとに進んだ距離が27マイルずつ変わる)・電気回路を流れる電流が、電圧が1ボルト上がるごとに0.125アンペアずつ増える・大学の口座の残高が四半期ごとに4,000ドルずつ減る
Rate of Change 変化率
A rate of change describes how an output quantity changes relative to the change in the input quantity. The units on a rate of change are “output units per input units.”
変化の割合とは、入力の量の変化に対して出力の量がどう変わるかを表すものである。変化の割合の単位は「入力の単位あたりの出力の単位」である。
The average rate of change between two input values is the total change of the function values (output values) divided by the change in the input values.
二つの入力値のあいだの平均変化率とは、関数の値(出力値)の変化の総量を、入力値の変化で割ったものである。
How To 手順
Given the value of a function at different points, calculate the average rate of change of a function for the interval between two values and
いくつかの点での関数の値が与えられたとき、二つの値 と のあいだの区間について、関数の平均変化率を計算する。
1. Calculate the difference 2. Calculate the difference 3. Find the ratio
1. 差 を計算する。2. 差 を計算する。3. 比 を求める。
Example 1例1
Computing an Average Rate of Change平均変化率を計算する
Using the data in Table 1, find the average rate of change of the price of gasoline between 2007 and 2009.
表1の資料を使って、2007年から2009年にかけてのガソリンの値段の平均変化率を求めよ。
Solution 解答
In 2007, the price of gasoline was $2.84. In 2009, the cost was $2.41. The average rate of change is
2007年のガソリンの値段は2.84ドルだった。2009年は2.41ドルだった。平均変化率は次のとおりである。
Analysis 考察
Note that a decrease is expressed by a negative change or “negative increase.” A rate of change is negative when the output decreases as the input increases or when the output increases as the input decreases.
減少は負の変化、すなわち「負の増加」として表されることに注意せよ。入力が増えるにつれて出力が減るとき、または入力が減るにつれて出力が増えるとき、変化の割合は負になる。
Try It #1やってみよう1
Using the data in Table 1, find the average rate of change between 2005 and 2010.
表1の資料を使って、2005年から2010年にかけての平均変化率を求めよ。
Example 2例2
Computing Average Rate of Change from a Graphグラフから平均変化率を計算する
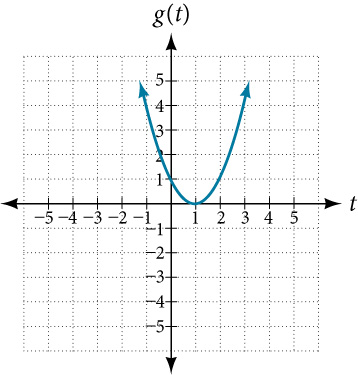
Given the function shown in Figure 1, find the average rate of change on the interval
図1に示した関数 について、区間 での平均変化率を求めよ。
Solution 解答
At Figure 2 shows At the graph shows
図2から、 では である。 では、グラフから である。
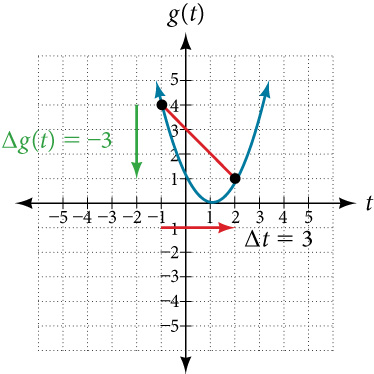
The horizontal change is shown by the red arrow, and the vertical change is shown by the turquoise arrow. The average rate of change is shown by the slope of the orange line segment. The output changes by –3 while the input changes by 3, giving an average rate of change of
横の変化 を赤い矢で、縦の変化 を青緑の矢で示す。平均変化率は橙の線分の傾きとして示される。入力が3変わるあいだに出力が–3変わるので、平均変化率は次のようになる。
Analysis 考察
Note that the order we choose is very important. If, for example, we use we will not get the correct answer. Decide which point will be 1 and which point will be 2, and keep the coordinates fixed as and
どちらを先にとるかがとても大事であることに注意せよ。たとえば としてしまうと、正しい答えにならない。どちらの点を1、どちらを2とするかを決めたら、座標を と のまま固定しておくこと。
Example 3例3
Computing Average Rate of Change from a Table表から平均変化率を計算する
After picking up a friend who lives 10 miles away and leaving on a trip, Anna records her distance from home over time. The values are shown in Table 2. Find her average speed over the first 6 hours.
10マイル先に住む友人を拾って旅に出た後、Anna は家からの距離を時間とともに記録した。その値を表2に示す。最初の6時間の平均の速さを求めよ。
| t (hours)t(時) | 0 | 1 | 2 | 3 | 4 | 5 | 6 | 7 |
| D(t) (miles)D(t)(マイル) | 10 | 55 | 90 | 153 | 214 | 240 | 292 | 300 |
Solution 解答
Here, the average speed is the average rate of change. She traveled 282 miles in 6 hours.
ここでは平均の速さが平均変化率である。彼女は6時間で282マイル進んだ。
The average speed is 47 miles per hour.
平均の速さは時速47マイルである。
Analysis 考察
Because the speed is not constant, the average speed depends on the interval chosen. For the interval [2,3], the average speed is 63 miles per hour.
速さは一定ではないので、平均の速さは選んだ区間によって変わる。区間 [2,3] では平均の速さは時速63マイルである。
Example 4例4
Computing Average Rate of Change for a Function Expressed as a Formula式で表された関数の平均変化率を計算する
Compute the average rate of change of on the interval
区間 での の平均変化率を計算せよ。
Solution 解答
We can start by computing the function values at each endpoint of the interval.
まず区間の両端での関数の値を計算するところから始められる。
Now we compute the average rate of change.
ここで平均変化率を計算する。
Try It #2やってみよう2
Find the average rate of change of on the interval
区間 での の平均変化率を求めよ。
Example 5例5
Finding the Average Rate of Change of a Force力の平均変化率を求める
The electrostatic force measured in newtons, between two charged particles can be related to the distance between the particles in centimeters, by the formula Find the average rate of change of force if the distance between the particles is increased from 2 cm to 6 cm.
帯電した二つの粒子のあいだにはたらく静電気力 (ニュートン)は、粒子間の距離 (センチメートル)と公式 で結びつく。粒子間の距離が2cm から6cm へ増えるときの、力の平均変化率を求めよ。
Solution 解答
We are computing the average rate of change of on the interval
区間 での の平均変化率を計算している。
The average rate of change is newton per centimeter.
平均変化率は1センチメートルあたり ニュートンである。
Example 6例6
Finding an Average Rate of Change as an Expression平均変化率を式として求める
Find the average rate of change of on the interval The answer will be an expression involving in simplest form.
区間 での の平均変化率を求めよ。答えは を含む最も簡単な形の式になる。
Solution 解答
We use the average rate of change formula.
平均変化率の公式を使う。
This result tells us the average rate of change in terms of between and any other point For example, on the interval the average rate of change would be
この結果は、 と他のどの点 とのあいだの平均変化率を で表している。たとえば区間 では、平均変化率は になる。
Try It #3やってみよう3
Find the average rate of change of on the interval in simplest forms in terms of
区間 での の平均変化率を、 を使った最も簡単な形で求めよ。
Using a Graph to Determine Where a Function is Increasing, Decreasing, or Constantグラフを使って、関数が増加・減少・一定のどこであるかを決める
As part of exploring how functions change, we can identify intervals over which the function is changing in specific ways. We say that a function is increasing on an interval if the function values increase as the input values increase within that interval. Similarly, a function is decreasing on an interval if the function values decrease as the input values increase over that interval. The average rate of change of an increasing function is positive, and the average rate of change of a decreasing function is negative. Figure 3 shows examples of increasing and decreasing intervals on a function.
関数がどう変わるかを調べる一環として、決まった変わり方をする区間を見分けられる。ある区間の中で、入力値が増えるにつれて関数の値も増えるとき、その関数はその区間で増加するという。同じく、ある区間で入力値が増えるにつれて関数の値が減るとき、その関数はその区間で減少するという。増加する関数の平均変化率は正、減少する関数の平均変化率は負である。図3に、ある関数で増加する区間と減少する区間の例を示す。
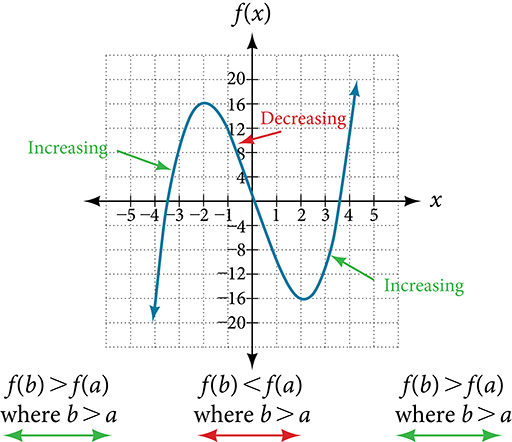
While some functions are increasing (or decreasing) over their entire domain, many others are not. A value of the input where a function changes from increasing to decreasing (as we go from left to right, that is, as the input variable increases) is the location of a local maximum. The function value at that point is the local maximum. If a function has more than one, we say it has local maxima. Similarly, a value of the input where a function changes from decreasing to increasing as the input variable increases is the location of a local minimum. The function value at that point is the local minimum. The plural form is “local minima.” Together, local maxima and minima are called local extrema, or local extreme values, of the function. (The singular form is “extremum.”) Often, the term local is replaced by the term relative. In this text, we will use the term local.
定義域全体で増加(または減少)する関数もあるが、そうでないものも多い。関数が増加から減少に変わる入力の値(左から右へ、つまり入力の変数が増える向きに見て)が、極大の位置である。その点での関数の値を極大値という。二つ以上あるときは複数の極大があるという。同じく、入力の変数が増えるにつれて関数が減少から増加に変わる入力の値が、極小の位置である。その点での関数の値を極小値という。極大と極小を合わせて、その関数の極値という。「局所的」の代わりに「相対的」という語を使うこともある。本書では「極」を使う。
Clearly, a function is neither increasing nor decreasing on an interval where it is constant. A function is also neither increasing nor decreasing at extrema. Note that we have to speak of local extrema, because any given local extremum as defined here is not necessarily the highest maximum or lowest minimum in the function’s entire domain.
関数が一定である区間では、当然ながら増加も減少もしない。極値の点でも増加も減少もしない。ここで定めた極値は、関数の定義域全体でいちばん高い最大値やいちばん低い最小値とは限らないので、あくまで極値と呼ぶ必要があることに注意せよ。
For the function whose graph is shown in Figure 4, the local maximum is 16, and it occurs at The local minimum is and it occurs at
図4にグラフを示した関数では、極大値は16で のときに現れる。極小値は で のときに現れる。
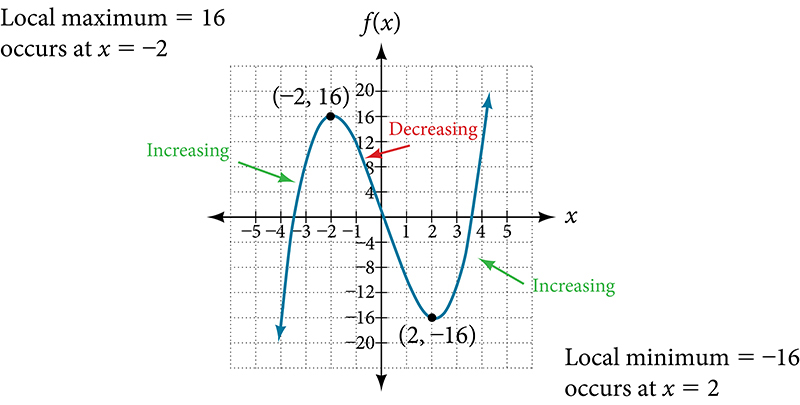
To locate the local maxima and minima from a graph, we need to observe the graph to determine where the graph attains its highest and lowest points, respectively, within an open interval. Like the summit of a roller coaster, the graph of a function is higher at a local maximum than at nearby points on both sides. The graph will also be lower at a local minimum than at neighboring points. Figure 5 illustrates these ideas for a local maximum.
グラフから極大と極小を見つけるには、ある開いた区間の中でグラフがいちばん高くなる点といちばん低くなる点を、それぞれ探せばよい。ジェットコースターの頂上のように、関数のグラフは極大では両側の近くの点より高い。極小では隣の点より低い。図5に、極大についてこの考えを示す。
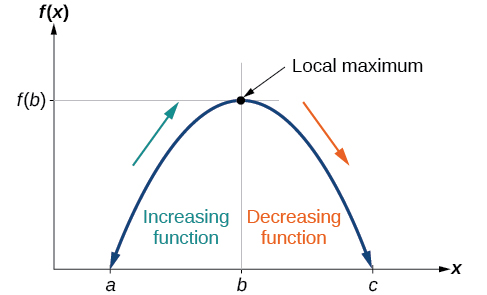
These observations lead us to a formal definition of local extrema.
以上の観察から、極値の正式な定義に至る。
Local Minima and Local Maxima 極小値と極大値
A function is an increasing function on an open interval if for any two input values and in the given interval where
与えられた開いた区間の中の、 である任意の二つの入力値 、 について が成り立つとき、関数 はその開いた区間で増加する関数であるという。
A function is a decreasing function on an open interval if for any two input values and in the given interval where
与えられた開いた区間の中の、 である任意の二つの入力値 、 について が成り立つとき、関数 はその開いた区間で減少する関数であるという。
A function has a local maximum at if there exists an interval with such that, for any in the interval Likewise, has a local minimum at if there exists an interval with such that, for any in the interval
である区間 が存在し、区間 の中のどの についても が成り立つとき、関数 は で極大をとるという。同じく、 である区間 が存在し、区間 の中のどの についても が成り立つとき、 は で極小をとるという。
Example 7例7
Finding Increasing and Decreasing Intervals on a Graphグラフから増加する区間と減少する区間を見つける
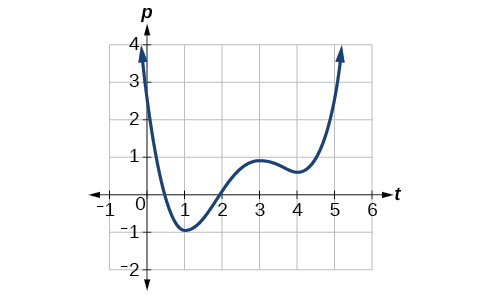
Given the function in Figure 6, identify the intervals on which the function appears to be increasing.
図6の関数 について、増加していると見える区間を答えよ。
Solution 解答
We see that the function is not constant on any interval. The function is increasing where it slants upward as we move to the right and decreasing where it slants downward as we move to the right. The function appears to be increasing from to and from on.
この関数はどの区間でも一定ではないことが分かる。右へ動くと上がっていくところで増加し、右へ動くと下がっていくところで減少する。この関数は から まで、そして から先で増加しているように見える。
In interval notation, we would say the function appears to be increasing on the interval (1,3) and the interval
区間の書き方では、この関数は区間 (1,3) と区間 で増加しているように見える、という。
Analysis 考察
Notice in this example that we used open intervals (intervals that do not include the endpoints), because the function is neither increasing nor decreasing at , , and . These points are the local extrema (two minima and a maximum).
この例では開いた区間(端点を含まない区間)を使ったことに注意せよ。、、 では関数が増加も減少もしていないからである。これらの点が極値(極小が二つと極大が一つ)である。
Example 8例8
Finding Local Extrema from a Graphグラフから極値を見つける
Graph the function Then use the graph to estimate the local extrema of the function and to determine the intervals on which the function is increasing.
関数 のグラフを描け。そのグラフを使ってこの関数の極値を見積もり、関数が増加する区間を決めよ。
Solution 解答
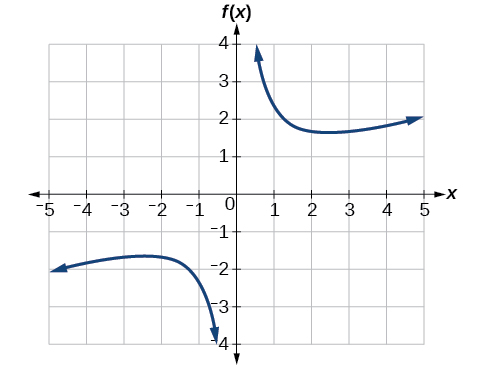
Using technology, we find that the graph of the function looks like that in Figure 7. It appears there is a low point, or local minimum, between and and a mirror-image high point, or local maximum, somewhere between and
機器を使うと、この関数のグラフは図7のようになる。 と のあいだに低い点、すなわち極小があり、 と のあいだのどこかに、それを鏡に映したような高い点、すなわち極大があるように見える。
Analysis 考察
Most graphing calculators and graphing utilities can estimate the location of maxima and minima. Figure 8 provides screen images from two different technologies, showing the estimate for the local maximum and minimum.
たいていのグラフ電卓やグラフ作成ツールは、極大と極小の位置を見積もれる。図8に、二つの違う機器の画面を示す。極大と極小の見積もりが表示されている。
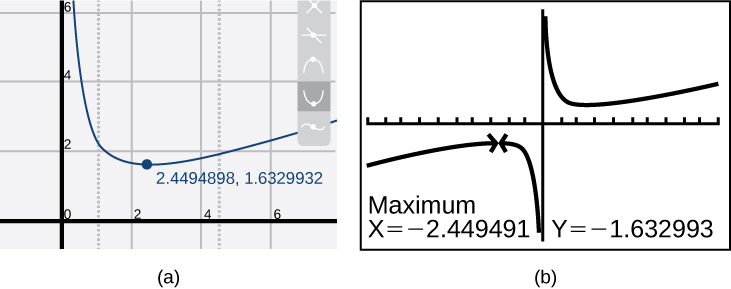
Based on these estimates, the function is increasing on the interval and Notice that, while we expect the extrema to be symmetric, the two different technologies agree only up to four decimals due to the differing approximation algorithms used by each. (The exact location of the extrema is at but determining this requires calculus.)
この見積もりによれば、この関数は区間 と で増加する。極値は対称になるはずだが、二つの機器はそれぞれ違う近似の手順を使うため、小数第四位までしか一致していないことに注意せよ(極値の正確な位置は だが、これを決めるには微積分が要る)。
Try It #4やってみよう4
Graph the function to estimate the local extrema of the function. Use these to determine the intervals on which the function is increasing and decreasing.
関数 のグラフを描いて極値を見積もれ。それを使って、関数が増加する区間と減少する区間を決めよ。
Example 9例9
Finding Local Maxima and Minima from a Graphグラフから極大と極小を見つける
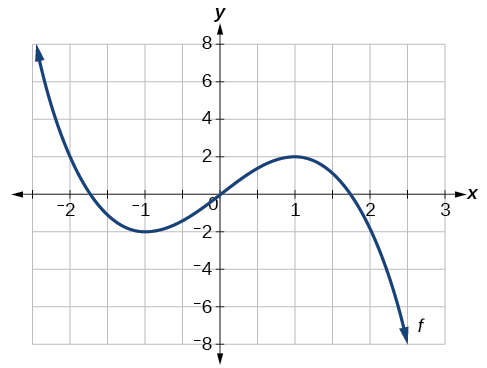
For the function whose graph is shown in Figure 9, find all local maxima and minima.
図9にグラフを示した関数 について、極大と極小をすべて求めよ。
Solution 解答
Observe the graph of The graph attains a local maximum at because it is the highest point in an open interval around The local maximum is the -coordinate at which is
のグラフを見よ。 の周りの開いた区間でいちばん高い点なので、このグラフは で極大をとる。極大値は における 座標、すなわち である。
The graph attains a local minimum at because it is the lowest point in an open interval around The local minimum is the y-coordinate at which is
の周りの開いた区間でいちばん低い点なので、このグラフは で極小をとる。極小値は における y座標、すなわち である。
Analyzing the Toolkit Functions for Increasing or Decreasing Intervals道具となる関数の増加・減少の区間を調べる
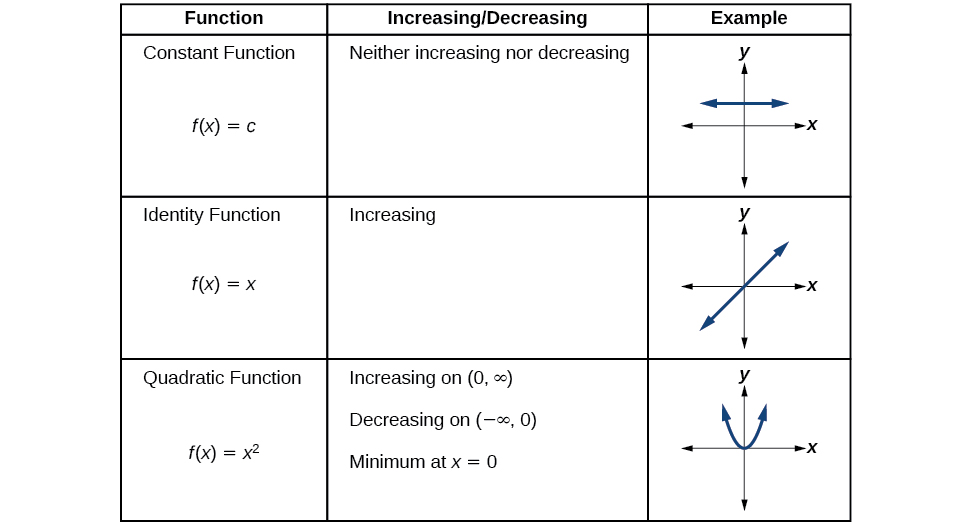
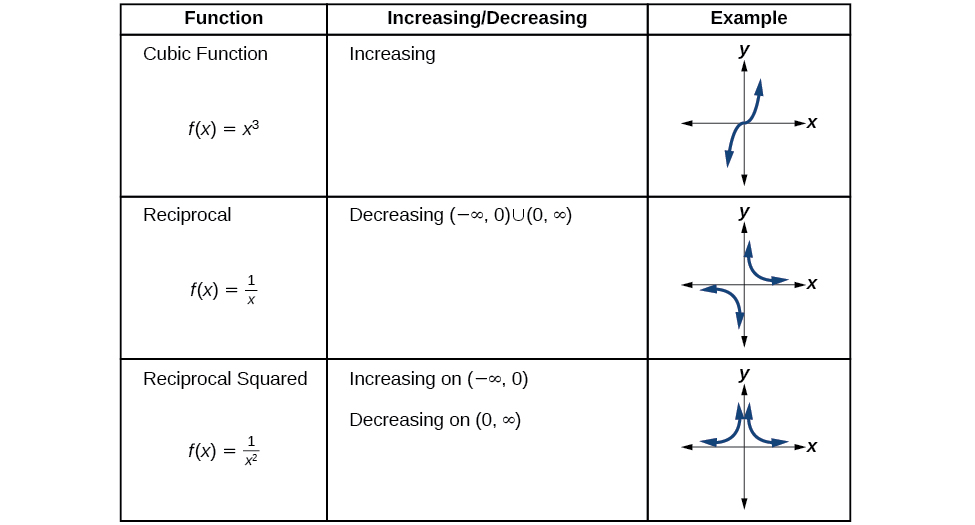
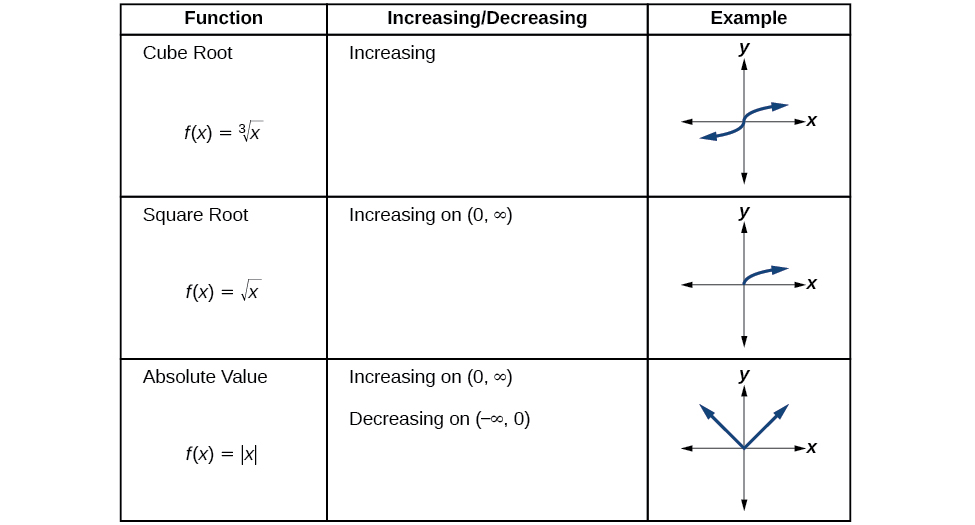
We will now return to our toolkit functions and discuss their graphical behavior in Figure 10, Figure 11, and Figure 12.
ここで道具となる関数に戻り、図10・図11・図12でそのグラフの特徴を見ていく。
Use A Graph to Locate the Absolute Maximum and Absolute Minimumグラフを使って最大値と最小値の場所を見つける
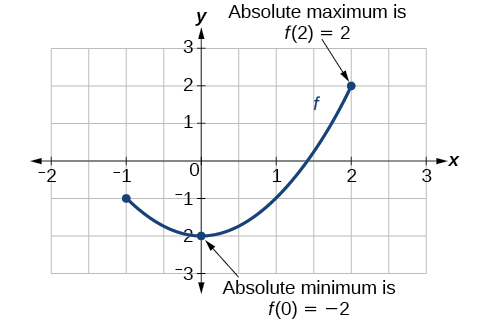
There is a difference between locating the highest and lowest points on a graph in a region around an open interval (locally) and locating the highest and lowest points on the graph for the entire domain. The coordinates (output) at the highest and lowest points are called the absolute maximum and absolute minimum, respectively.
開いた区間の周りの範囲で(局所的に)グラフのいちばん高い点といちばん低い点を見つけることと、定義域全体でグラフのいちばん高い点といちばん低い点を見つけることは違う。いちばん高い点といちばん低い点の 座標(出力)を、それぞれ最大値・最小値という。
To locate absolute maxima and minima from a graph, we need to observe the graph to determine where the graph attains it highest and lowest points on the domain of the function. See Figure 13.
グラフから最大値と最小値を見つけるには、関数の定義域の中でグラフがいちばん高くなる点といちばん低くなる点を探せばよい。図13を見よ。
Not every function has an absolute maximum or minimum value. The toolkit function is one such function.
どの関数にも最大値や最小値があるわけではない。道具となる関数 はそうした関数の一つである。
Absolute Maxima and Minima 最大値と最小値
The absolute maximum of at is where for all in the domain of
の定義域のどの についても が成り立つとき、 における の最大値は である。
The absolute minimum of at is where for all in the domain of
の定義域のどの についても が成り立つとき、 における の最小値は である。
Example 10例10
Finding Absolute Maxima and Minima from a Graphグラフから最大値と最小値を見つける
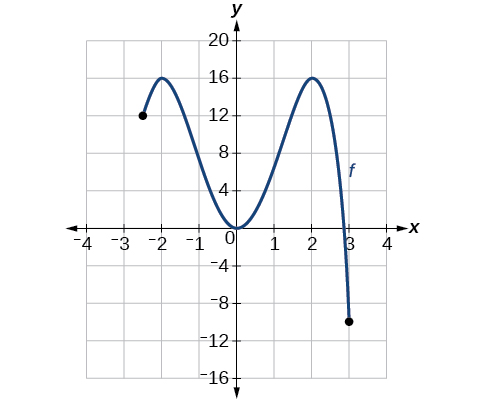
For the function shown in Figure 14, find all absolute maxima and minima.
図14に示した関数 について、最大値と最小値をすべて求めよ。
Solution 解答
Observe the graph of The graph attains an absolute maximum in two locations, and because at these locations, the graph attains its highest point on the domain of the function. The absolute maximum is the y-coordinate at and which is
のグラフを見よ。このグラフは と の二か所で最大値をとる。この位置で、関数の定義域の中でいちばん高い点に達するからである。最大値は と における y座標、すなわち である。
The graph attains an absolute minimum at because it is the lowest point on the domain of the function’s graph. The absolute minimum is the y-coordinate at which is
このグラフは で最小値をとる。関数のグラフの定義域の中でいちばん低い点だからである。最小値は における y座標、すなわち である。
Media 教材
Access this online resource for additional instruction and practice with rates of change.
変化の割合についての説明と練習をさらに求めるなら、次のオンライン教材にあたるとよい。
・平均変化率
Verbal言葉で答える問題
2. If a function is increasing on and decreasing on then what can be said about the local extremum of on
2. 関数 が で増加し で減少するとき、 における の極値について何が言えるか。
4. How does the graph of the absolute value function compare to the graph of the quadratic function, in terms of increasing and decreasing intervals?
4. 増加する区間・減少する区間という点で、絶対値関数のグラフは二次関数 のグラフとどう比べられるか。
Algebraic代数の問題
For the following exercises, find the average rate of change of each function on the interval specified for real numbers or in simplest form.
次の各問について、指定された区間での各関数の平均変化率を、実数 または を使った最も簡単な形で求めよ。
6. on
6. での
8. on
8. での
10. on
10. での
12. on
12. での
14. on
14. での
Graphicalグラフの問題
For the following exercises, consider the graph of shown in Figure 15.
次の各問では、図15に示した のグラフを考えよ。
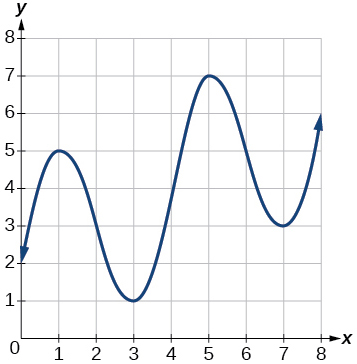
16. Estimate the average rate of change from to
16. から までの平均変化率を見積もれ。
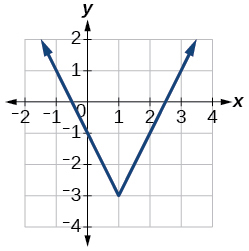
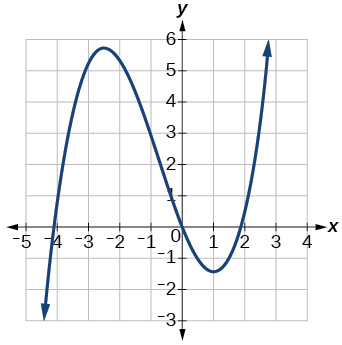
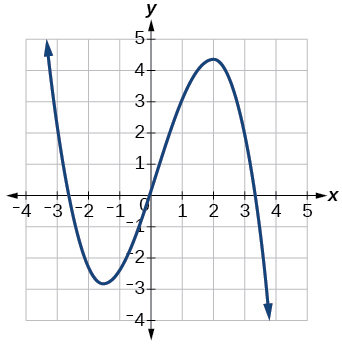
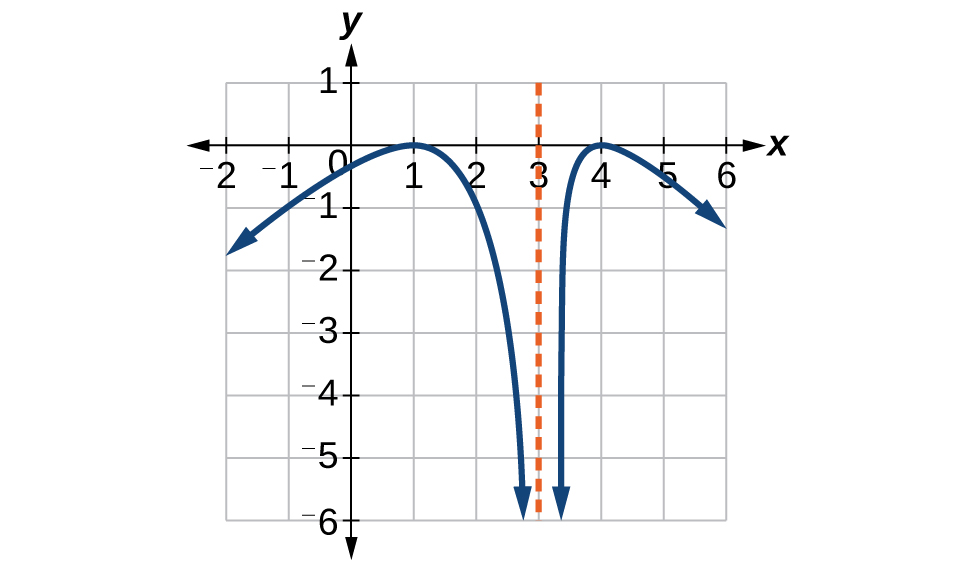
For the following exercises, use the graph of each function to estimate the intervals on which the function is increasing or decreasing.
次の各問について、各関数のグラフを使って、関数が増加または減少する区間を見積もれ。
For the following exercises, consider the graph shown in Figure 16.
次の各問では、図16に示したグラフを考えよ。
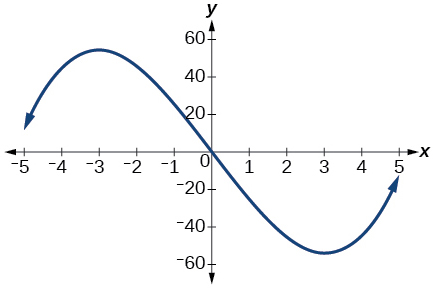
22. Estimate the intervals where the function is increasing or decreasing.
22. 関数が増加または減少する区間を見積もれ。
For the following exercises, consider the graph in Figure 17.
次の各問では、図17のグラフを考えよ。
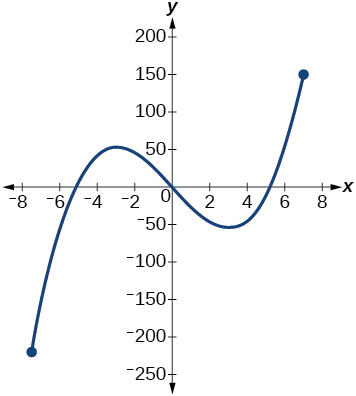
24. If the complete graph of the function is shown, estimate the intervals where the function is increasing or decreasing.
24. これがこの関数のグラフの全体だとして、関数が増加または減少する区間を見積もれ。
Numeric数値の問題
26. Table 3 gives the annual sales (in millions of dollars) of a product from 1998 to 2006. What was the average rate of change of annual sales (a) between 2001 and 2002, and (b) between 2001 and 2004?
26. 表3に、ある製品の1998年から2006年までの年間売上(百万ドル)を示す。年間売上の平均変化率は、(a) 2001年から2002年、(b) 2001年から2004年でそれぞれいくらか。
| Year年 | Sales (millions of dollars)売上(百万ドル) |
|---|---|
| 1998 | 201 |
| 1999 | 219 |
| 2000 | 233 |
| 2001 | 243 |
| 2002 | 249 |
| 2003 | 251 |
| 2004 | 249 |
| 2005 | 243 |
| 2006 | 233 |
27. Table 4 gives the population of a town (in thousands) from 2000 to 2008. What was the average rate of change of population (a) between 2002 and 2004, and (b) between 2002 and 2006?
27. 表4に、ある町の2000年から2008年までの人口(千人)を示す。人口の平均変化率は、(a) 2002年から2004年、(b) 2002年から2006年でそれぞれいくらか。
| Year年 | Population (thousands)人口(千人) |
|---|---|
| 2000 | 87 |
| 2001 | 84 |
| 2002 | 83 |
| 2003 | 80 |
| 2004 | 77 |
| 2005 | 76 |
| 2006 | 78 |
| 2007 | 81 |
| 2008 | 85 |
For the following exercises, find the average rate of change of each function on the interval specified.
次の各問について、指定された区間での各関数の平均変化率を求めよ。
28. on
28. での
30. on
30. での
32. on
32. での
34. on
34. での
Technology機器を使う問題
For the following exercises, use a graphing utility to estimate the local extrema of each function and to estimate the intervals on which the function is increasing and decreasing.
次の各問について、グラフ作成ツールを使って各関数の極値を見積もり、関数が増加する区間と減少する区間を見積もれ。
Extension発展問題
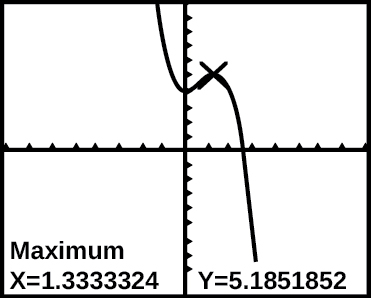
Based on the calculator screen shot, the point is which of the following?
電卓の画面をもとにすると、点 は次のうちどれか。
ⓐa relative (local) maximum of the functionⓑthe vertex of the functionⓒthe absolute maximum of the functionⓓa zero of the function
ⓐこの関数の極大ⓑこの関数の頂点ⓒこの関数の最大値ⓓこの関数の零点
42. Let Find a number such that the average rate of change of the function on the interval is
42. とする。区間 での関数 の平均変化率が になるような数 を求めよ。
Real-World Applications応用問題
44. At the start of a trip, the odometer on a car read 21,395. At the end of the trip, 13.5 hours later, the odometer read 22,125. Assume the scale on the odometer is in miles. What is the average speed the car traveled during this trip?
44. 旅の初めに、自動車の走行距離計は21,395を指していた。13.5時間後の旅の終わりには22,125を指していた。走行距離計の目盛りはマイルとする。この旅のあいだの自動車の平均の速さはいくらか。
45. A driver of a car stopped at a gas station to fill up their gas tank. They looked at their watch, and the time read exactly 3:40 p.m. At this time, they started pumping gas into the tank. At exactly 3:44, the tank was full and the driver noticed that they had pumped 10.7 gallons. What is the average rate of flow of the gasoline into the gas tank?
45. ある運転手が給油所に寄って燃料を満たした。腕時計を見ると、時刻はちょうど午後3時40分だった。このとき給油を始めた。ちょうど3時44分に満タンになり、10.7ガロン入れたことに気づいた。燃料の平均の流量はいくらか。
46. Near the surface of the moon, the distance that an object falls is a function of time. It is given by where is in seconds and is in feet. If an object is dropped from a certain height, find the average velocity of the object from to
46. 月の表面近くでは、物体が落ちる距離は時間の関数である。それは で与えられる。ここで は秒、 はフィートである。ある高さから物体を落としたとき、 から までの物体の平均の速さを求めよ。