第3章関数Functions
Graphing Functions Using Vertical and Horizontal Shifts縦の平行移動と横の平行移動を使って関数のグラフを描く
Often when given a problem, we try to model the scenario using mathematics in the form of words, tables, graphs, and equations. One method we can employ is to adapt the basic graphs of the toolkit functions to build new models for a given scenario. There are systematic ways to alter functions to construct appropriate models for the problems we are trying to solve.
問題を与えられると、たいてい言葉・表・グラフ・方程式という数学の形でその場面を表そうとする。使える方法の一つが、道具となる関数の基本のグラフを作り替えて、その場面に合う新しいモデルを作ることである。解こうとしている問題にふさわしいモデルを組み立てるために、関数を決まったやり方で変える方法がある。
Identifying Vertical Shifts縦の平行移動を見分ける
One simple kind of transformation involves shifting the entire graph of a function up, down, right, or left. The simplest shift is a vertical shift, moving the graph up or down, because this transformation involves adding a positive or negative constant to the function. In other words, we add the same constant to the output value of the function regardless of the input. For a function the function is shifted vertically units. See Figure 2 for an example.
単純な変形の一つが、関数のグラフ全体を上下左右へ動かすことである。いちばん単純な移動は縦の平行移動、すなわちグラフを上下に動かすことである。この変形は、関数に正または負の定数を足すだけだからである。言い換えると、入力によらず関数の出力値に同じ定数を足す。関数 について、関数 は縦に だけ平行移動したものである。例は図2を見よ。
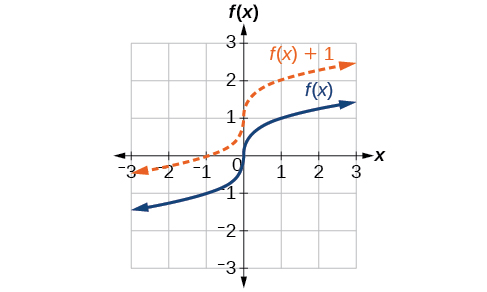
To help you visualize the concept of a vertical shift, consider that Therefore, is equivalent to Every unit of is replaced by so the y-value increases or decreases depending on the value of The result is a shift upward or downward.
縦の平行移動という考えを思い描く助けとして、 であることを考えよう。よって は と同じである。 の各単位が に置き換わるので、 の値に応じて y の値が増えたり減ったりする。その結果、上または下への移動になる。
Vertical Shift 上下方向の平行移動
Given a function a new function where is a constant, is a vertical shift of the function All the output values change by units. If is positive, the graph will shift up. If is negative, the graph will shift down.
関数 が与えられたとき、定数 を使った新しい関数 は、関数 の縦の平行移動である。すべての出力値が だけ変わる。 が正ならグラフは上へ、 が負なら下へ動く。
Example 1例1
Adding a Constant to a Function関数に定数を足す
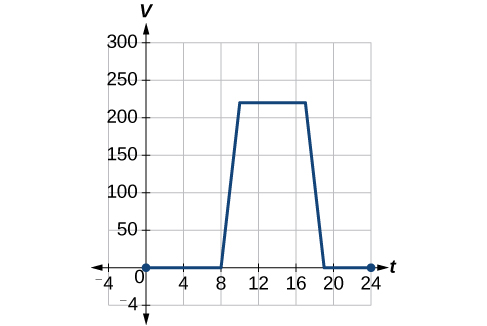
To regulate temperature in a green building, airflow vents near the roof open and close throughout the day. Figure 3 shows the area of open vents (in square feet) throughout the day in hours after midnight, During the summer, the facilities manager decides to try to better regulate temperature by increasing the amount of open vents by 20 square feet throughout the day and night. Sketch a graph of this new function.
環境に配慮した建物の温度を調節するため、屋根近くの通気口が一日を通して開閉する。図3に、真夜中からの時間 に対する、開いた通気口の面積 (平方フィート)を示す。夏のあいだ、設備の管理者は温度をよりよく保つため、昼夜を通して開口面積を20平方フィート増やしてみることにした。この新しい関数のグラフの概形を描け。
Solution 解答
We can sketch a graph of this new function by adding 20 to each of the output values of the original function. This will have the effect of shifting the graph vertically up, as shown in Figure 4.
もとの関数の各出力値に20を足せば、この新しい関数のグラフの概形を描ける。図4のように、これはグラフを縦に上へ動かす働きをする。
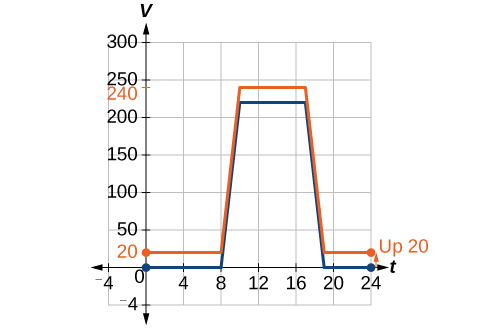
Notice that in Figure 4, for each input value, the output value has increased by 20, so if we call the new function we could write
図4では、どの入力値でも出力値が20増えていることに注意せよ。この新しい関数を と呼べば、次のように書ける。
This notation tells us that, for any value of can be found by evaluating the function at the same input and then adding 20 to the result. This defines as a transformation of the function in this case a vertical shift up 20 units. Notice that, with a vertical shift, the input values stay the same and only the output values change. See Table 1.
この書き方は、 のどの値についても、同じ入力で関数 の値を求め、その結果に20を足せばよいことを教えてくれる。これは を関数 の変形として、この場合は上へ20だけの縦の平行移動として定めている。縦の平行移動では入力値は変わらず、出力値だけが変わることに注意せよ。表1を見よ。
| 0 | 8 | 10 | 17 | 19 | 24 | |
| 0 | 0 | 220 | 220 | 0 | 0 | |
| 20 | 20 | 240 | 240 | 20 | 20 |
How To 手順
Given a tabular function, create a new row to represent a vertical shift.
表で表された関数が与えられたとき、縦の平行移動を表す新しい行を作る。
1. Identify the output row or column.2. Determine the magnitude of the shift.3. Add the shift to the value in each output cell. Add a positive value for up or a negative value for down.
1. 出力の行または列を見分ける。2. 移動の大きさを決める。3. 各出力のますの値に移動分を足す。上なら正の値、下なら負の値を足す。
Example 2例2
Shifting a Tabular Function Vertically表で表された関数を縦に平行移動する
A function is given in Table 2. Create a table for the function
表2に関数 が与えられている。関数 の表を作れ。
| 2 | 4 | 6 | 8 | |
| 1 | 3 | 7 | 11 |
Solution 解答
The formula tells us that we can find the output values of by subtracting 3 from the output values of For example:
式 は、 の出力値から3を引けば の出力値が求まることを教えてくれる。たとえば、
Subtracting 3 from each value, we can complete a table of values for as shown in Table 3.
各 の値から3を引けば、表3のように の値の表を作れる。
| 2 | 4 | 6 | 8 | |
| 1 | 3 | 7 | 11 | |
| −2 | 0 | 4 | 8 |
Analysis 考察
As with the earlier vertical shift, notice the input values stay the same and only the output values change.
先ほどの縦の平行移動と同じく、入力値は変わらず出力値だけが変わることに注意せよ。
Try It #1やってみよう1
The function gives the height of a ball (in meters) thrown upward from the ground after seconds. Suppose the ball was instead thrown from the top of a 10-m building. Relate this new height function to and then find a formula for
関数 は、地面から真上に投げたボールの 秒後の高さ (メートル)を与える。代わりに高さ10mの建物の屋上から投げたとしよう。この新しい高さの関数 を と結びつけ、そのうえで の式を求めよ。
Identifying Horizontal Shifts横の平行移動を見分ける
We just saw that the vertical shift is a change to the output, or outside, of the function. We will now look at how changes to input, on the inside of the function, change its graph and meaning. A shift to the input results in a movement of the graph of the function left or right in what is known as a horizontal shift, shown in Figure 5.
縦の平行移動は、関数の出力すなわち外側への変更だと見た。ここでは、関数の内側である入力への変更が、グラフと意味をどう変えるかを見る。入力への移動は、図5に示す横の平行移動として、関数のグラフを左右へ動かす。
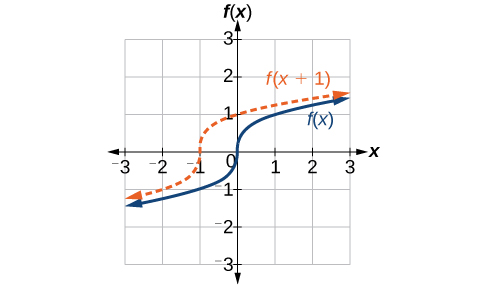
For example, if then is a new function. Each input is reduced by 2 prior to squaring the function. The result is that the graph is shifted 2 units to the right, because we would need to increase the prior input by 2 units to yield the same output value as given in
たとえば のとき、 は新しい関数である。二乗する前に各入力が2だけ減らされる。その結果グラフは右へ2だけ動く。 と同じ出力値を得るには、もとの入力を2だけ増やす必要があるからである。
Horizontal Shift 左右方向の平行移動
Given a function a new function where is a constant, is a horizontal shift of the function If is positive, the graph will shift right. If is negative, the graph will shift left.
関数 が与えられたとき、定数 を使った新しい関数 は、関数 の横の平行移動である。 が正ならグラフは右へ、 が負なら左へ動く。
Example 3例3
Adding a Constant to an Input入力に定数を足す
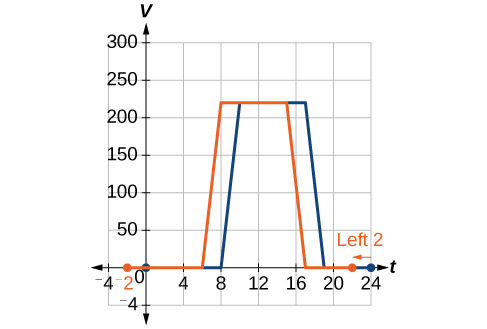
Returning to our building airflow example from Figure 3, suppose that in autumn the facilities manager decides that the original venting plan starts too late, and wants to begin the entire venting program 2 hours earlier. Sketch a graph of the new function.
図3の建物の通気の例に戻ろう。秋になって設備の管理者が、もとの通気の計画では開始が遅すぎると考え、通気の予定全体を2時間早めたいとする。新しい関数のグラフの概形を描け。
Solution 解答
We can set to be the original program and to be the revised program.
をもとの計画、 を改めた計画としよう。
In the new graph, at each time, the airflow is the same as the original function was 2 hours later. For example, in the original function the airflow starts to change at 8 a.m., whereas for the function the airflow starts to change at 6 a.m. The comparable function values are See Figure 6. Notice also that the vents first opened to at 10 a.m. under the original plan, while under the new plan the vents reach at
8 a.m., so
新しいグラフでは、各時刻の通気量が、もとの関数 の2時間後の値と同じになる。たとえばもとの関数 では午前8時に通気が変わり始めるが、関数 では午前6時に変わり始める。対応する関数の値は である。図6を見よ。またもとの計画では午前10時に通気口が まで開いたが、新しい計画では午前8時に に達するので となることにも注意せよ。
In both cases, we see that, because starts 2 hours sooner, That means that the same output values are reached when
どちらの場合も、 が2時間早く始まるので となることが分かる。つまり のときに同じ出力値に達する。
Analysis 考察
Note that has the effect of shifting the graph to the left.
はグラフを左へ動かす働きをすることに注意せよ。
Horizontal changes or “inside changes” affect the domain of a function (the input) instead of the range and often seem counterintuitive. The new function uses the same outputs as but matches those outputs to inputs 2 hours earlier than those of Said another way, we must add 2 hours to the input of to find the corresponding output for
横の変更、すなわち「内側の変更」は、値域ではなく関数の定義域(入力)に効くので、直感に反して見えることが多い。新しい関数 は と同じ出力を使うが、その出力を より2時間早い入力に対応させる。言い換えると、 の対応する出力を求めるには、 の入力に2時間を足さなければならない。
How To 手順
Given a tabular function, create a new row to represent a horizontal shift.
表で表された関数が与えられたとき、横の平行移動を表す新しい行を作る。
1. Identify the input row or column.2. Determine the magnitude of the shift.3. Add the shift to the value in each input cell.
1. 入力の行または列を見分ける。2. 移動の大きさを決める。3. 各入力のますの値に移動分を足す。
Example 4例4
Shifting a Tabular Function Horizontally表で表された関数を横に平行移動する
A function is given in Table 4. Create a table for the function
表4に関数 が与えられている。関数 の表を作れ。
| 2 | 4 | 6 | 8 | |
| 1 | 3 | 7 | 11 |
Solution 解答
The formula tells us that the output values of are the same as the output value of when the input value is 3 less than the original value. For example, we know that To get the same output from the function we will need an input value that is 3 larger. We input a value that is 3 larger for because the function takes 3 away before evaluating the function
式 は、入力値がもとの値より3だけ小さいときの の出力値が、 の出力値と同じであることを教えてくれる。たとえば と分かっている。関数 から同じ出力を得るには、3だけ大きい入力値が要る。この関数は の値を求める前に3を引くので、 には3だけ大きい値を入れる。
We continue with the other values to create Table 5.
残りの値についても同じように進めて表5を作る。
| 5 | 7 | 9 | 11 | |
| 2 | 4 | 6 | 8 | |
| 1 | 3 | 7 | 11 | |
| 1 | 3 | 7 | 11 |
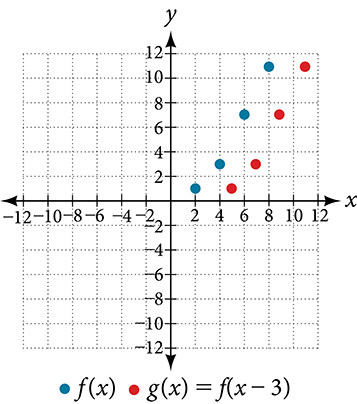
The result is that the function has been shifted to the right by 3. Notice the output values for remain the same as the output values for but the corresponding input values, have shifted to the right by 3. Specifically, 2 shifted to 5, 4 shifted to 7, 6 shifted to 9, and 8 shifted to 11.
その結果、関数 は右へ3だけ動いたことになる。 の出力値は の出力値と同じままだが、対応する入力値 は右へ3だけずれていることに注意せよ。具体的には、2が5へ、4が7へ、6が9へ、8が11へずれている。
Analysis 考察
Figure 7 represents both of the functions. We can see the horizontal shift in each point.
図7に両方の関数を示す。各点で横の移動が見てとれる。
Example 5例5
Identifying a Horizontal Shift of a Toolkit Function道具となる関数の横の平行移動を見分ける
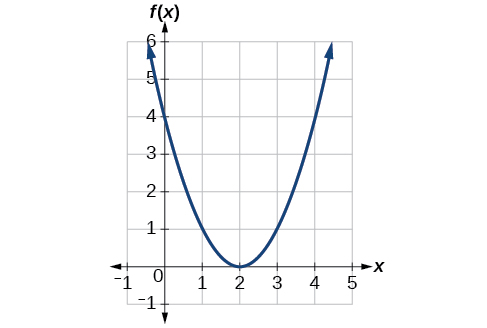
Figure 8 represents a transformation of the toolkit function Relate this new function to and then find a formula for
図8は、道具となる関数 の変形を表している。この新しい関数 を と結びつけ、そのうえで の式を求めよ。
Solution 解答
Notice that the graph is identical in shape to the function, but the x-values are shifted to the right 2 units. The vertex used to be at (0,0), but now the vertex is at (2,0). The graph is the basic quadratic function shifted 2 units to the right, so
このグラフは の関数とまったく同じ形だが、x の値が右へ2だけずれていることに注意せよ。頂点はかつて (0,0) にあったが、いまは (2,0) にある。このグラフは基本の二次関数を右へ2だけ動かしたものなので、
Notice how we must input the value to get the output value the x-values must be 2 units larger because of the shift to the right by 2 units. We can then use the definition of the function to write a formula for by evaluating
出力値 を得るのに、値 を入れなければならないことに注意せよ。右へ2だけ動いたぶん、x の値は2だけ大きくなければならない。そのうえで、 の値を求めることで、 の関数の定義を使って の式を書ける。
Analysis 考察
To determine whether the shift is or , consider a single reference point on the graph. For a quadratic, looking at the vertex point is convenient. In the original function, In our shifted function, To obtain the output value of 0 from the function we need to decide whether a plus or a minus sign will work to satisfy For this to work, we will need to subtract 2 units from our input values.
移動が か かを決めるには、グラフ上の基準となる点を一つ考えるとよい。二次関数なら頂点を見るのが便利である。もとの関数では である。動かした関数では である。関数 から出力値0を得るには、 を満たすのがプラスかマイナスかを決めなければならない。これが成り立つには、入力値から2を引く必要がある。
Example 6例6
Interpreting Horizontal versus Vertical Shifts横の平行移動と縦の平行移動を読み分ける
The function gives the number of gallons of gas required to drive miles. Interpret and
関数 は、 マイル走るのに必要な燃料のガロン数を与える。 と の意味を述べよ。
Solution 解答
can be interpreted as adding 10 to the output, gallons. This is the gas required to drive miles, plus another 10 gallons of gas. The graph would indicate a vertical shift.
は、出力であるガロン数に10を足すと読める。これは マイル走るのに必要な燃料に、さらに10ガロンを加えたものである。グラフでは縦の平行移動になる。
can be interpreted as adding 10 to the input, miles. So this is the number of gallons of gas required to drive 10 miles more than miles. The graph would indicate a horizontal shift.
は、入力であるマイル数に10を足すと読める。よってこれは、 マイルより10マイル多く走るのに必要な燃料のガロン数である。グラフでは横の平行移動になる。
Try It #2やってみよう2
Given the function graph the original function and the transformation on the same axes. Is this a horizontal or a vertical shift? Which way is the graph shifted and by how many units?
関数 が与えられたとき、もとの関数 と変形 を同じ座標軸に描け。これは横と縦のどちらの平行移動か。グラフはどちらへ何単位動いたか。
Combining Vertical and Horizontal Shifts縦と横の平行移動を組み合わせる
Now that we have two transformations, we can combine them. Vertical shifts are outside changes that affect the output (y-) values and shift the function up or down. Horizontal shifts are inside changes that affect the input (x-) values and shift the function left or right. Combining the two types of shifts will cause the graph of a function to shift up or down and left or right.
変形が二つ出そろったので、これらを組み合わせられる。縦の平行移動は外側の変更で、出力(y)の値に効き、関数を上下に動かす。横の平行移動は内側の変更で、入力(x)の値に効き、関数を左右に動かす。この二種類の移動を組み合わせると、関数のグラフは上下にも左右にも動く。
How To 手順
Given a function and both a vertical and a horizontal shift, sketch the graph.
関数と、縦・横両方の平行移動が与えられたとき、グラフの概形を描く。
1. Identify the vertical and horizontal shifts from the formula.2. The vertical shift results from a constant added to the output. Move the graph up for a positive constant and down for a negative constant.3. The horizontal shift results from a constant added to the input. Move the graph left for a positive constant and right for a negative constant.4. Apply the shifts to the graph in either order.
1. 式から縦と横の移動を見分ける。2. 縦の移動は、出力に足された定数から生じる。定数が正ならグラフを上へ、負なら下へ動かす。3. 横の移動は、入力に足された定数から生じる。定数が正ならグラフを左へ、負なら右へ動かす。4. グラフに二つの移動を、どちらの順でもよいので当てる。
Example 7例7
Graphing Combined Vertical and Horizontal Shifts縦と横の平行移動を組み合わせてグラフを描く
Given sketch a graph of
が与えられたとき、 のグラフの概形を描け。
Solution 解答
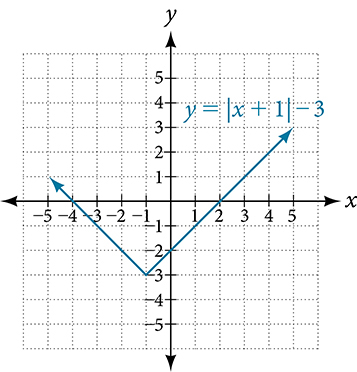
The function is our toolkit absolute value function. We know that this graph has a V shape, with the point at the origin. The graph of has transformed in two ways: is a change on the inside of the function, giving a horizontal shift left by 1, and the subtraction by 3 in is a change to the outside of the function, giving a vertical shift down by 3. The transformation of the graph is illustrated in Figure 9.
関数 は道具となる絶対値関数である。このグラフは原点を頂点とするV字形だと分かっている。 のグラフは を二通りに変形している。 は関数の内側の変更で左へ1の横の平行移動を与え、 での3の減算は外側の変更で下へ3の縦の平行移動を与える。グラフの変形を図9に示す。
Let us follow one point of the graph of
のグラフ上の一点を追ってみよう。
• The point is transformed first by shifting left 1 unit: • The point is transformed next by shifting down 3 units:
・点 はまず左へ1だけ動いて になる。・点 は次に下へ3だけ動いて になる。
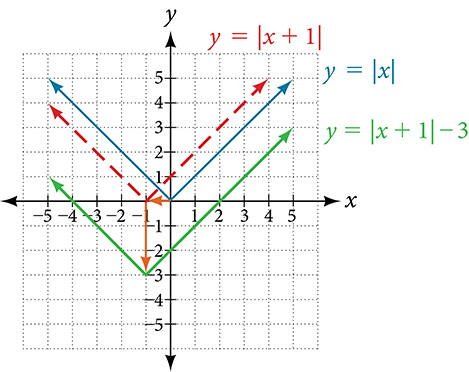
Figure 10 shows the graph of
図10に のグラフを示す。
Try It #3やってみよう3
Given sketch a graph of
が与えられたとき、 のグラフの概形を描け。
Example 8例8
Identifying Combined Vertical and Horizontal Shifts縦と横の平行移動の組み合わせを見分ける
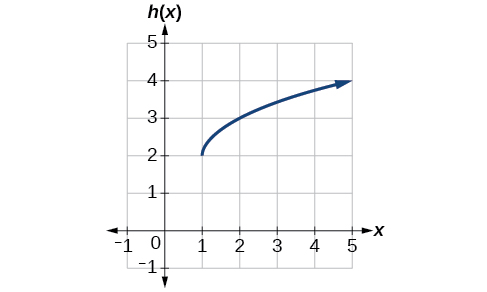
Write a formula for the graph shown in Figure 11, which is a transformation of the toolkit square root function.
図11のグラフの式を書け。これは道具となる平方根の関数の変形である。
Solution 解答
The graph of the toolkit function starts at the origin, so this graph has been shifted 1 to the right and up 2. In function notation, we could write that as
道具となる関数のグラフは原点から始まるので、このグラフは右へ1、上へ2だけ動いている。関数の表記では次のように書ける。
Using the formula for the square root function, we can write
平方根の関数の式を使えば、次のように書ける。
Analysis 考察
Note that this transformation has changed the domain and range of the function. This new graph has domain and range
この変形によって関数の定義域と値域が変わったことに注意せよ。この新しいグラフの定義域は 、値域は である。
Try It #4やってみよう4
Write a formula for a transformation of the toolkit reciprocal function that shifts the function’s graph one unit to the right and one unit up.
道具となる逆数の関数 を、グラフが右へ1、上へ1だけ動くように変形した式を書け。