第3章関数Functions
Using the Vertical Line Test縦線の判定法を使う
As we have seen in some examples above, we can represent a function using a graph. Graphs display a great many input-output pairs in a small space. The visual information they provide often makes relationships easier to understand. By convention, graphs are typically constructed with the input values along the horizontal axis and the output values along the vertical axis.
上のいくつかの例で見たとおり、関数はグラフで表せる。グラフは、入力と出力の組をたくさん狭い場所に示す。目で見て分かる情報は、関係の理解を助けることが多い。習わしとして、グラフはふつう入力値を横の軸に、出力値を縦の軸にとって描く。
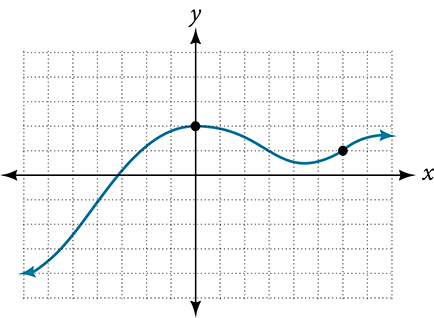
The most common graphs name the input value and the output value and we say is a function of or when the function is named The graph of the function is the set of all points in the plane that satisfies the equation If the function is defined for only a few input values, then the graph of the function is only a few points, where the x-coordinate of each point is an input value and the y-coordinate of each point is the corresponding output value. For example, the black dots on the graph in Figure 7 tell us that and However, the set of all points satisfying is a curve. The curve shown includes and because the curve passes through those points.
もっともよくあるグラフでは、入力値を 、出力値を と名づけ、 は の関数であるという。関数の名前が なら と書く。関数のグラフとは、方程式 を満たす平面上の点 すべての集合である。関数がわずかな入力値についてしか定まっていなければ、そのグラフはわずかな点だけになる。各点の x座標が入力値、y座標が対応する出力値である。たとえば図7のグラフの黒い点は、 と を教えてくれる。しかし を満たす点 すべての集合は曲線になる。示した曲線は と を含む。曲線がその点を通っているからである。
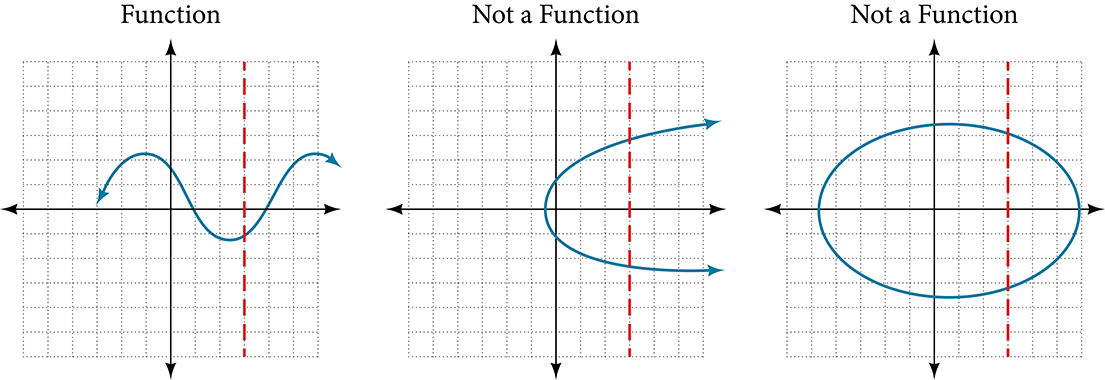
The vertical line test can be used to determine whether a graph represents a function. If we can draw any vertical line that intersects a graph more than once, then the graph does not define a function because a function has only one output value for each input value. See Figure 8.
グラフが関数を表しているかどうかは、縦線の判定法で決められる。グラフと二回以上交わる縦線が一本でも引けるなら、そのグラフは関数を定めていない。関数は各入力値に対して出力値を一つしか持たないからである。図8を見よ。
How To 手順
Given a graph, use the vertical line test to determine if the graph represents a function.
グラフが与えられたとき、縦線の判定法でそれが関数を表しているかどうかを決める。
1. Inspect the graph to see if any vertical line drawn would intersect the curve more than once.2. If there is any such line, determine that the graph does not represent a function.
1. 引いた縦線が曲線と二回以上交わることがないか、グラフを調べる。2. そうした線が一本でもあれば、そのグラフは関数を表していないと判定する。
Example 14例14
Applying the Vertical Line Test縦線の判定法を使う
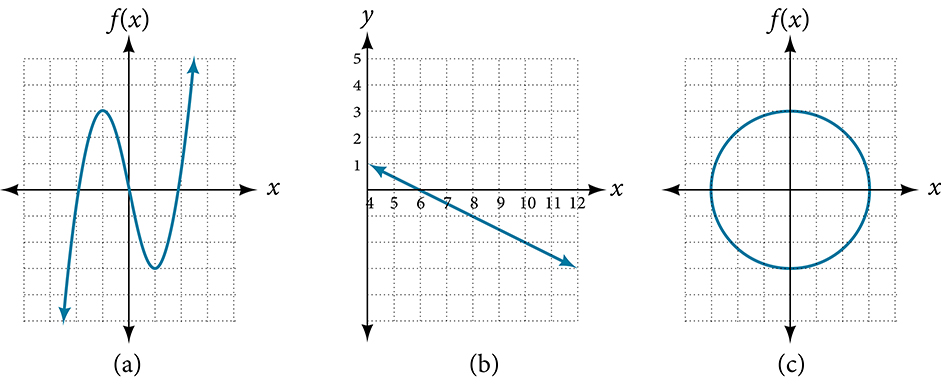
Which of the graphs in Figure 9 represent(s) a function
図9のグラフのうち、関数 を表しているのはどれか。
Solution 解答
If any vertical line intersects a graph more than once, the relation represented by the graph is not a function. Notice that any vertical line would pass through only one point of the two graphs shown in parts (a) and (b) of Figure 9. From this we can conclude that these two graphs represent functions. The third graph does not represent a function because, at most x-values, a vertical line would intersect the graph at more than one point, as shown in Figure 10.
縦線がグラフと二回以上交わるなら、そのグラフが表す関係は関数ではない。図9の(a)と(b)に示したグラフでは、どんな縦線も一点しか通らないことに注意せよ。ここから、この二つのグラフは関数を表していると分かる。三つ目のグラフは、図10のように、ほとんどの x の値で縦線がグラフと二点以上で交わるので、関数を表していない。
Try It #11やってみよう11
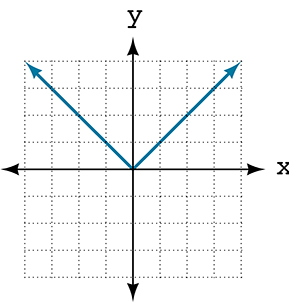
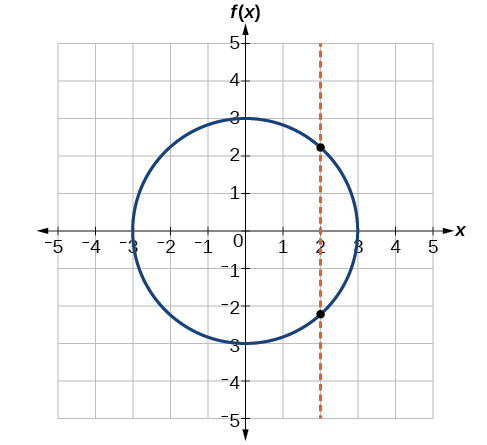
Does the graph in Figure 11 represent a function?
図11のグラフは関数を表しているか。