第3章関数Functions
Graphing Functions Using Stretches and Compressions拡大と縮小を使って関数のグラフを描く
Adding a constant to the inputs or outputs of a function changed the position of a graph with respect to the axes, but it did not affect the shape of a graph. We now explore the effects of multiplying the inputs or outputs by some quantity.
関数の入力や出力に定数を足すと、軸に対するグラフの位置は変わったが、グラフの形は変わらなかった。ここでは、入力や出力にある量を掛けたときの効き方を調べる。
We can transform the inside (input values) of a function or we can transform the outside (output values) of a function. Each change has a specific effect that can be seen graphically.
関数の内側(入力値)を変形することも、外側(出力値)を変形することもできる。それぞれの変更には、グラフで見てとれる決まった効き方がある。
Vertical Stretches and Compressions縦の拡大と縮小
When we multiply a function by a positive constant, we get a function whose graph is stretched or compressed vertically in relation to the graph of the original function. If the constant is greater than 1, we get a vertical stretch; if the constant is between 0 and 1, we get a vertical compression. Figure 19 shows a function multiplied by constant factors 2 and 0.5 and the resulting vertical stretch and compression.
関数に正の定数を掛けると、もとの関数のグラフに対して縦に伸びたり縮んだりしたグラフの関数が得られる。定数が1より大きければ縦の拡大、0と1のあいだなら縦の縮小になる。図19に、関数に定数2と0.5を掛けたときの縦の拡大と縮小を示す。
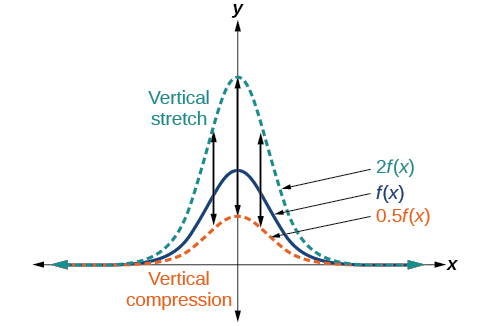
Vertical Stretches and Compressions 縦方向の拡大・縮小
Given a function a new function where is a constant, is a vertical stretch or vertical compression of the function
関数 が与えられたとき、定数 を使った新しい関数 は、関数 の縦の拡大または縦の縮小である。
• If then the graph will be stretched.• If then the graph will be compressed.• If then there will be combination of a vertical stretch or compression with a vertical reflection.
・ ならグラフは伸びる。・ ならグラフは縮む。・ なら、縦の拡大または縮小と縦の対称移動が組み合わさる。
How To 手順
Given a function, graph its vertical stretch.
関数が与えられたとき、その縦の拡大のグラフを描く。
1. Identify the value of 2. Multiply all range values by 3. If the graph is stretched by a factor of If the graph is compressed by a factor of If the graph is either stretched or compressed and also reflected about the x-axis.
1. の値を見分ける。2. 値域のすべての値に を掛ける。3. ならグラフは 倍に伸びる。 ならグラフは 倍に縮む。 ならグラフは伸びるか縮むかしたうえで、x軸に関して折り返される。
Example 13例13
Graphing a Vertical Stretch縦の拡大のグラフを描く
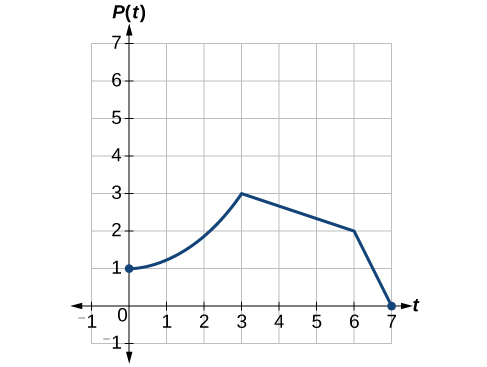
A function models the population of fruit flies. The graph is shown in Figure 20.
関数 はショウジョウバエの個体数を表す。そのグラフを図20に示す。
A scientist is comparing this population to another population, whose growth follows the same pattern, but is twice as large. Sketch a graph of this population.
ある科学者が、この個体群を別の個体群 と比べている。後者は同じ型で増えるが、数はつねに2倍である。この個体群のグラフの概形を描け。
Solution 解答
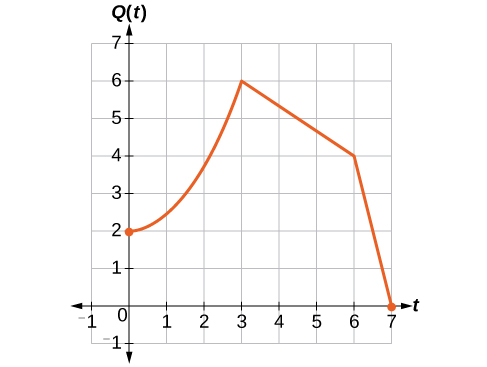
Because the population is always twice as large, the new population’s output values are always twice the original function’s output values. Graphically, this is shown in Figure 21.
個体数がつねに2倍なので、新しい個体群の出力値はつねにもとの関数の出力値の2倍である。図21にそれを示す。
If we choose four reference points, (0, 1), (3, 3), (6, 2) and (7, 0) we will multiply all of the outputs by 2.
基準となる四点 (0, 1)、(3, 3)、(6, 2)、(7, 0) を選び、すべての出力に2を掛ける。
The following shows where the new points for the new graph will be located.
新しいグラフの点がどこに来るかを次に示す。
Symbolically, the relationship is written as
記号で書くと、この関係は次のようになる。
This means that for any input the value of the function is twice the value of the function Notice that the effect on the graph is a vertical stretching of the graph, where every point doubles its distance from the horizontal axis. The input values, stay the same while the output values are twice as large as before.
これは、どの入力 についても関数 の値が関数 の値の2倍であることを意味する。グラフへの効き方は縦の拡大であり、どの点も横の軸からの距離が2倍になることに注意せよ。入力値 は変わらず、出力値だけが前の2倍になる。
How To 手順
Given a tabular function and assuming that the transformation is a vertical stretch or compression, create a table for a vertical compression.
表で表された関数が与えられ、変形が縦の拡大または縮小だとして、縦の縮小の表を作る。
1. Determine the value of 2. Multiply all of the output values by
1. の値を決める。2. すべての出力値に を掛ける。
Example 14例14
Finding a Vertical Compression of a Tabular Function表で表された関数の縦の縮小を求める
A function is given as Table 10. Create a table for the function
表10に関数 が与えられている。関数 の表を作れ。
| 2 | 4 | 6 | 8 | |
| 1 | 3 | 7 | 11 |
Solution 解答
The formula tells us that the output values of are half of the output values of with the same inputs. For example, we know that Then
式 は、同じ入力に対する の出力値が の出力値の半分であることを教えてくれる。たとえば と分かっている。すると
We do the same for the other values to produce Table 11.
残りの値についても同じようにして表11を作る。
Analysis 考察
The result is that the function has been compressed vertically by Each output value is divided in half, so the graph is half the original height.
その結果、関数 は縦に 倍に縮んだ。各出力値が半分になるので、グラフの高さはもとの半分になる。
Try It #9やってみよう9
A function is given as Table 12. Create a table for the function
表12に関数 が与えられている。関数 の表を作れ。
| 2 | 4 | 6 | 8 | |
| 12 | 16 | 20 | 0 |
Example 15例15
Recognizing a Vertical Stretch縦の拡大を見分ける
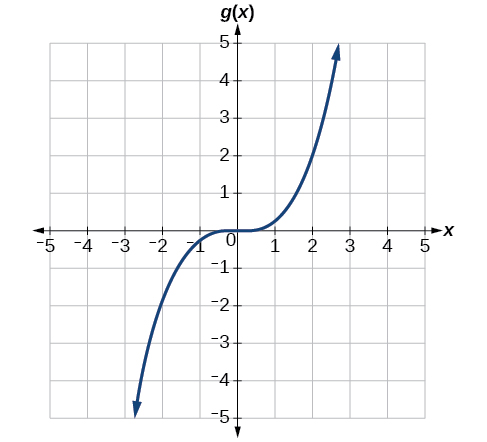
The graph in Figure 22 is a transformation of the toolkit function Relate this new function to and then find a formula for
図22のグラフは、道具となる関数 の変形である。この新しい関数 を と結びつけ、そのうえで の式を求めよ。
Solution 解答
When trying to determine a vertical stretch or shift, it is helpful to look for a point on the graph that is relatively clear. In this graph, it appears that With the basic cubic function at the same input, Based on that, it appears that the outputs of are the outputs of the function because From this we can fairly safely conclude that
縦の拡大や平行移動を決めようとするときは、はっきり読み取れる点をグラフ上に探すとよい。このグラフでは に見える。同じ入力での基本の三次関数では である。これをもとにすると、 なので、 の出力は関数 の出力の 倍に見える。ここから とかなり安全に結論できる。
We can write a formula for by using the definition of the function
関数 の定義を使えば、 の式を書ける。
Try It #10やってみよう10
Write the formula for the function that we get when we stretch the identity toolkit function by a factor of 3, and then shift it down by 2 units.
道具となる恒等関数を3倍に伸ばし、そのうえで下へ2だけ動かして得られる関数の式を書け。
Horizontal Stretches and Compressions横の拡大と縮小
Now we consider changes to the inside of a function. When we multiply a function’s input by a positive constant, we get a function whose graph is stretched or compressed horizontally in relation to the graph of the original function. If the constant is between 0 and 1, we get a horizontal stretch; if the constant is greater than 1, we get a horizontal compression of the function.
ここでは関数の内側への変更を考える。関数の入力に正の定数を掛けると、もとの関数のグラフに対して横に伸びたり縮んだりしたグラフの関数が得られる。定数が0と1のあいだなら横の拡大、1より大きければ横の縮小になる。
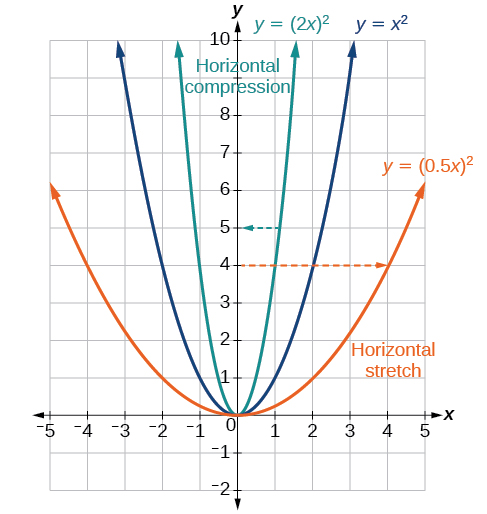
Given a function the form results in a horizontal stretch or compression. Consider the function Observe Figure 23. The graph of is a horizontal stretch of the graph of the function by a factor of 2. The graph of is a horizontal compression of the graph of the function by a factor of .
関数 が与えられたとき、 の形は横の拡大または縮小をもたらす。関数 を考えよ。図23を見よ。 のグラフは関数 のグラフを横に2倍に伸ばしたものである。 のグラフは関数 のグラフを横に 倍に縮めたものである。
Horizontal Stretches and Compressions 横方向の拡大・縮小
Given a function a new function where is a constant, is a horizontal stretch or horizontal compression of the function
関数 が与えられたとき、定数 を使った新しい関数 は、関数 の横の拡大または横の縮小である。
• If then the graph will be compressed by • If then the graph will be stretched by • If then there will be combination of a horizontal stretch or compression with a horizontal reflection.
・ ならグラフは 倍に縮む。・ ならグラフは 倍に伸びる。・ なら、横の拡大または縮小と横の対称移動が組み合わさる。
How To 手順
Given a description of a function, sketch a horizontal compression or stretch.
関数の説明が与えられたとき、横の縮小または拡大の概形を描く。
1. Write a formula to represent the function.2. Set where for a compression or for a stretch.
1. その関数を表す式を書く。2. とおく。縮小なら 、拡大なら とする。
Example 16例16
Graphing a Horizontal Compression横の縮小のグラフを描く
Suppose a scientist is comparing a population of fruit flies to a population that progresses through its lifespan twice as fast as the original population. In other words, this new population, will progress in 1 hour the same amount as the original population does in 2 hours, and in 2 hours, it will progress as much as the original population does in 4 hours. Sketch a graph of this population.
ある科学者が、ショウジョウバエの個体群を、一生の進み方がもとの個体群の2倍速い個体群と比べているとしよう。言い換えると、この新しい個体群 は1時間でもとの個体群の2時間分だけ進み、2時間でもとの個体群の4時間分だけ進む。この個体群のグラフの概形を描け。
Solution 解答
Symbolically, we could write
記号で書くと、次のようになる。
See Figure 24 for a graphical comparison of the original population and the compressed population.
もとの個体群と縮んだ個体群のグラフの比較は図24を見よ。
![Two side-by-side graphs. The first graph has function for original population whose domain is [0,7] and range is [0,3]. The maximum value occurs at (3,3). The second graph has the same shape as the first except it is half as wide. It is a graph of transformed population, with a domain of [0, 3.5] and a range of [0,3]. The maximum occurs at (1.5, 3).](img/d5958ef561d803922a3f671f067bb224dcf8fc6b.jpg)
Analysis 考察
Note that the effect on the graph is a horizontal compression where all input values are half of their original distance from the vertical axis.
グラフへの効き方は横の縮小であり、すべての入力値が縦の軸からのもとの距離の半分になることに注意せよ。
Example 17例17
Finding a Horizontal Stretch for a Tabular Function表で表された関数の横の拡大を求める
A function is given as Table 13. Create a table for the function
表13に関数 が与えられている。関数 の表を作れ。
| 2 | 4 | 6 | 8 | |
| 1 | 3 | 7 | 11 |
Solution 解答
The formula tells us that the output values for are the same as the output values for the function at an input half the size. Notice that we do not have enough information to determine because and we do not have a value for in our table. Our input values to will need to be twice as large to get inputs for that we can evaluate. For example, we can determine
式 は、 の出力値が、半分の大きさの入力での関数 の出力値と同じであることを教えてくれる。 を決めるだけの情報が無いことに注意せよ。 であり、表に の値が無いからである。 の値を求められる入力を得るには、 への入力値を2倍にする必要がある。たとえば は決められる。
We do the same for the other values to produce Table 14.
残りの値についても同じようにして表14を作る。
| 4 | 8 | 12 | 16 | |
| 1 | 3 | 7 | 11 |
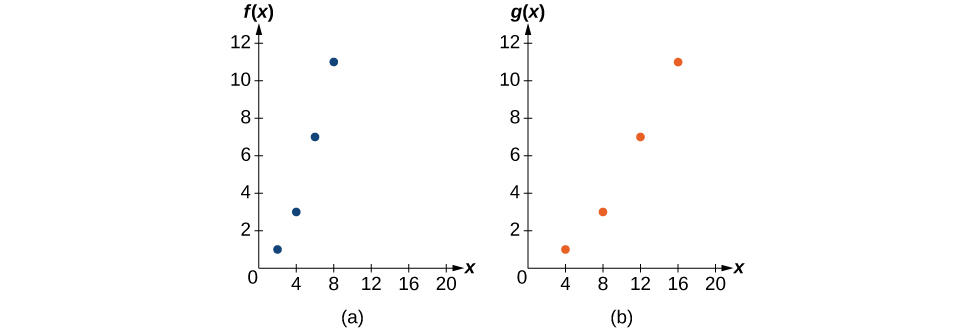
Figure 25 shows the graphs of both of these sets of points.
図25に、この二組の点のグラフを示す。
Analysis 考察
Because each input value has been doubled, the result is that the function has been stretched horizontally by a factor of 2.
各入力値が2倍になったので、その結果、関数 は横に2倍に伸びた。
Example 18例18
Recognizing a Horizontal Compression on a Graphグラフから横の縮小を見分ける
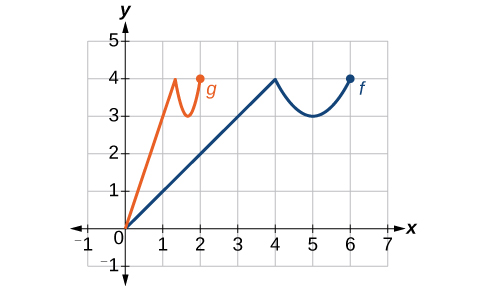
Relate the function to in Figure 26.
図26の関数 を と結びつけよ。
Solution 解答
The graph of looks like the graph of horizontally compressed. Because ends at and ends at we can see that the values have been compressed by because We might also notice that and Either way, we can describe this relationship as This is a horizontal compression by
のグラフは、 のグラフを横に縮めたものに見える。 が で終わり、 が で終わるので、 より の値が 倍に縮んでいることが分かる。 と に気づいてもよい。いずれにせよ、この関係は と述べられる。これは 倍の横の縮小である。
Analysis 考察
Notice that the coefficient needed for a horizontal stretch or compression is the reciprocal of the stretch or compression. So to stretch the graph horizontally by a scale factor of 4, we need a coefficient of in our function: This means that the input values must be four times larger to produce the same result, requiring the input to be larger, causing the horizontal stretching.
横の拡大や縮小に要る係数が、その拡大や縮小の倍率の逆数であることに注意せよ。よってグラフを横に4倍に伸ばすには、関数の中に という係数が要る。 である。これは同じ結果を出すのに入力値が4倍大きくなければならないという意味であり、より大きい入力が要ることが横の拡大をもたらす。
Try It #11やってみよう11
Write a formula for the toolkit square root function horizontally stretched by a factor of 3.
道具となる平方根の関数を横に3倍に伸ばした関数の式を書け。