第5章連続確率変数
5.2 The Uniform Distribution5.2 一様分布
The uniform distribution is a continuous probability distribution and is concerned with events that are equally likely to occur. When working out problems that have a uniform distribution, be careful to note if the data is inclusive or exclusive of endpoints.
英語のヒント
一様分布は連続確率分布であり、同様に確からしく起こる事象を扱う。一様分布の問題を解くときは、データに端点を含むか含まないかに注意しよう。
Example 5.2例題 5.2
The data in Table 5.1 are 55 smiling times, in seconds, of an eight-week-old baby.
表5.1は、生後8週間の赤ちゃんがほほ笑んでいた時間を秒単位で記録した55個のデータである。
10.4 |
19.6 |
18.8 |
13.9 |
17.8 |
16.8 |
21.6 |
17.9 |
12.5 |
11.1 |
4.9 |
12.8 |
14.8 |
22.8 |
20.0 |
15.9 |
16.3 |
13.4 |
17.1 |
14.5 |
19.0 |
22.8 |
1.3 |
0.7 |
8.9 |
11.9 |
10.9 |
7.3 |
5.9 |
3.7 |
17.9 |
19.2 |
9.8 |
5.8 |
6.9 |
2.6 |
5.8 |
21.7 |
11.8 |
3.4 |
2.1 |
4.5 |
6.3 |
10.7 |
8.9 |
9.4 |
9.4 |
7.6 |
10.0 |
3.3 |
6.7 |
7.8 |
11.6 |
13.8 |
18.6 |
The sample mean = 11.65 and the sample standard deviation = 6.08.
標本平均 = 11.65、標本標準偏差 = 6.08である。
We will assume that the smiling times, in seconds, follow a uniform distribution between zero and 23 seconds, inclusive. This means that any smiling time from zero to and including 23 seconds is equally likely. The histogram that could be constructed from the sample is an empirical distribution that closely matches the theoretical uniform distribution.
英語のヒント
ほほ笑む時間は秒単位で、0秒から23秒まで両端を含む一様分布に従うと仮定する。つまり、0秒から23秒までのどの時間も同様に確からしい。標本から作るヒストグラムは経験分布であり、理論的な一様分布によく一致する。
Let X = length, in seconds, of an eight-week-old baby's smile.
X = 生後8週間の赤ちゃんがほほ笑む時間(秒)とする。
The notation for the uniform distribution is
一様分布は次のように表す。
X ~ U(a, b) where a = the lowest value of x and b = the highest value of x.
X ~ U(a, b)。ここでa = xの最小値、b = xの最大値である。
The probability density function is f(x) = for a ≤ x ≤ b.
確率密度関数は、a ≤ x ≤ bでf(x) = である。
For this example, x ~ U(0, 23) and f(x) = for 0 ≤ X ≤ 23.
この例では、x ~ U(0, 23)で、0 ≤ X ≤ 23においてf(x) = である。
Formulas for the theoretical mean and standard deviation are
理論上の平均と標準偏差の公式は、
and
および
For this problem, the theoretical mean and standard deviation are
この問題の理論上の平均と標準偏差は、
μ = = 11.50 seconds and σ = = 6.64 seconds.
μ = = 11.50秒、σ = = 6.64秒である。
Notice that the theoretical mean and standard deviation are close to the sample mean and standard deviation in this example.
この例では、理論上の平均と標準偏差が標本平均と標本標準偏差に近いことに注意しよう。
Example 5.3例題 5.3
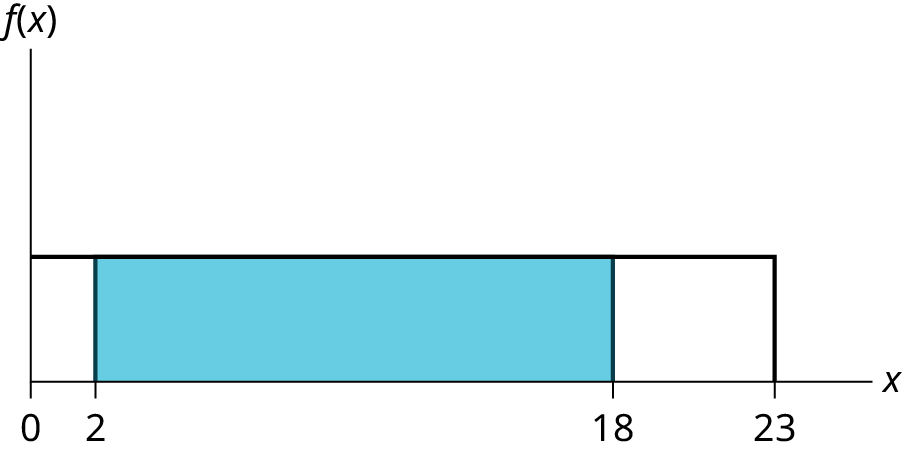
a. Refer to Example 5.2. What is the probability that a randomly chosen eight-week-old baby smiles between two and 18 seconds?
a. 例5.2を参照せよ。無作為に選んだ生後8週間の赤ちゃんが、2秒から18秒の間ほほ笑む確率はいくらか。
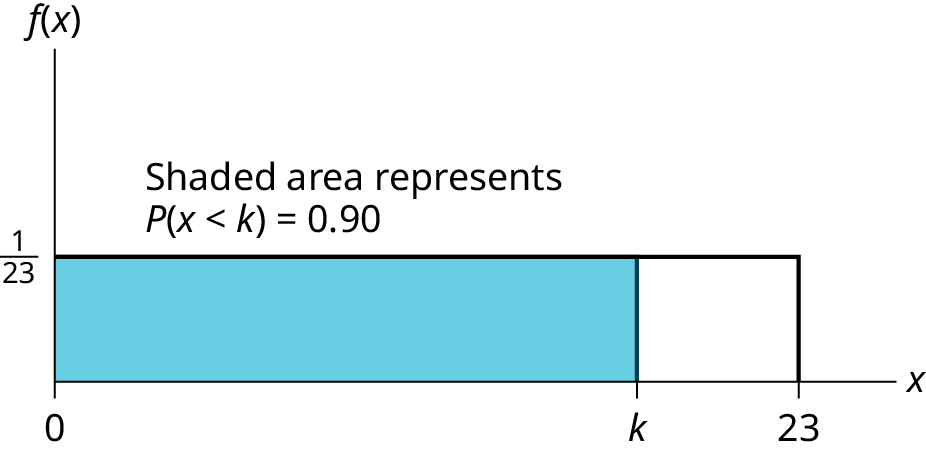
b. Find the 90th percentile for an eight-week-old baby's smiling time.
b. 生後8週間の赤ちゃんがほほ笑む時間の第90パーセンタイルを求めよ。
c. Find the probability that a random eight-week-old baby smiles more than 12 seconds KNOWING that the baby smiles MORE THAN EIGHT SECONDS.
c. 赤ちゃんがすでに8秒を超えてほほ笑んでいると分かっているとき、無作為に選んだ生後8週間の赤ちゃんが12秒を超えてほほ笑む確率を求めよ。
Solution解き方
c. This probability question is a conditional. You are asked to find the probability that an eight-week-old baby smiles more than 12 seconds when you already know the baby has smiled for more than eight seconds.
c. これは条件付き確率の問題である。赤ちゃんがすでに8秒を超えてほほ笑んでいると分かっているとき、生後8週間の赤ちゃんが12秒を超えてほほ笑む確率を求める。
Find P(x > 12|x > 8) There are two ways to do the problem. For the first way, use the fact that this is a conditional and changes the sample space. The graph illustrates the new sample space. You already know the baby smiled more than eight seconds.
P(x > 12|x > 8)を求める。解き方は二つある。1番目は、条件付きであることにより標本空間が変わる点を使う。グラフは新しい標本空間を示す。赤ちゃんが8秒を超えてほほ笑んだことは、すでに分かっている。
Write a new f(x): f(x) = = for 8 < x < 23
新しいf(x)を書く。8 < x < 23で、f(x) = = となる。
P(x > 12|x > 8) = (23 − 12) =
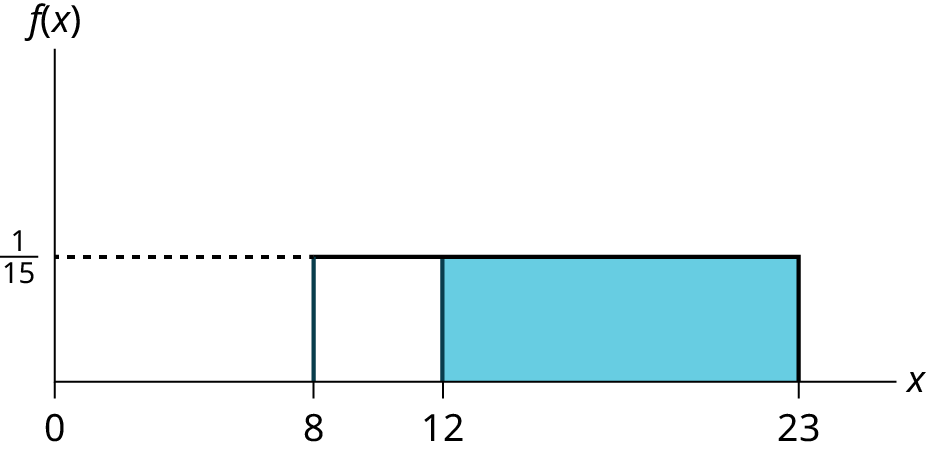
Figure 5.22図 5.22
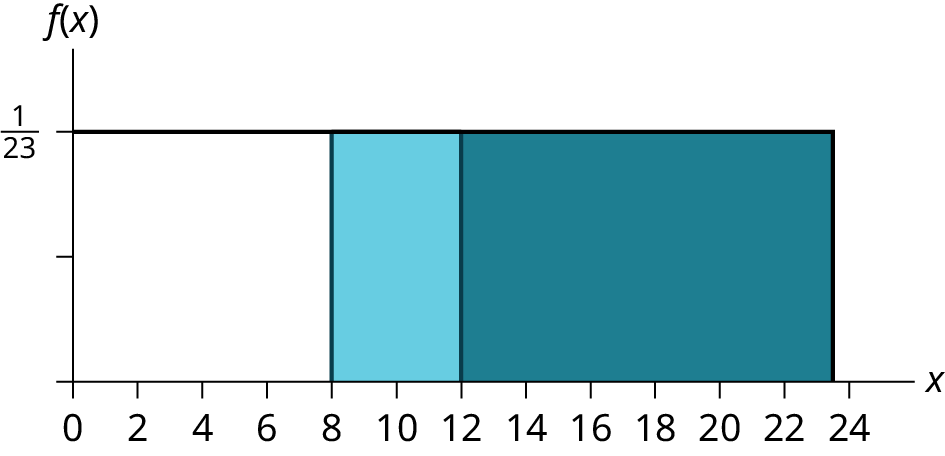
For the second way, use the conditional formula from Probability Topics with the original distribution X ~ U (0, 23):
2番目の方法では、元の分布X ~ U(0, 23)に対し、「確率の話題」の条件付き確率の公式を使う。
P(A|B) =
For this problem, A is (x > 12) and B is (x > 8).
この問題では、Aは(x > 12)、Bは(x > 8)である。
So, P(x > 12|x > 8) =
したがって、P(x > 12|x > 8) = となる。
Example 5.4例題 5.4
The amount of time, in minutes, that a person must wait for a bus is uniformly distributed between zero and 15 minutes, inclusive.
バスを待つ時間は、0分から15分まで両端を含む一様分布に従う。
a. What is the probability that a person waits fewer than 12.5 minutes?
a. 待ち時間が12.5分未満である確率はいくらか。
b. On the average, how long must a person wait? Find the mean, μ, and the standard deviation, σ.
b. 平均して何分待つ必要があるか。平均μと標準偏差σを求めよ。
c. Ninety percent of the time, the time a person must wait falls below what value?
c. 待ち時間の90%は、どの値より小さいか。
Solution解き方
a. Let X = the number of minutes a person must wait for a bus. a = 0 and b = 15. X ~ U(0, 15). Write the probability density function. f (x) = = for 0 ≤ x ≤ 15.
a. X = バスを待つ時間(分)とする。a = 0、b = 15で、X ~ U(0, 15)である。確率密度関数を書くと、0 ≤ x ≤ 15でf(x) = = となる。
Find P (x < 12.5). Draw a graph.
P(x < 12.5)を求める。グラフを描く。
The probability a person waits less than 12.5 minutes is 0.8333.
待ち時間が12.5分未満である確率は0.8333である。
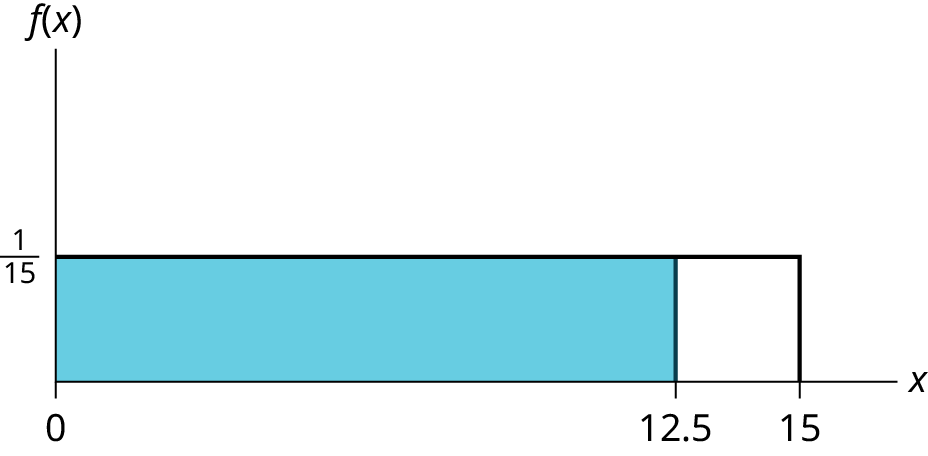
Figure 5.24図 5.24
b. μ = = = 7.5. On the average, a person must wait 7.5 minutes.
σ = = 4.3. The Standard deviation is 4.3 minutes.
σ = = 4.3. The Standard deviation is 4.3 minutes.
b. μ = = = 7.5。平均して7.5分待つ必要がある。σ = = 4.3で、標準偏差は4.3分である。
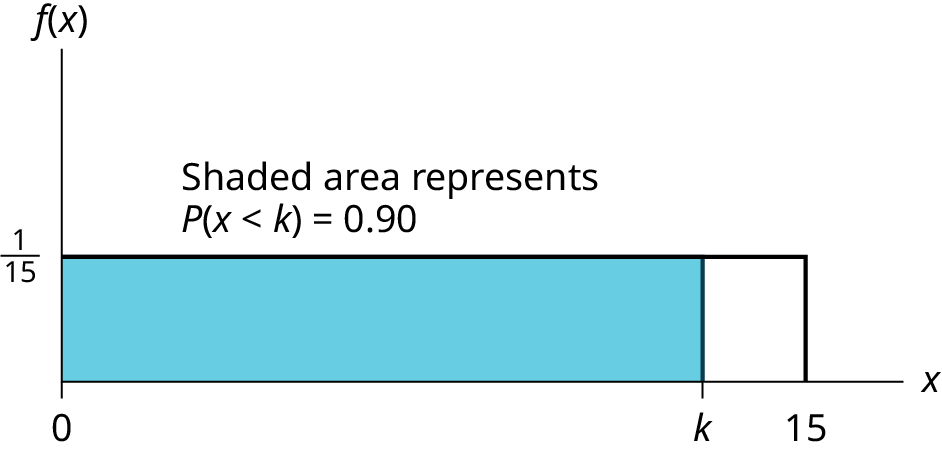
c. Find the 90th percentile. Draw a graph. Let k = the 90th percentile.
k is sometimes called a critical value.
The 90th percentile is 13.5 minutes. Ninety percent of the time, a person must wait at most 13.5 minutes.
k is sometimes called a critical value.
The 90th percentile is 13.5 minutes. Ninety percent of the time, a person must wait at most 13.5 minutes.
英語のヒント
c. 第90パーセンタイルを求める。グラフを描く。k = 第90パーセンタイルとする。 kは臨界値と呼ばれることもある。第90パーセンタイルは13.5分である。90%の場合、待ち時間は13.5分以下となる。
Example 5.5例題 5.5
Suppose the time it takes a nine-year old to eat a donut is between 0.5 and 4 minutes, inclusive. Let X = the time, in minutes, it takes a nine-year old child to eat a donut. Then X ~ U (0.5, 4).
9歳の子どもがドーナツを食べる時間は、0.5分から4分まで両端を含む範囲にあるとする。X = 9歳の子どもがドーナツを食べる時間(分)とする。このとき、X ~ U(0.5, 4)である。
a. The probability that a randomly selected nine-year old child eats a donut in at least two minutes is _______.
a. 無作為に選んだ9歳の子どもがドーナツを食べるのに少なくとも2分かかる確率は_______である。
b. Find the probability that a different nine-year old child eats a donut in more than two minutes given that the child has already been eating the donut for more than 1.5 minutes.
英語のヒント
b. 別の9歳の子どもがすでに1.5分を超えてドーナツを食べ続けているとき、食べ終わるまでに2分を超える確率を求めよ。
The second question has a conditional probability. You are asked to find the probability that a nine-year old child eats a donut in more than two minutes given that the child has already been eating the donut for more than 1.5 minutes. Solve the problem two different ways (see Example 5.3). You must reduce the sample space. First way: Since you know the child has already been eating the donut for more than 1.5 minutes, you are no longer starting at a = 0.5 minutes. Your starting point is 1.5 minutes.
2番目の問いは条件付き確率である。9歳の子どもがすでに1.5分を超えてドーナツを食べ続けているとき、食べ終わるまでに2分を超える確率を求める。二通りの方法で解け(例5.3参照)。標本空間を狭める必要がある。1番目の方法:すでに1.5分を超えて食べ続けていると分かっているので、出発点はa = 0.5分ではなく1.5分となる。
Write a new f(x):
新しいf(x)を書く。
f(x) = = for 1.5 ≤ x ≤ 4.
1.5 ≤ x ≤ 4で、f(x) = = 。
Find P(x > 2|x > 1.5). Draw a graph.
P(x > 2|x > 1.5)を求める。グラフを描く。
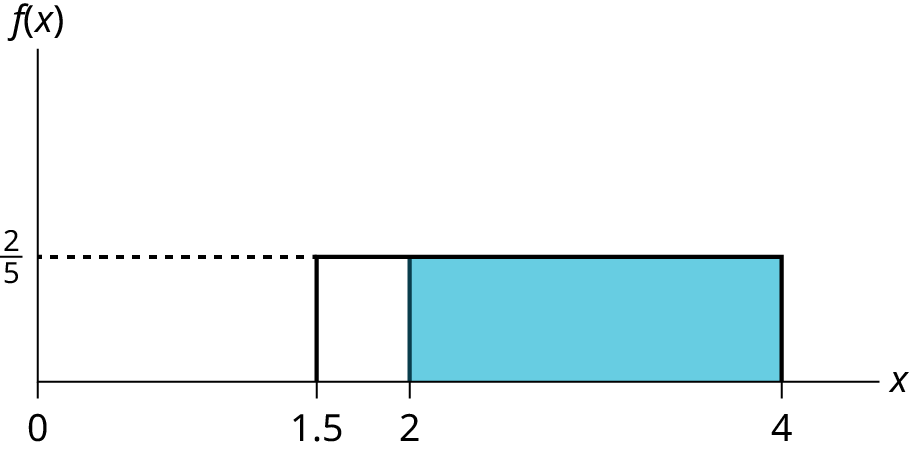
Figure 5.26図 5.26
P(x > 2|x > 1.5) = (base)(new height) = (4 − 2)
P(x > 2|x > 1.5) = (底辺)(新しい高さ)= (4 − 2)
Solution解き方
a. 0.5714
b.
The probability that a nine-year old child eats a donut in more than two minutes given that the child has already been eating the donut for more than 1.5 minutes is .
9歳の子どもがすでに1.5分を超えてドーナツを食べ続けているとき、食べ終わるまでに2分を超える確率はである。
Second way: Draw the original graph for X ~ U (0.5, 4). Use the conditional formula
2番目の方法:X ~ U(0.5, 4)の元のグラフを描く。条件付き確率の公式を使う。
P(x > 2|x > 1.5) =
Example 5.6例題 5.6
Ace Heating and Air Conditioning Service finds that the amount of time a repair tech needs to fix a furnace is uniformly distributed between 1.5 and four hours. Let x = the time needed to fix a furnace. Then x ~ U (1.5, 4).
英語のヒント
Ace Heating and Air Conditioning Serviceでは、修理技術者が暖房炉を直す時間は1.5時間から4時間の一様分布に従うと分かっている。x = 暖房炉の修理時間とする。このとき、x ~ U(1.5, 4)である。
- Find the probability that a randomly selected furnace repair requires more than two hours.無作為に選んだ暖房炉の修理に2時間より長くかかる確率を求めよ。
- Find the probability that a randomly selected furnace repair requires less than three hours.無作為に選んだ暖房炉の修理時間が3時間未満である確率を求めよ。
- Find the 30th percentile of furnace repair times.暖房炉の修理時間の第30パーセンタイルを求めよ。
- The longest 25% of furnace repair times take at least how long? (In other words: find the minimum time for the longest 25% of repair times.) What percentile does this represent?修理時間の長いほうの25%は、少なくとも何時間かかるか(言い換えると、長いほうの25%に入る修理時間の最小値を求めよ)。これは何パーセンタイルに当たるか。
- Find the mean and standard deviation平均と標準偏差を求めよ。
Solution解き方
a. To find f(x): f (x) = = so f(x) = 0.4
a. f(x)を求める。f(x) = = なので、f(x) = 0.4となる。
P(x > 2) = (base)(height) = (4 – 2)(0.4) = 0.8
P(x > 2) = (底辺)(高さ)= (4 − 2)(0.4) = 0.8
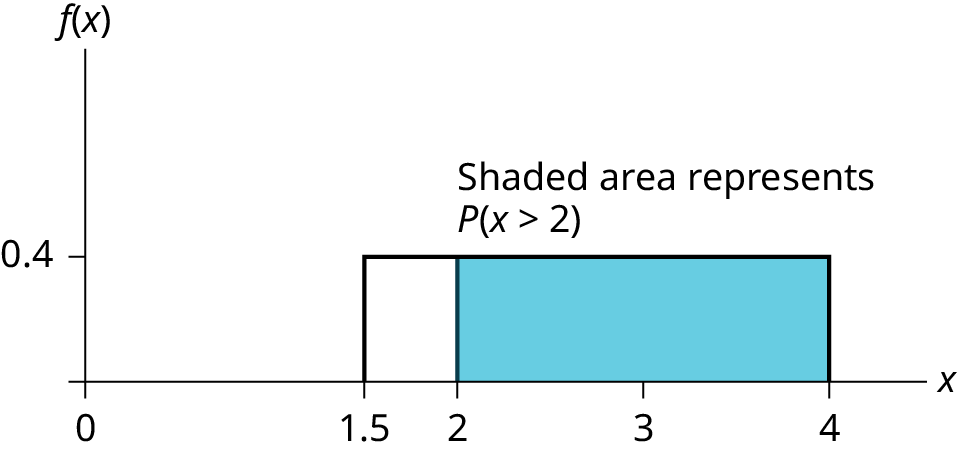
Figure 5.27図 5.27
Uniform Distribution between 1.5 and four with shaded area between two and four representing the probability that the repair time x is greater than two
1.5から4の一様分布。2から4の着色部分は、修理時間xが2より大きい確率を表す。
b. P(x < 3) = (base)(height) = (3 – 1.5)(0.4) = 0.6
b. P(x < 3) = (底辺)(高さ)= (3 − 1.5)(0.4) = 0.6
The graph of the rectangle showing the entire distribution would remain the same. However the graph should be shaded between x = 1.5 and x = 3. Note that the shaded area starts at x = 1.5 rather than at x = 0; since X ~ U (1.5, 4), x can not be less than 1.5.
分布全体を表す長方形は変わらない。ただし、x = 1.5からx = 3までを着色する。着色部分がx = 0ではなくx = 1.5から始まることに注意しよう。X ~ U(1.5, 4)なので、xは1.5未満にはならない。
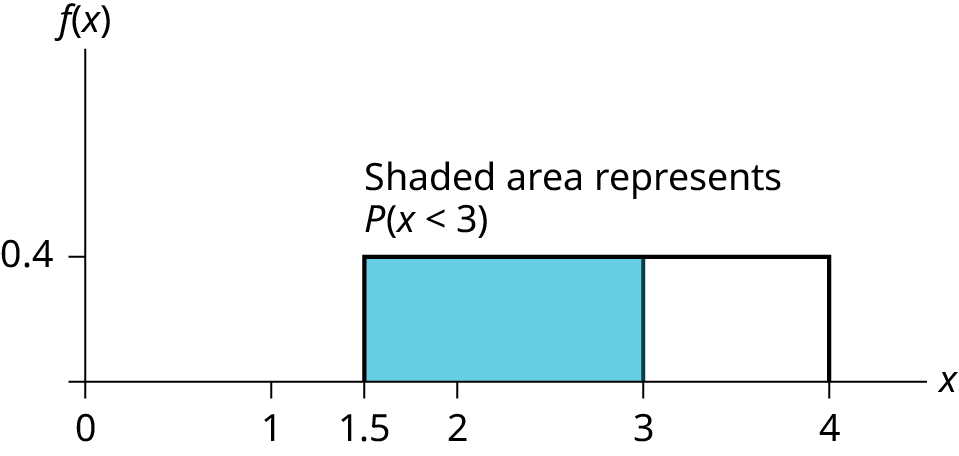
Figure 5.28図 5.28
Uniform Distribution between 1.5 and four with shaded area between 1.5 and three representing the probability that the repair time x is less than three
1.5から4の一様分布。1.5から3の着色部分は、修理時間xが3未満である確率を表す。
c.
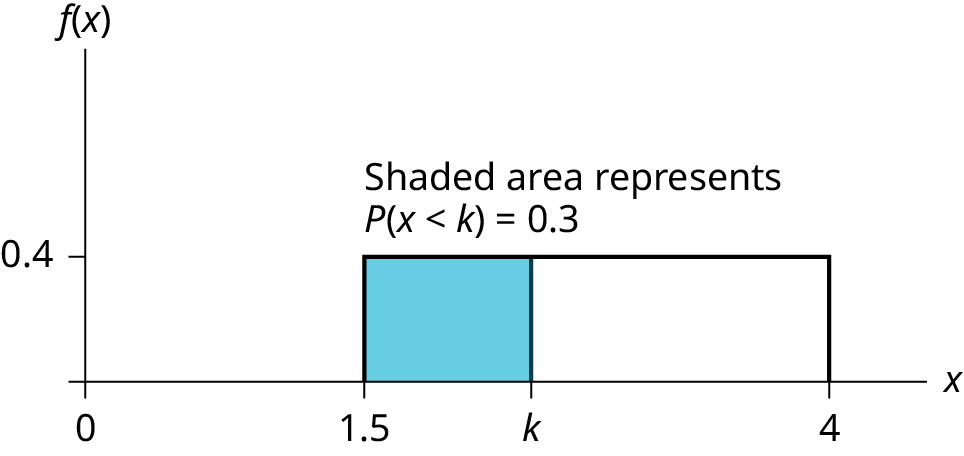
Figure 5.29図 5.29
Uniform Distribution between 1.5 and 4 with an area of 0.30 shaded to the left, representing the shortest 30% of repair times.
1.5から4の一様分布。左側の面積0.30を着色し、修理時間の短いほうの30%を表す。
P (x < k) = 0.30
P(x < k) = (base)(height) = (k – 1.5)(0.4)
0.3 = (k – 1.5) (0.4); Solve to find k:
0.75 = k – 1.5, obtained by dividing both sides by 0.4
k = 2.25 , obtained by adding 1.5 to both sides
The 30th percentile of repair times is 2.25 hours. 30% of repair times are 2.25 hours or less.
P(x < k) = 0.30。P(x < k) = (底辺)(高さ)= (k − 1.5)(0.4)。0.3 = (k − 1.5)(0.4)をkについて解く。両辺を0.4で割ると0.75 = k − 1.5、両辺に1.5を足すとk = 2.25となる。修理時間の第30パーセンタイルは2.25時間である。修理時間の30%は2.25時間以下となる。
d.
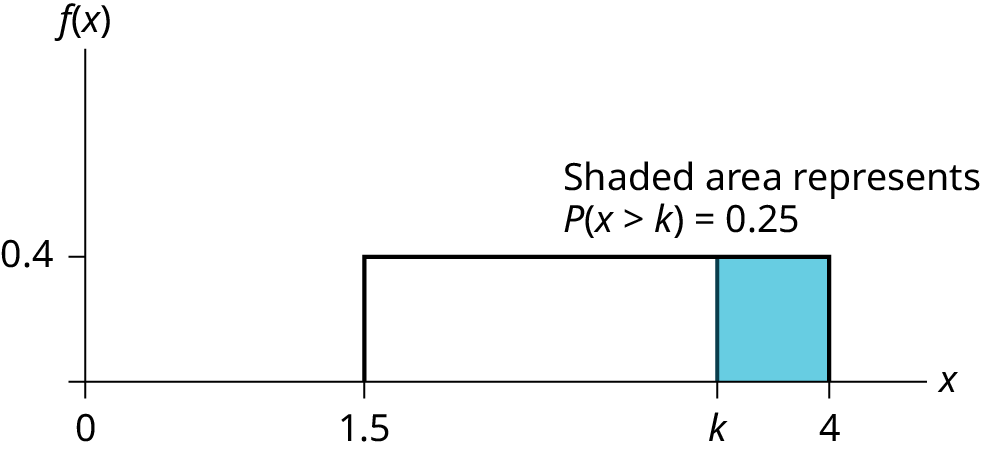


Figure 5.30図 5.30
Uniform Distribution between 1.5 and 4 with an area of 0.25 shaded to the right representing the longest 25% of repair times.
1.5から4の一様分布。右側の面積0.25を着色し、修理時間の長いほうの25%を表す。
P(x > k) = 0.25
P(x > k) = (base)(height) = (4 – k)(0.4)
0.25 = (4 – k)(0.4); Solve for k:
0.625 = 4 − k,
obtained by dividing both sides by 0.4
−3.375 = −k,
obtained by subtracting four from both sides: k = 3.375
The longest 25% of furnace repairs take at least 3.375 hours (3.375 hours or longer).
Note: Since 25% of repair times are 3.375 hours or longer, that means that 75% of repair times are 3.375 hours or less. 3.375 hours is the 75th percentile of furnace repair times.
P(x > k) = 0.25。P(x > k) = (底辺)(高さ)= (4 − k)(0.4)。0.25 = (4 − k)(0.4)をkについて解く。両辺を0.4で割ると0.625 = 4 − k、両辺から4を引くと−3.375 = −k、したがってk = 3.375となる。暖房炉の修理で長いほうの25%は、少なくとも3.375時間(3.375時間以上)かかる。注意:修理時間の25%が3.375時間以上ということは、75%が3.375時間以下であることを意味する。3.375時間は修理時間の第75パーセンタイルである。
e. and
hours and hours
hours and hours
e. および。時間、時間である。