第5章連続確率変数
Chapter Review章の復習
If X has a uniform distribution where a < x < b or a ≤ x ≤ b, then X takes on values between a and b (may include a and b). All values x are equally likely. We write X ∼ U(a, b). The mean of X is . The standard deviation of X is . The probability density function of X is for a ≤ x ≤ b. The cumulative distribution function of X is P(X ≤ x) = . X is continuous.
Xがa < x < bまたはa ≤ x ≤ bの一様分布に従うとき、Xはaとbの間の値を取る(aとbを含むこともある)。すべての値xは同様に確からしい。X ∼ U(a, b)と書く。Xの平均は、標準偏差はである。確率密度関数はa ≤ x ≤ bで、累積分布関数はP(X ≤ x) = である。Xは連続型である。
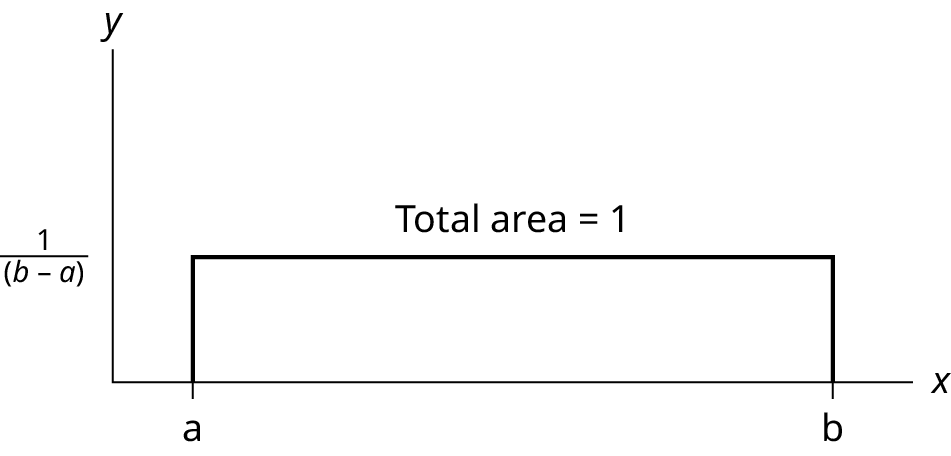
Figure 5.31図 5.31
The probability P(c < X < d) may be found by computing the area under f(x), between c and d. Since the corresponding area is a rectangle, the area may be found simply by multiplying the width and the height.
確率P(c < X < d)は、cとdの間のf(x)の下の面積を計算して求められる。対応する領域は長方形なので、幅と高さを掛けるだけで面積が求まる。
Formula Review公式の復習
X = a real number between a and b (in some instances, X can take on the values a and b). a = smallest X; b = largest X
X = aとbの間の実数(場合によってはaとbの値も取る)。a = Xの最小値、b = Xの最大値。
X ~ U (a, b)
The mean is
平均はである。
The standard deviation is
標準偏差はである。
Probability density function: for
確率密度関数:で
Area to the Left of x: P(X < x) = (x – a)
xより左の面積:P(X < x) = (x − a)
Area to the Right of x: P(X > x) = (b – x)
xより右の面積:P(X > x) = (b − x)
Area Between c and d: P(c < x < d) = (base)(height) = (d – c)
cとdの間の面積:P(c < x < d) = (底辺)(高さ)= (d − c)
Uniform: X ~ U(a, b) where a < x < b
一様分布:X ~ U(a, b)、a < x < b
- pdf: for a ≤ x ≤ bpdf:a ≤ x ≤ bで
- cdf: P(X ≤ x) =cdf:P(X ≤ x) =
- mean µ =平均μ =
- standard deviation σ標準偏差σ
- P(c < X < d) = (d – c)
References参考文献
McDougall, John A. The McDougall Program for Maximum Weight Loss. Plume, 1995.
ジョン・A・マクドゥーガル『最大の減量を目指すマクドゥーガル・プログラム』、Plume、1995年。
Exercises 18–27練習問題 18–27
Use the following information to answer the next ten questions. The data that follow are the square footage (in 1,000 feet squared) of 28 homes.
次の情報を使って、続く10問に答えよ。次のデータは住宅28軒の面積(1,000平方フィート単位)である。
1.5 |
2.4 |
3.6 |
2.6 |
1.6 |
2.4 |
2.0 |
3.5 |
2.5 |
1.8 |
2.4 |
2.5 |
3.5 |
4.0 |
2.6 |
1.6 |
2.2 |
1.8 |
3.8 |
2.5 |
1.5 |
2.8 |
1.8 |
4.5 |
1.9 |
1.9 |
3.1 |
1.6 |
The sample mean = 2.50 and the sample standard deviation = 0.8302.
標本平均 = 2.50、標本標準偏差 = 0.8302である。
The distribution can be written as X ~ U(1.5, 4.5).
分布はX ~ U(1.5, 4.5)と表せる。
Exercise 18問題 18
What type of distribution is this?
これはどの種類の分布か。
Exercise 19問題 19
In this distribution, outcomes are equally likely. What does this mean?
この分布では、結果は同様に確からしい。これは何を意味するか。
Solution解き方
It means that the value of x is just as likely to be any number between 1.5 and 4.5.
xの値が1.5から4.5の間のどの数である可能性も同じ、という意味である。
Exercise 20問題 20
What is the height of f(x) for the continuous probability distribution?
この連続確率分布のf(x)の高さはいくらか。
Exercise 21問題 21
What are the constraints for the values of x?
英語のヒント
xの値にはどのような制約があるか。
Solution解き方
1.5 ≤ x ≤ 4.5
Exercise 22問題 22
Graph P(2 < x < 3).
P(2 < x < 3)を図示せよ。
Exercise 23問題 23
What is P(2 < x < 3)?
P(2 < x < 3)はいくらか。
Solution解き方
0.3333
Exercise 24問題 24
What is P(x < 3.5| x < 4)?
P(x < 3.5|x < 4)はいくらか。
Exercise 25問題 25
What is P(x = 1.5)?
P(x = 1.5)はいくらか。
Solution解き方
zero
0
Exercise 26問題 26
What is the 90th percentile of square footage for homes?
住宅の面積の第90パーセンタイルはいくらか。
Exercise 27問題 27
Find the probability that a randomly selected home has more than 3,000 square feet given that you already know the house has more than 2,000 square feet.
住宅の面積が2,000平方フィートを超えると分かっているとき、無作為に選んだ住宅が3,000平方フィートを超える確率を求めよ。
Solution解き方
0.6
Exercises 28–35練習問題 28–35
Use the following information to answer the next eight exercises. A distribution is given as X ~ U(0, 12).
次の情報を使って、続く8問に答えよ。分布がX ~ U(0, 12)と与えられている。
Exercise 28問題 28
What is a? What does it represent?
aはいくらか。何を表すか。
Exercise 29問題 29
What is b? What does it represent?
bはいくらか。何を表すか。
Solution解き方
b is 12, and it represents the highest value of x.
bは12で、xの最大値を表す。
Exercise 30問題 30
What is the probability density function?
確率密度関数は何か。
Exercise 31問題 31
What is the theoretical mean?
理論上の平均はいくらか。
Solution解き方
six
6
Exercise 32問題 32
What is the theoretical standard deviation?
理論上の標準偏差はいくらか。
Exercise 33問題 33
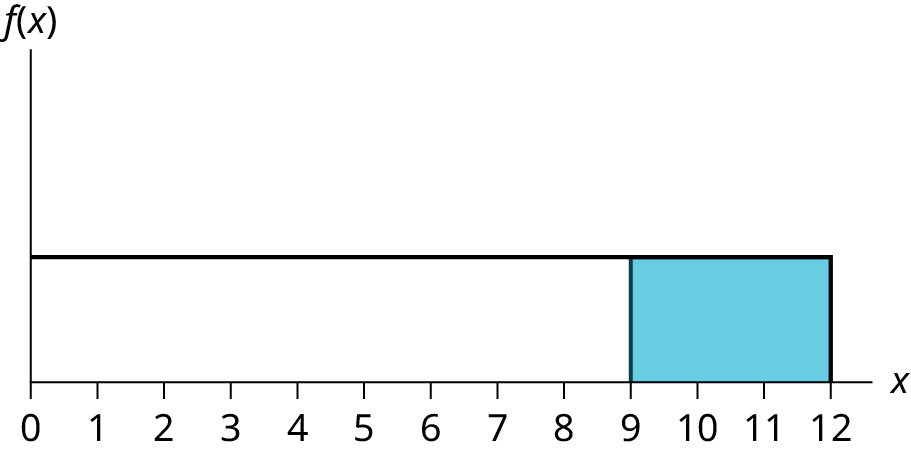
Draw the graph of the distribution for P(x > 9).
P(x > 9)を示す分布のグラフを描け。
Exercise 34問題 34
Find P(x > 9).
P(x > 9)を求めよ。
Exercise 35問題 35
Find the 40th percentile.
第40パーセンタイルを求めよ。
Solution解き方
4.8
Exercises 36–47練習問題 36–47
Use the following information to answer the next eleven exercises. The age of cars in the staff parking lot of a suburban college is uniformly distributed from six months (0.5 years) to 9.5 years.
英語のヒント
次の情報を使って、続く11問に答えよ。郊外の大学の職員用駐車場にある車の車齢は、6か月(0.5年)から9.5年の一様分布に従う。
Exercise 36問題 36
What is being measured here?
ここでは何を測定しているか。
Exercise 37問題 37
In words, define the random variable X.
確率変数Xを言葉で定義せよ。
Solution解き方
X = The age (in years) of cars in the staff parking lot
X = 職員用駐車場にある車の車齢(年)
Exercise 38問題 38
Are the data discrete or continuous?
データは離散型か、連続型か。
Exercise 39問題 39
The interval of values for x is ______.
xの値の区間は______である。
Solution解き方
0.5 to 9.5
0.5から9.5
Exercise 40問題 40
The distribution for X is ______.
Xの分布は______である。
Exercise 41問題 41
Write the probability density function.
確率密度関数を書け。
Solution解き方
f(x) = where x is between 0.5 and 9.5, inclusive.
xが0.5から9.5まで両端を含む範囲で、f(x) = である。
Exercise 42問題 42
Graph the probability distribution.
確率分布のグラフを描け。
- Sketch the graph of the probability distribution.確率分布のグラフを概略で描け。Figure 5.33図 5.33
- Identify the following values:次の値を示せ。
- Lowest value for : _______の最小値:_______
- Highest value for : _______の最大値:_______
- Height of the rectangle: _______長方形の高さ:_______
- Label for x-axis (words): _______x軸の名称(言葉で):_______
- Label for y-axis (words): _______y軸の名称(言葉で):_______

Exercise 43問題 43
Find the average age of the cars in the lot.
駐車場の車の平均車齢を求めよ。
Solution解き方
μ = 5
Exercise 44問題 44
Find the probability that a randomly chosen car in the lot was less than four years old.
駐車場から無作為に選んだ車の車齢が4年未満である確率を求めよ。
- Sketch the graph, and shade the area of interest.グラフの概形を描き、求める領域に陰影を付けよ。Figure 5.34図 5.34
- Find the probability. P(x < 4) = _______確率を求めよ。P(x < 4) = _______



Exercise 45問題 45
Considering only the cars less than 7.5 years old, find the probability that a randomly chosen car in the lot was less than four years old.
車齢7.5年未満の車だけを考えるとき、駐車場から無作為に選んだ車の車齢が4年未満である確率を求めよ。
- Sketch the graph, shade the area of interest.グラフを概略で描き、関心のある領域を着色せよ。Figure 5.35図 5.35
- Find the probability. P(x < 4|x < 7.5) = _______確率を求めよ。P(x < 4|x < 7.5) = _______
Solution解き方
- Answers may vary.解答は一通りではない。
Exercise 46問題 46
What has changed in the previous two problems that made the solutions different?
英語のヒント
直前の二つの問題では、何が変わったために答えが異なったのか。
Exercise 47問題 47
Find the third quartile of ages of cars in the lot. This means you will have to find the value such that , or 75%, of the cars are at most (less than or equal to) that age.
駐車場の車齢の第3四分位数を求めよ。これは、車の、すなわち75%がその車齢以下となる値を求めるという意味である。
- Sketch the graph, and shade the area of interest.グラフの概形を描き、求める領域に陰影を付けよ。Figure 5.36図 5.36
- Find the value k such that P(x < k) = 0.75.P(x < k) = 0.75となる値kを求めよ。
- The third quartile is _______第3四分位数は_______である。
Solution解き方
- Answers may vary.解答は一通りではない。
- k = 7.25
- 7.25