第5章連続確率変数
5.1 Continuous Probability Functions5.1 連続確率関数
We begin by defining a continuous probability density function. We use the function notation f(x). Intermediate algebra may have been your first formal introduction to functions. In the study of probability, the functions we study are special. We define the function f(x) so that the area between it and the x-axis is equal to a probability. Since the maximum probability is one, the maximum area is also one. For continuous probability distributions, PROBABILITY = AREA.
英語のヒント
まず連続確率密度関数を定義する。関数の表記f(x)を用いる。関数を初めて正式に学んだのは、代数の中級課程だったかもしれない。確率の学習で扱う関数は特別なものである。関数f(x)とx軸との間の面積が確率に等しくなるように、f(x)を定義する。確率の最大値は1なので、面積の最大値も1である。連続確率分布では、確率 = 面積である。
Example 5.1例題 5.1
Consider the function f(x) = for 0 ≤ x ≤ 20. x = a real number. The graph of f(x) = is a horizontal line. However, since 0 ≤ x ≤ 20, f(x) is restricted to the portion between x = 0 and x = 20, inclusive.
英語のヒント
0 ≤ x ≤ 20で関数f(x) = を考える。xは実数である。f(x) = のグラフは水平な直線である。ただし、0 ≤ x ≤ 20なので、f(x)はx = 0からx = 20までの両端を含む部分に限定される。
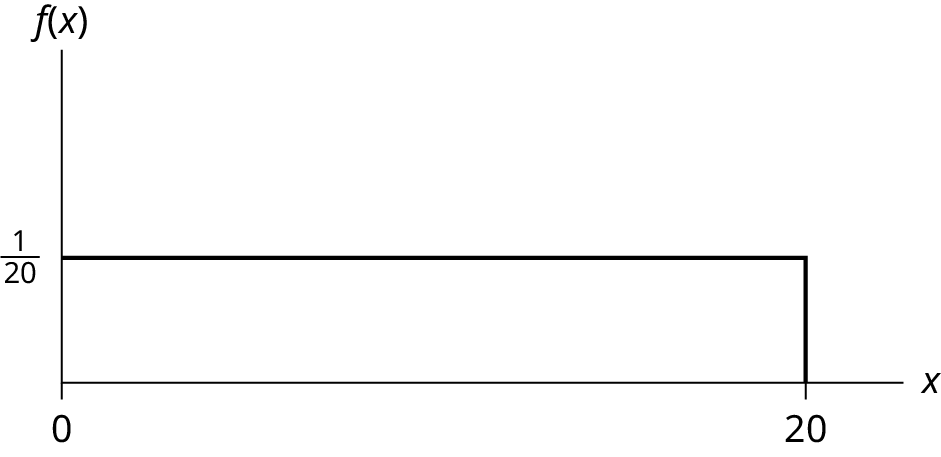
Figure 5.5図 5.5
f(x) = for 0 ≤ x ≤ 20.
0 ≤ x ≤ 20で、f(x) = 。
The graph of f(x) = is a horizontal line segment when 0 ≤ x ≤ 20.
0 ≤ x ≤ 20のとき、f(x) = のグラフは水平な線分である。
The area between f(x) = where 0 ≤ x ≤ 20 and the x-axis is the area of a rectangle with base = 20 and height = .
0 ≤ x ≤ 20におけるf(x) = とx軸との間の面積は、底辺20、高さの長方形の面積である。
Suppose we want to find the area between f(x) = and the x-axis where 0 < x < 2.
0 < x < 2の範囲で、f(x) = とx軸との間の面積を求めたいとする。
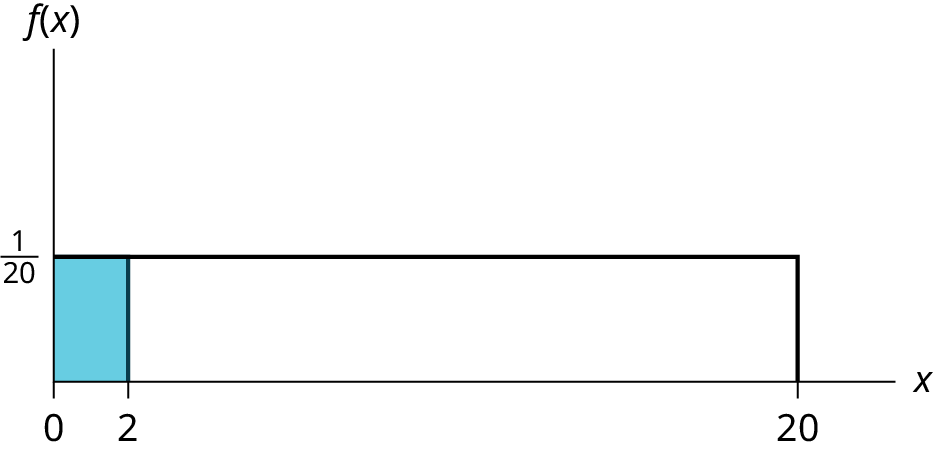
Figure 5.6図 5.6
The area corresponds to a probability. The probability that x is between zero and two is 0.1, which can be written mathematically as P(0 < x < 2) = P(x < 2) = 0.1.
この面積は確率に対応する。xが0と2の間にある確率は0.1であり、数学的にはP(0 < x < 2) = P(x < 2) = 0.1と書ける。
Suppose we want to find the area between f(x) = and the x-axis where 4 < x < 15.
4 < x < 15の範囲で、f(x) = とx軸との間の面積を求めたいとする。
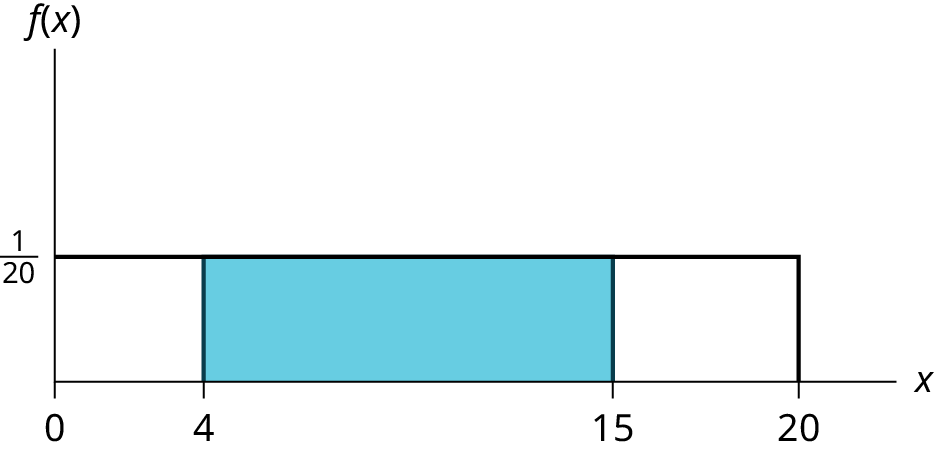
Figure 5.7図 5.7
The area corresponds to the probability P(4 < x < 15) = 0.55.
この面積は、確率P(4 < x < 15) = 0.55に対応する。
Suppose we want to find P(x = 15). On an x-y graph, x = 15 is a vertical line. A vertical line has no width (or zero width). Therefore, P(x = 15) = (base)(height) = (0) = 0
P(x = 15)を求めたいとする。xy平面では、x = 15は垂直な直線である。垂直な直線には幅がない(幅が0である)。したがって、P(x = 15) = (底辺)(高さ)= (0) = 0となる。
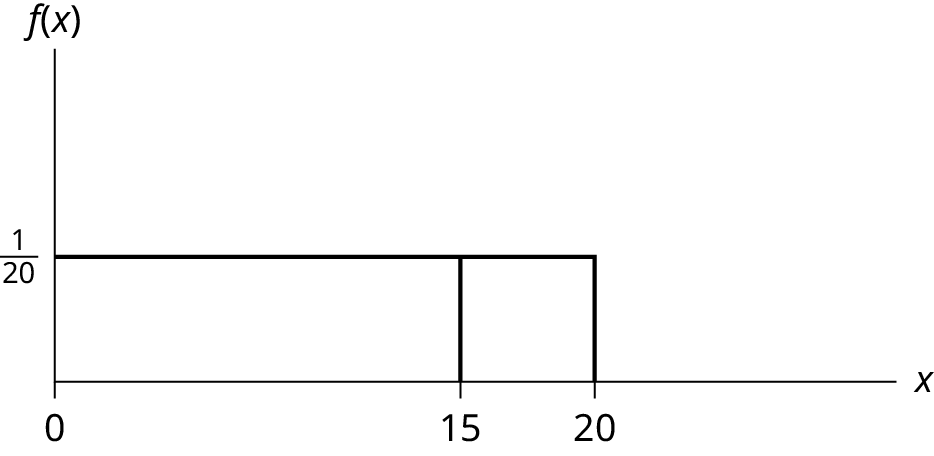
Figure 5.8図 5.8
P(X ≤ x), which can also be written as P(X < x) for continuous distributions, is called the cumulative distribution function or CDF. Notice the "less than or equal to" symbol. We can also use the CDF to calculate P(X > x). The CDF gives "area to the left" and P(X > x) gives "area to the right." We calculate P(X > x) for continuous distributions as follows: P(X > x) = 1 – P (X < x).
P(X ≤ x)を累積分布関数、またはCDFと呼ぶ。連続分布ではP(X < x)とも書ける。「以下」の記号に注意しよう。CDFを使ってP(X > x)を計算することもできる。CDFは「左側の面積」を、P(X > x)は「右側の面積」を与える。連続分布では、P(X > x) = 1 − P(X < x)として計算する。
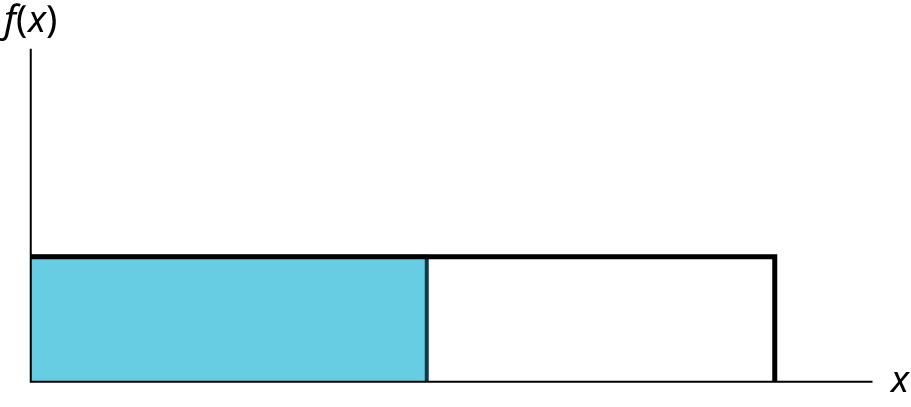
Figure 5.9図 5.9
Label the graph with f(x) and x. Scale the x and y axes with the maximum x and y values. f(x) = , 0 ≤ x ≤ 20.
グラフにf(x)とxを記入せよ。xとyの最大値を用いて、両軸に目盛りを付けよ。f(x) = 、0 ≤ x ≤ 20。
To calculate the probability that x is between two values, look at the following graph. Shade the region between x = 2.3 and x = 12.7. Then calculate the shaded area of a rectangle.
xが二つの値の間にある確率を計算するため、次のグラフを見よう。x = 2.3とx = 12.7の間を着色し、長方形の着色部分の面積を求めよ。
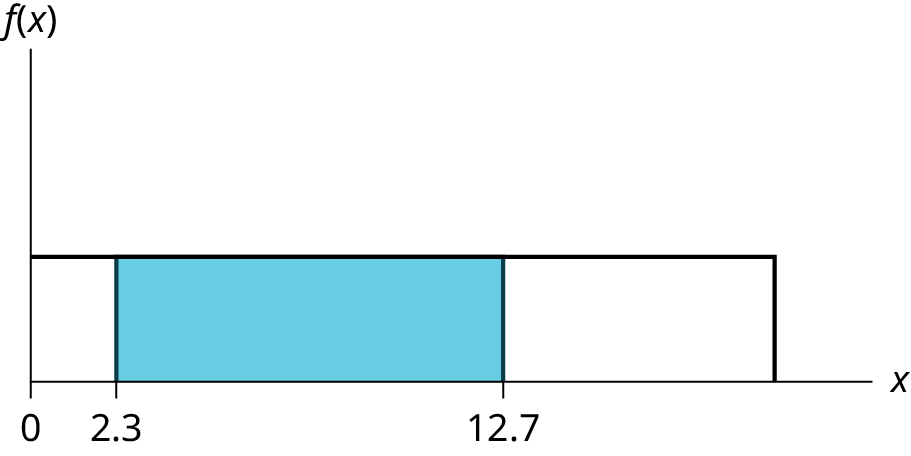
Figure 5.10図 5.10
Chapter Review章の復習
The probability density function (pdf) is used to describe probabilities for continuous random variables. The area under the density curve between two points corresponds to the probability that the variable falls between those two values. In other words, the area under the density curve between points a and b is equal to P(a < x < b). The cumulative distribution function (cdf) gives the probability as an area. If X is a continuous random variable, the probability density function (pdf), f(x), is used to draw the graph of the probability distribution. The total area under the graph of f(x) is one. The area under the graph of f(x) and between values a and b gives the probability P(a < x < b).
確率密度関数(pdf)は、連続確率変数の確率を記述するために用いる。二点の間の密度曲線の下の面積は、変数がその二つの値の間に入る確率に対応する。つまり、点aとbの間の密度曲線の下の面積はP(a < x < b)に等しい。累積分布関数(cdf)は、確率を面積として与える。Xが連続確率変数なら、確率密度関数f(x)で確率分布のグラフを描く。f(x)のグラフの下の総面積は1である。値aとbの間にあるf(x)のグラフの下の面積が、確率P(a < x < b)を与える。
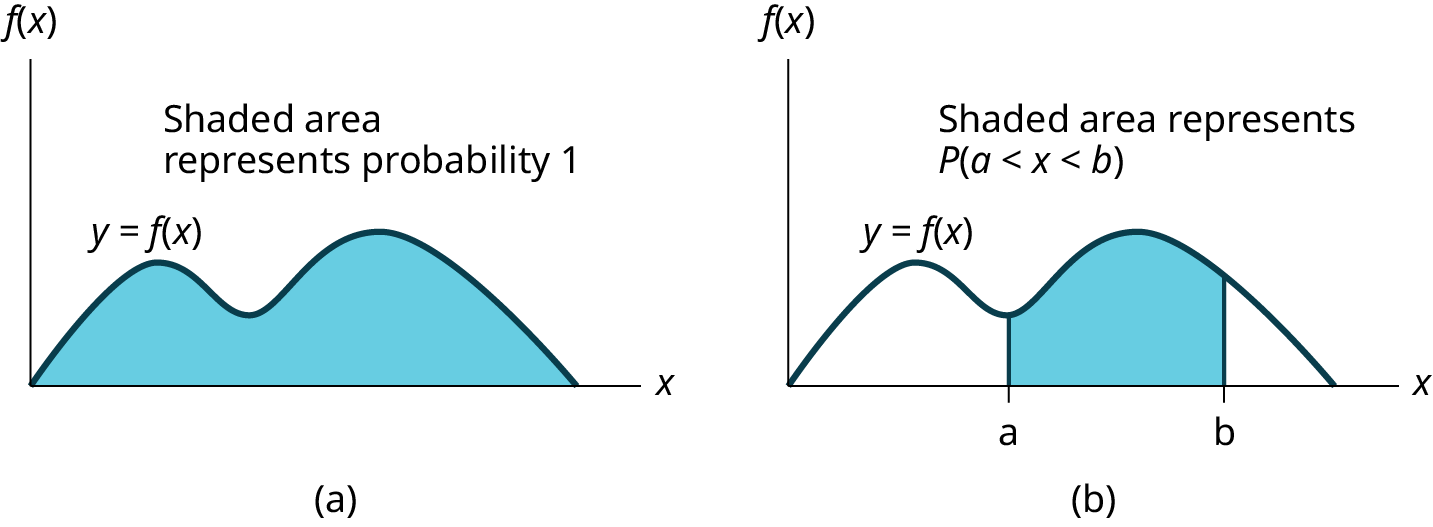
Figure 5.11図 5.11
The cumulative distribution function (cdf) of X is defined by P (X ≤ x). It is a function of x that gives the probability that the random variable is less than or equal to x.
Xの累積分布関数(cdf)はP(X ≤ x)で定義される。これはxの関数で、確率変数がx以下となる確率を与える。
Formula Review公式の復習
Probability density function (pdf) f(x):
確率密度関数(pdf)f(x):
- f(x) ≥ 0
- The total area under the curve f(x) is one.曲線f(x)の下の総面積は1である。
Cumulative distribution function (cdf): P(X ≤ x)
累積分布関数(cdf):P(X ≤ x)
Exercises 1–15練習問題 1–15
Exercise 1問題 1
Which type of distribution does the graph illustrate?
このグラフはどの種類の分布を表しているか。
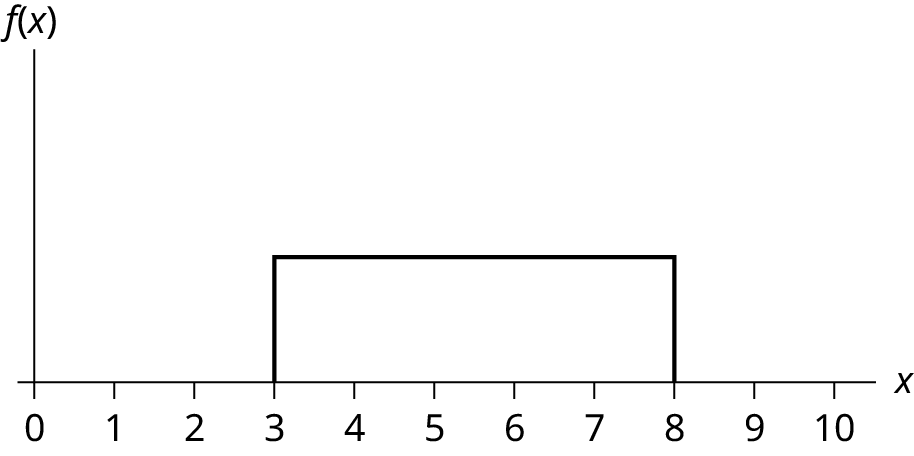
Figure 5.12図 5.12
Solution解き方
Uniform Distribution
一様分布
Exercise 2問題 2
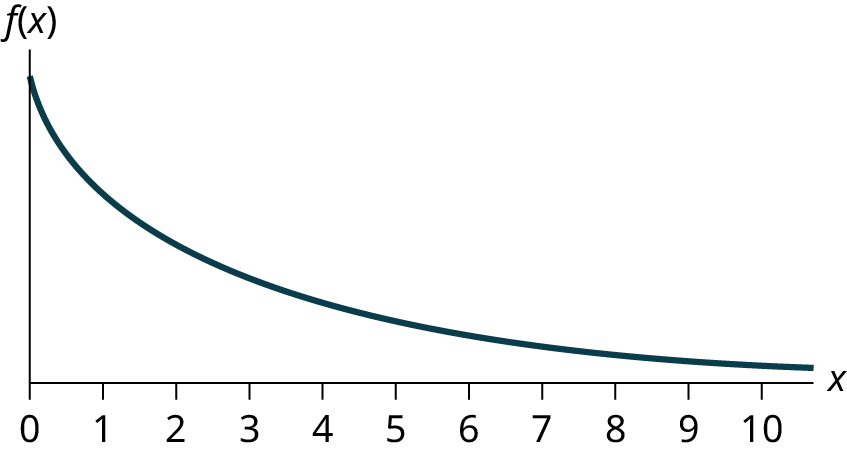
Exercise 3問題 3
Which type of distribution does the graph illustrate?
このグラフはどの種類の分布を表しているか。
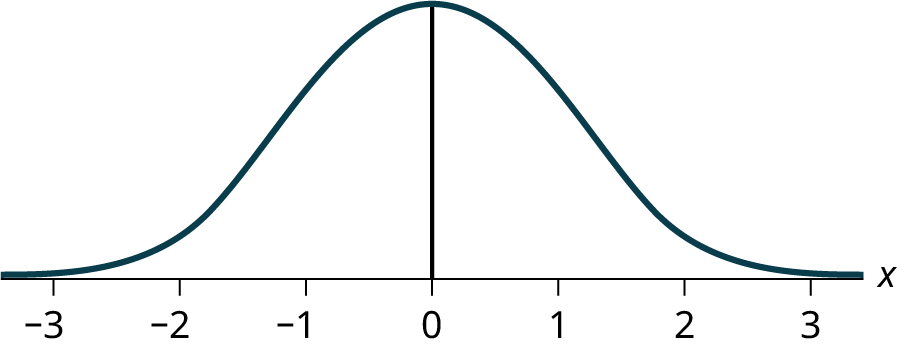
Figure 5.14図 5.14
Solution解き方
Normal Distribution
正規分布
Exercise 4問題 4
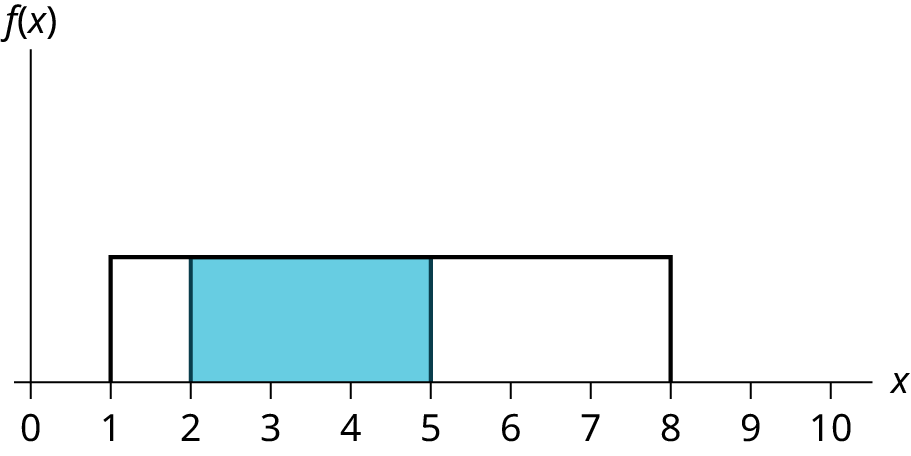
Exercise 5問題 5
What does the shaded area represent? P(___< x < ___)
着色部分の面積は何を表すか。P(___ < x < ___)
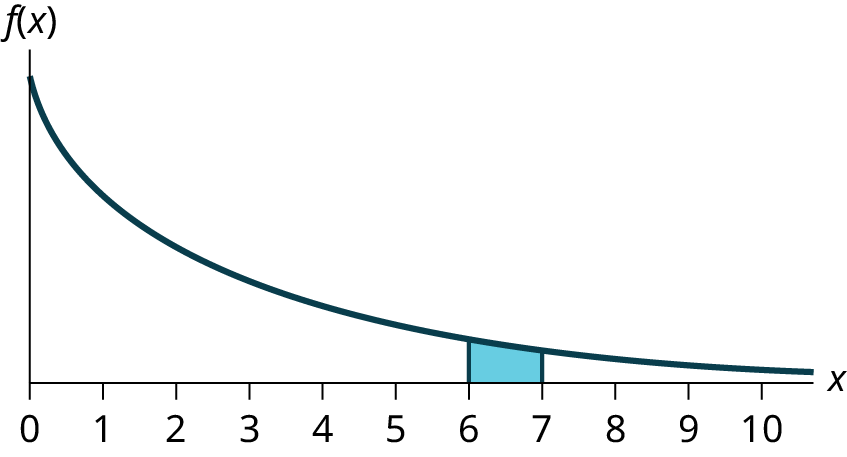
Figure 5.16図 5.16
Solution解き方
P(6 < x < 7)
Exercise 6問題 6
For a continuous probablity distribution, 0 ≤ x ≤ 15. What is P(x > 15)?
ある連続確率分布で、0 ≤ x ≤ 15である。P(x > 15)はいくらか。
Exercise 7問題 7
What is the area under f(x) if the function is a continuous probability density function?
関数が連続確率密度関数であるとき、f(x)の下の面積はいくらか。
Solution解き方
one
1
Exercise 8問題 8
For a continuous probability distribution, 0 ≤ x ≤ 10. What is P(x = 7)?
ある連続確率分布で、0 ≤ x ≤ 10である。P(x = 7)はいくらか。
Exercise 9問題 9
A continuous probability function is restricted to the portion between x = 0 and 7. What is P(x = 10)?
ある連続確率関数は、x = 0から7までの部分に限定されている。P(x = 10)はいくらか。
Solution解き方
zero
0
Exercise 10問題 10
f(x) for a continuous probability function is , and the function is restricted to 0 ≤ x ≤ 5. What is P(x < 0)?
連続確率関数f(x)はで、0 ≤ x ≤ 5に限定されている。P(x < 0)はいくらか。
Exercise 11問題 11
f(x), a continuous probability function, is equal to , and the function is restricted to 0 ≤ x ≤ 12. What is P (0 < x < 12)?
連続確率関数f(x)はに等しく、0 ≤ x ≤ 12に限定されている。P(0 < x < 12)はいくらか。
Solution解き方
one
1
Exercise 12問題 12
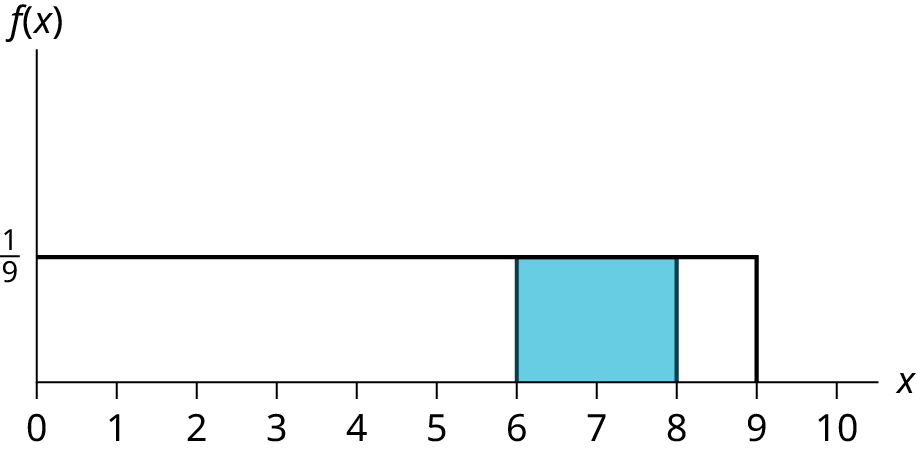
Exercise 13問題 13
Find the probability that x falls in the shaded area.
Xが陰影を付けた領域に入る確率を求めよ。
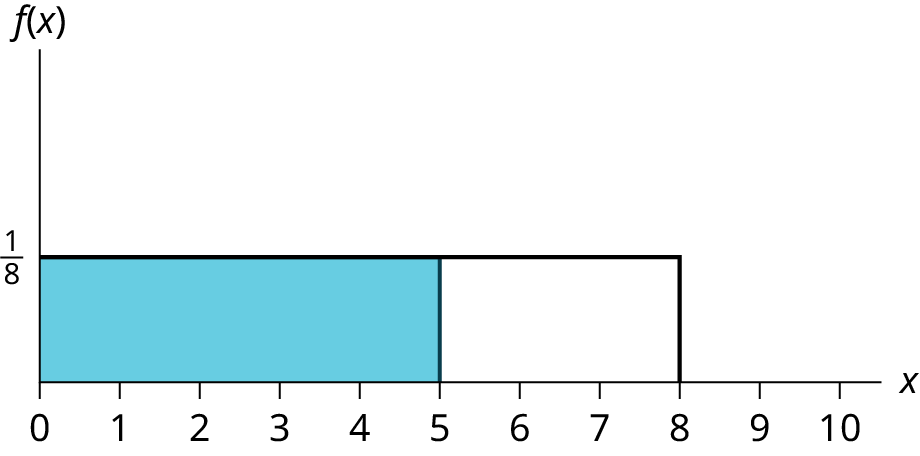
Figure 5.18図 5.18
Solution解き方
0.625
Exercise 14問題 14
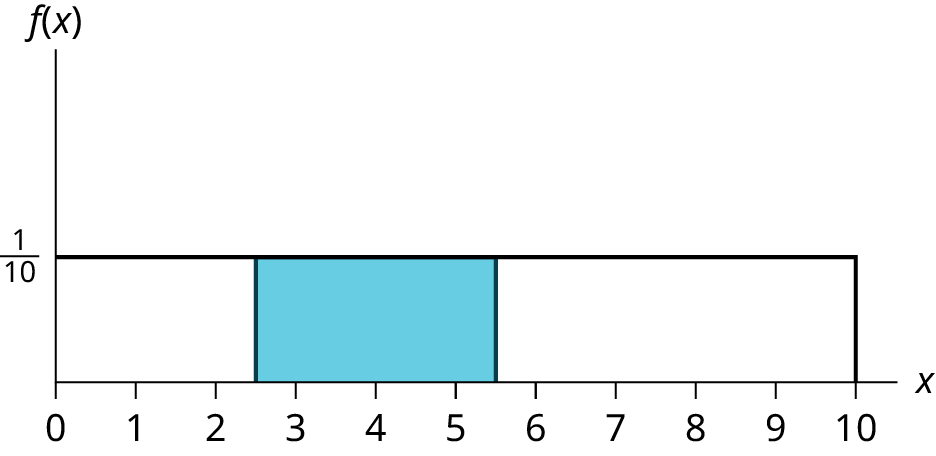


Exercise 15問題 15
f(x), a continuous probability function, is equal to and the function is restricted to 1 ≤ x ≤ 4. Describe
連続確率関数f(x)はに等しく、1 ≤ x ≤ 4に限定されている。を説明せよ。
Solution解き方
The probability is equal to the area from x = to x = 4 above the x-axis and up to f(x) = .
確率は、x = からx = 4までの、x軸より上でf(x) = までの面積に等しい。