第5章連続確率変数
5.3 The Exponential Distribution5.3 指数分布
The exponential distribution is often concerned with the amount of time until some specific event occurs. For example, the amount of time (beginning now) until an earthquake occurs has an exponential distribution. Other examples include the length, in minutes, of long distance business telephone calls, and the amount of time, in months, a car battery lasts. It can be shown, too, that the value of the change that you have in your pocket or purse approximately follows an exponential distribution.
英語のヒント
指数分布は、特定の事象が起こるまでの時間を扱うことが多い。たとえば、今から地震が起こるまでの時間は指数分布に従う。ほかにも、業務上の長距離電話の通話時間(分)、自動車用バッテリーの寿命(月)などがある。ポケットや財布に入っている小銭の金額も、ほぼ指数分布に従うことを示せる。
Values for an exponential random variable occur in the following way. There are fewer large values and more small values. For example, the amount of money customers spend in one trip to the supermarket follows an exponential distribution. There are more people who spend small amounts of money and fewer people who spend large amounts of money.
指数確率変数の値は、大きい値が少なく、小さい値が多いという形で現れる。たとえば、スーパーマーケットで客が1回の買い物に使う金額は指数分布に従う。少額を使う人は多く、多額を使う人は少ない。
Exponential distributions are commonly used in calculations of product reliability, or the length of time a product lasts.
指数分布は、製品の信頼性、すなわち製品がどれほど長く使えるかの計算によく用いられる。
Example 5.7例題 5.7
Let X = amount of time (in minutes) a postal clerk spends with their customer. The time is known to have an exponential distribution with the average amount of time equal to four minutes.
X = 郵便局員が客1人に対応する時間(分)とする。この時間は、平均4分の指数分布に従うと分かっている。
X is a continuous random variable since time is measured. It is given that μ = 4 minutes. To do any calculations, you must know m, the decay parameter.
英語のヒント
時間は測定するので、Xは連続確率変数である。μ = 4分と与えられている。計算するには、減衰母数mを知る必要がある。
. Therefore,
。したがって、
The standard deviation, σ, is the same as the mean. μ = σ
標準偏差σは平均と同じである。μ = σ。
The distribution notation is X ~ Exp(m). Therefore, X ~ Exp(0.25).
分布の表記はX ~ Exp(m)である。したがって、X ~ Exp(0.25)となる。
The probability density function is f(x) = me-mx. The number e = 2.71828182846... It is a number that is used often in mathematics. Scientific calculators have the key "ex." If you enter one for x, the calculator will display the value e.
確率密度関数はf(x) = me-mxである。数e = 2.71828182846…は、数学でよく使われる。関数電卓には「ex」キーがある。xに1を入力すると、eの値が表示される。
The curve is:
曲線は次の式で表される。
f(x) = 0.25e–0.25x where x is at least zero and m = 0.25.
f(x) = 0.25e–0.25x。ここでxは0以上、m = 0.25である。
For example, f(5) = 0.25e(-0.25)(5) = 0.072. The value 0.072 is the height of the curve when x = 5. In Example 5.8 below, you will learn how to find probabilities using the decay parameter.
たとえば、f(5) = 0.25e(-0.25)(5) = 0.072となる。0.072はx = 5での曲線の高さである。後の例5.8で、減衰母数を使って確率を求める方法を学ぶ。
The graph is as follows:
グラフは次のようになる。
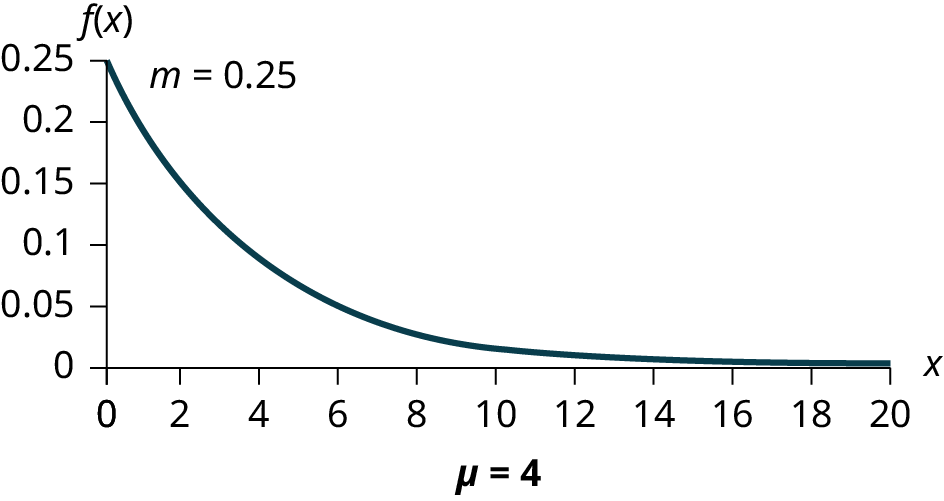
Figure 5.39図 5.39
Notice the graph is a declining curve. When x = 0,
グラフが減少する曲線であることに注意しよう。x = 0のとき、
f(x) = 0.25e(−0.25)(0) = (0.25)(1) = 0.25 = m. The maximum value on the y-axis is m.
f(x) = 0.25e(−0.25)(0) = (0.25)(1) = 0.25 = mとなる。y軸上の最大値はmである。
Example 5.8例題 5.8
a. Using the information in Example 5.7, find the probability that a clerk spends four to five minutes with a randomly selected customer.
a. 例5.7の情報を使い、局員が無作為に選んだ客に4〜5分対応する確率を求めよ。
Solution解き方
a. Find P(4 < x < 5).
The cumulative distribution function (CDF) gives the area to the left.
P(x < x) = 1 – e–mx
P(x < 5) = 1 – e(−0.25)(5) = 0.7135 and P(x < 4) = 1 – e(–0.25)(4) = 0.6321
The cumulative distribution function (CDF) gives the area to the left.
P(x < x) = 1 – e–mx
P(x < 5) = 1 – e(−0.25)(5) = 0.7135 and P(x < 4) = 1 – e(–0.25)(4) = 0.6321
a. P(4 < x < 5)を求める。累積分布関数(CDF)は左側の面積を与える。P(x < x) = 1 − e–mx。P(x < 5) = 1 − e(−0.25)(5) = 0.7135、P(x < 4) = 1 − e(–0.25)(4) = 0.6321である。
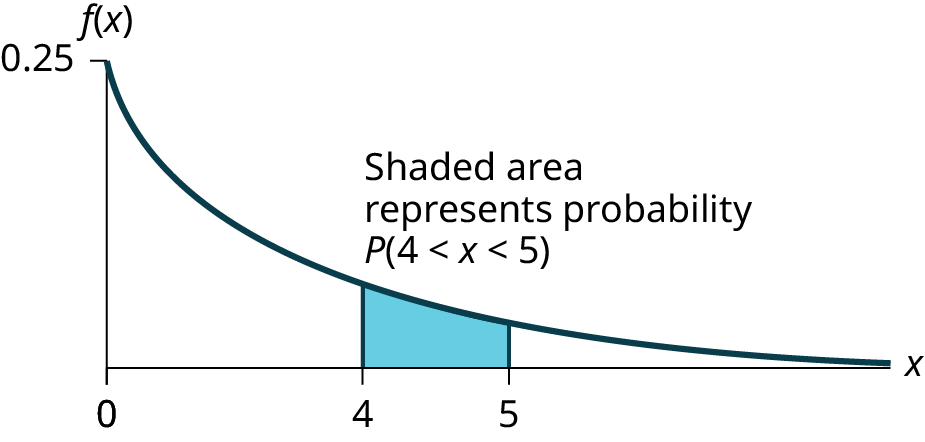
Figure 5.40図 5.40
The probability that a postal clerk spends four to five minutes with a randomly selected customer is P(4 < x < 5) = P(x < 5) – P(x < 4) = 0.7135 − 0.6321 = 0.0814.
郵便局員が無作為に選んだ客に4〜5分対応する確率は、P(4 < x < 5) = P(x < 5) − P(x < 4) = 0.7135 − 0.6321 = 0.0814である。
Using the Calculator電卓の操作
b. Half of all customers are finished within how long? (Find the 50th percentile)
b. 客全体の半分は何分以内で対応が終わるか(第50パーセンタイルを求めよ)。
Solution解き方
b. Find the 50th percentile.
b. 第50パーセンタイルを求める。
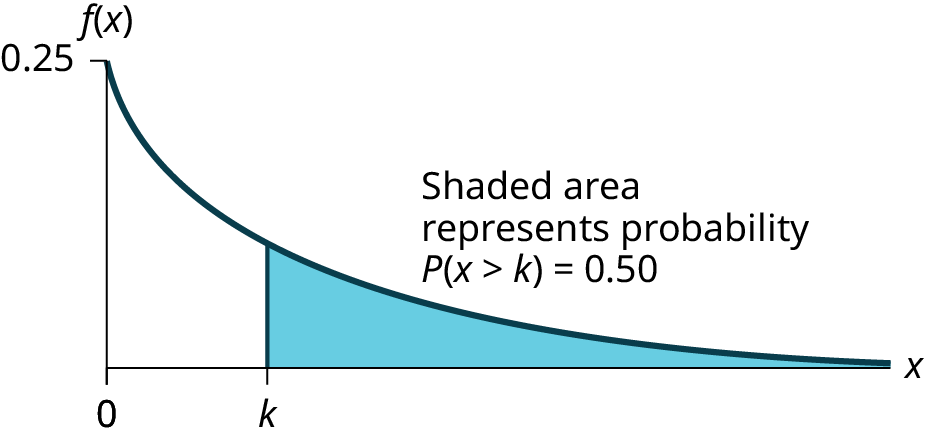
Figure 5.41図 5.41
P(x < k) = 0.50, k = 2.8 minutes (calculator or computer)
P(x < k) = 0.50、k = 2.8分(電卓またはコンピューターによる)。
Half of all customers are finished within 2.8 minutes.
客全体の半分は、2.8分以内で対応が終わる。
You can also do the calculation as follows:
次のように計算することもできる。
P(x < k) = 0.50 and P(x < k) = 1 –e–0.25k
P(x < k) = 0.50、かつP(x < k) = 1 − e–0.25k
Therefore, 0.50 = 1 − e−0.25k and e−0.25k = 1 − 0.50 = 0.5
したがって、0.50 = 1 − e−0.25k、e−0.25k = 1 − 0.50 = 0.5となる。
Take natural logs: ln(e–0.25k) = ln(0.50). So, –0.25k = ln(0.50)
英語のヒント
自然対数を取る。ln(e–0.25k) = ln(0.50)。したがって、−0.25k = ln(0.50)である。
Solve for k: minutes. The calculator simplifies the calculation for percentile k. See the following two notes.
kについて解くと、分となる。電卓を使えば、パーセンタイルkの計算が簡単になる。次の二つの注を参照せよ。
Using the Calculator電卓の操作
c. Which is larger, the mean or the median?
c. 平均と中央値では、どちらが大きいか。
Solution解き方
c. From part b, the median or 50th percentile is 2.8 minutes. The theoretical mean is four minutes. The mean is larger.
c. bより、中央値、すなわち第50パーセンタイルは2.8分である。理論上の平均は4分なので、平均のほうが大きい。
Collaborative Exercise共同演習
Example 5.9例題 5.9
On the average, a certain computer part lasts ten years. The length of time the computer part lasts is exponentially distributed.
あるコンピューター部品の寿命は平均10年である。寿命は指数分布に従う。
a. What is the probability that a computer part lasts more than 7 years?
a. コンピューター部品が7年より長く使える確率はいくらか。
Solution解き方
a. Let x = the amount of time (in years) a computer part lasts.
μ = 10 so
Find P(x > 7). Draw the graph.
P(x > 7) = 1 – P(x < 7).
Since P(X < x) = 1 –e–mx then P(X > x) = 1 –(1 –e–mx) = e-mx
P(x > 7) = e(–0.1)(7) = 0.4966. The probability that a computer part lasts more than seven years is 0.4966.
μ = 10 so
Find P(x > 7). Draw the graph.
P(x > 7) = 1 – P(x < 7).
Since P(X < x) = 1 –e–mx then P(X > x) = 1 –(1 –e–mx) = e-mx
P(x > 7) = e(–0.1)(7) = 0.4966. The probability that a computer part lasts more than seven years is 0.4966.
a. x = コンピューター部品の寿命(年)とする。μ = 10なので、である。P(x > 7)を求める。グラフを描く。P(x > 7) = 1 − P(x < 7)。P(X < x) = 1 − e–mxなので、P(X > x) = 1 − (1 − e–mx) = e-mxとなる。P(x > 7) = e(–0.1)(7) = 0.4966。部品が7年より長く使える確率は0.4966である。
Using the Calculator電卓の操作
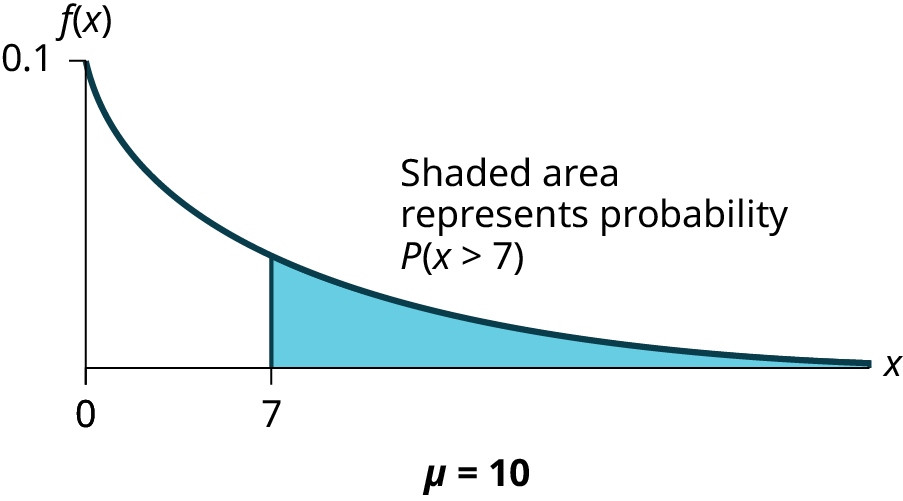
Figure 5.42図 5.42
b. On the average, how long would five computer parts last if they are used one after another?
b. コンピューター部品5個を順番に使うと、平均して何年使えるか。
Solution解き方
b. On the average, one computer part lasts ten years. Therefore, five computer parts, if they are used one right after the other would last, on the average, (5)(10) = 50 years.
b. 部品1個の寿命は平均10年である。したがって、5個を一つずつ続けて使うと、平均(5)(10) = 50年使える。
c. Eighty percent of computer parts last at most how long?
c. コンピューター部品の80%は、寿命が何年以下か。
Solution解き方
c. Find the 80th percentile. Draw the graph. Let k = the 80th percentile.
c. 第80パーセンタイルを求める。グラフを描く。k = 第80パーセンタイルとする。
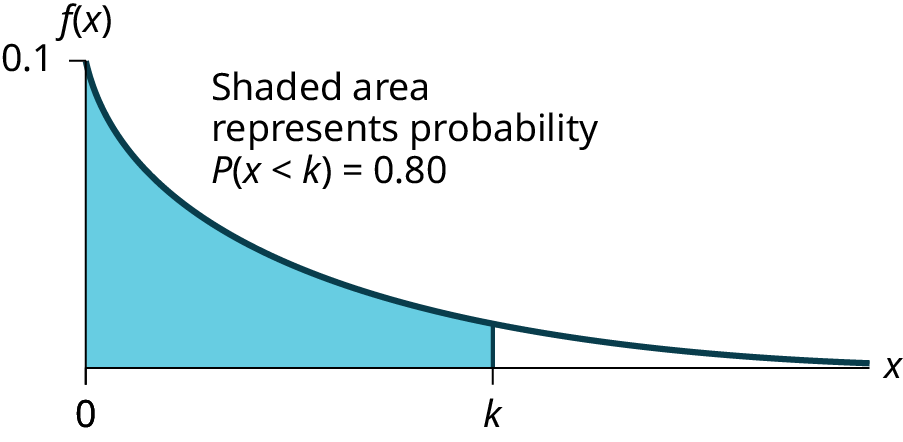
Figure 5.43図 5.43
Solve for k: years
kについて解くと、年となる。
Eighty percent of the computer parts last at most 16.1 years.
コンピューター部品の80%は、寿命が16.1年以下である。
Using the Calculator電卓の操作
d. What is the probability that a computer part lasts between nine and 11 years?
d. コンピューター部品の寿命が9年と11年の間である確率はいくらか。
Solution解き方
d. Find P(9 < x < 11). Draw the graph.
d. P(9 < x < 11)を求める。グラフを描く。
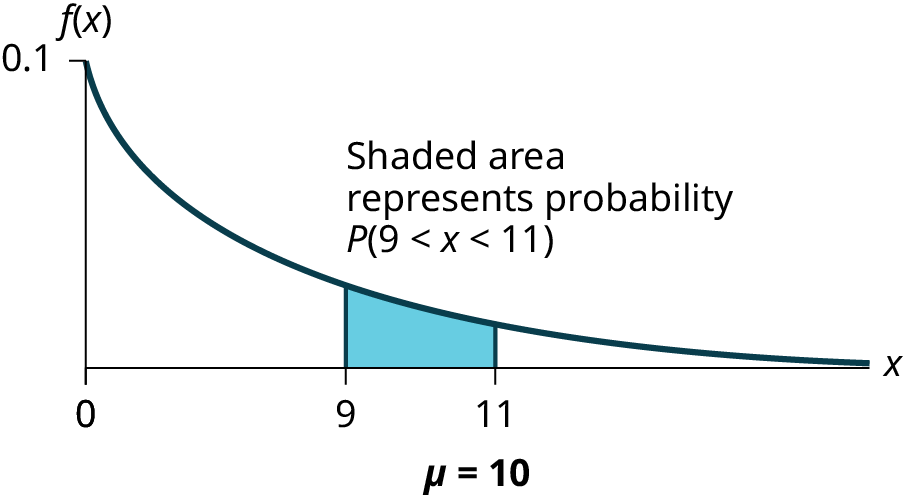
Figure 5.44図 5.44
P(9 < x < 11) = P(x < 11) – P(x < 9) = (1 – e(–0.1)(11)) – (1 – e(–0.1)(9)) = 0.6671 – 0.5934 = 0.0737. The probability that a computer part lasts between nine and 11 years is 0.0737.
P(9 < x < 11) = P(x < 11) − P(x < 9) = (1 − e(–0.1)(11)) − (1 − e(–0.1)(9)) = 0.6671 − 0.5934 = 0.0737。コンピューター部品の寿命が9年と11年の間である確率は0.0737である。
Using the Calculator電卓の操作
Example 5.10例題 5.10
Suppose that the length of a phone call, in minutes, is an exponential random variable with decay parameter . If another person arrives at a public telephone just before you, find the probability that you will have to wait more than five minutes. Let X = the length of a phone call, in minutes.
通話時間(分)が、減衰母数の指数確率変数であるとする。公衆電話に別の人が自分の直前に着いた場合、5分を超えて待つ必要がある確率を求めよ。X = 通話時間(分)とする。
What is m, μ, and σ? The probability that you must wait more than five minutes is _______ .
m、μ、σはいくらか。5分を超えて待つ必要がある確率は_______である。
Solution解き方
- m =
- μ = 12
- σ = 12
P(x > 5) = 0.6592
Example 5.11例題 5.11
The time spent waiting between events is often modeled using the exponential distribution. For example, suppose that an average of 30 customers per hour arrive at a store and the time between arrivals is exponentially distributed.
事象と事象の間の待ち時間は、指数分布でモデル化されることが多い。たとえば、ある店に1時間平均30人の客が到着し、その到着間隔が指数分布に従うとする。
- On average, how many minutes elapse between two successive arrivals?
英語のヒント
連続する二人の到着の間には、平均何分経過するか。 - When the store first opens, how long on average does it take for three customers to arrive?開店してから客が3人到着するまで、平均何分かかるか。
- After a customer arrives, find the probability that it takes less than one minute for the next customer to arrive.客が1人到着した後、次の客の到着まで1分未満しかかからない確率を求めよ。
- After a customer arrives, find the probability that it takes more than five minutes for the next customer to arrive.客が1人到着した後、次の客の到着まで5分を超えてかかる確率を求めよ。
- Seventy percent of the customers arrive within how many minutes of the previous customer?客の70%は、前の客から何分以内に到着するか。
- Is an exponential distribution reasonable for this situation?この状況に指数分布を使うのは妥当か。
Solution解き方
- Since we expect 30 customers to arrive per hour (60 minutes), we expect on average one customer to arrive every two minutes on average.1時間(60分)に30人が到着すると予想されるので、平均して2分ごとに1人が到着すると予想される。
- Since one customer arrives every two minutes on average, it will take six minutes on average for three customers to arrive.平均して2分ごとに1人到着するので、3人が到着するまで平均6分かかる。
- Let X = the time between arrivals, in minutes. By part a, μ = 2, so m = = 0.5.
Therefore, X ∼ Exp(0.5).
The cumulative distribution function is P(X < x) = 1 – e(-0.5)(x).
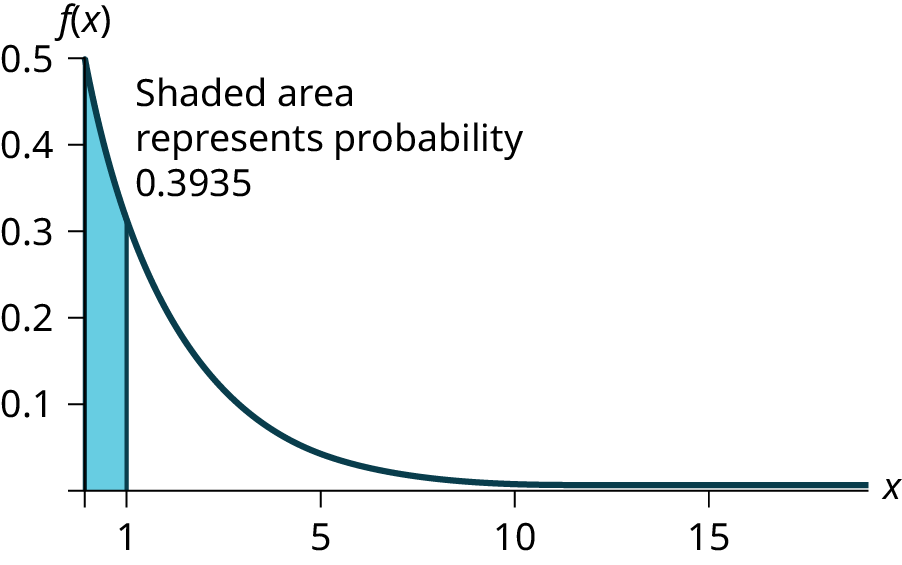
Therefore P(X < 1) = 1 – e(–0.5)(1) ≈ 0.3935.X = 到着間隔(分)とする。aよりμ = 2なので、m = = 0.5である。したがって、X ∼ Exp(0.5)。累積分布関数はP(X < x) = 1 − e(-0.5)(x)である。よってP(X < 1) = 1 − e(–0.5)(1) ≈ 0.3935となる。Using the Calculator電卓の操作
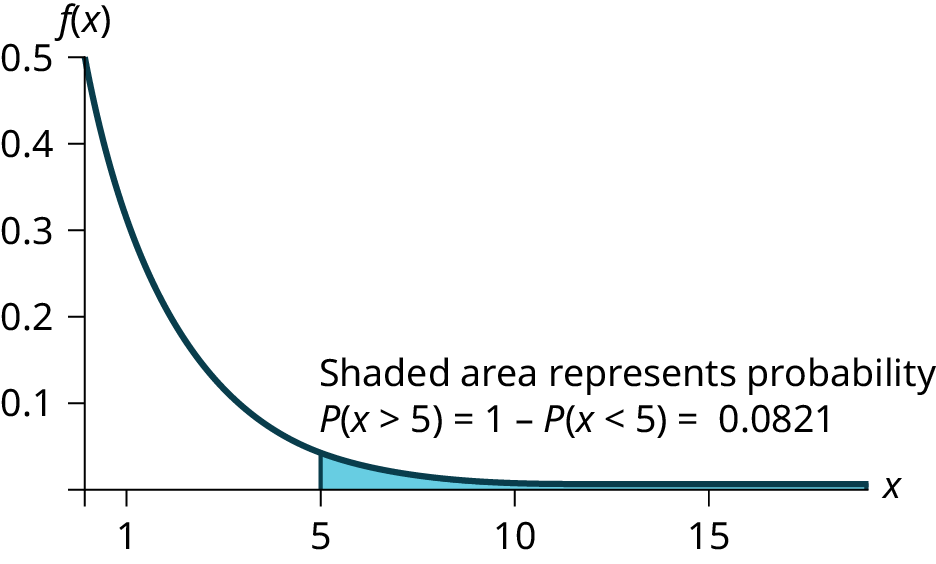
Figure 5.45図 5.45 - P(X > 5) = 1 – P(X < 5) = 1 – (1 – e(-0.50)(5)) = e–2.5 ≈ 0.0821.Figure 5.46図 5.46
Using the Calculator電卓の操作
- We want to solve 0.70 = P(X < x) for x.
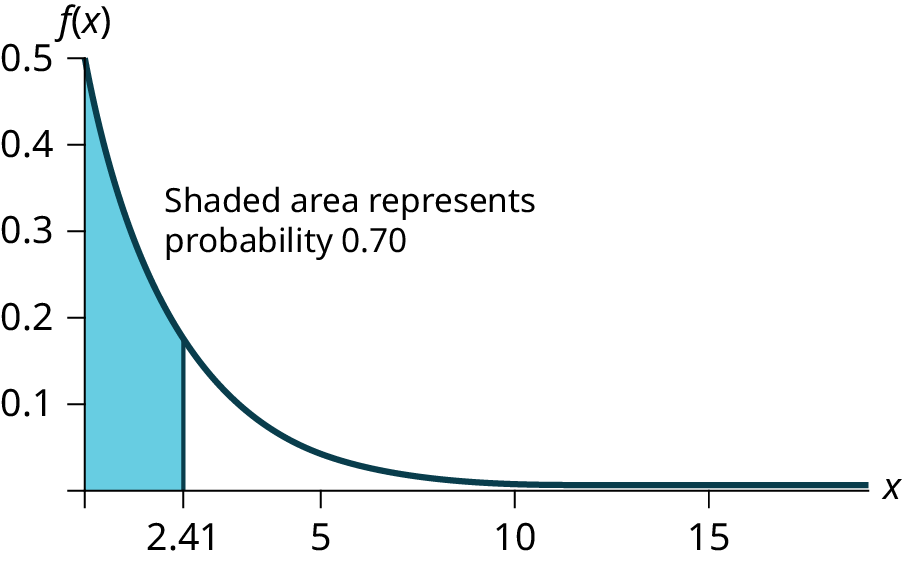
Substituting in the cumulative distribution function gives 0.70 = 1 – e–0.5x, so that e–0.5x = 0.30. Converting this to logarithmic form gives –0.5x = ln(0.30), or minutes.
Thus, seventy percent of customers arrive within 2.41 minutes of the previous customer.
You are finding the 70th percentile k so you can use the formula k =
k = minutes0.70 = P(X < x)をxについて解きたい。累積分布関数を代入すると0.70 = 1 − e–0.5xなので、e–0.5x = 0.30となる。対数の形に直すと−0.5x = ln(0.30)、すなわち分である。したがって、客の70%は前の客から2.41分以内に到着する。第70パーセンタイルkを求めているので、公式k = を使える。k = 分となる。Figure 5.47図 5.47 - This model assumes that a single customer arrives at a time, which may not be reasonable since people might shop in groups, leading to several customers arriving at the same time. It also assumes that the flow of customers does not change throughout the day, which is not valid if some times of the day are busier than others.
英語のヒント
このモデルは客が1人ずつ到着すると仮定するが、複数人で買い物に来て同時に到着することもあるので、妥当でないかもしれない。また、1日を通じて客の流れが変わらないと仮定しているが、ほかの時間帯より混雑する時間帯があるなら、この仮定は成り立たない。