第5章連続確率変数
Homework宿題
Exercises 48–52練習問題 48–52
For each probability and percentile problem, draw the picture.
確率とパーセンタイルの各問題について、図を描け。
Exercise 48問題 48
Births are approximately uniformly distributed throughout the year. They can be said to follow a uniform distribution from 0 to 52 (spread of 52 weeks).
出生は1年を通じてほぼ一様に分布している。0から52までの一様分布(52週間の範囲)に従うといえる。
- X ~ _________
- Graph the probability distribution.確率分布のグラフを描け。
- f(x) = _________
- μ = _________
- σ = _________
- Find the probability that a person is born at the exact moment week 19 ends. That is, find P(x = 19) = _________第19週が終わるちょうどその瞬間に人が生まれる確率を求めよ。すなわち、P(x = 19) = _________を求めよ。
- P(2 < x < 31) = _________
- Find the probability that a person is born after week 40.第40週より後に人が生まれる確率を求めよ。
- P(12 < x|x < 28) = _________
- Find the 70th percentile.第70パーセンタイルを求めよ。
- Find the minimum for the upper quarter.上位4分の1の最小値を求めよ。
Exercise 49問題 49
A random number generator picks a number from one to nine in a uniform manner.
乱数生成器が、1から9までの数を一様に選ぶ。
- X ~ _________
- Graph the probability distribution.確率分布のグラフを描け。
- f(x) = _________
- μ = _________
- σ = _________
- P(3.5 < x < 7.25) = _________
- P(x > 5.67)
- P(x > 5|x > 3) = _________
- Find the 90th percentile.第90パーセンタイルを求めよ。
Solution解き方
- X ~ U(1, 9)
- Answers may vary.解答は一通りではない。
- whereで
- five5
- 2.3
- 8.2
Exercise 50問題 50
According to a study by Dr. John McDougall of his live-in weight loss program, the people who follow his program lose between six and 15 pounds a month until they approach trim body weight. Let’s suppose that the weight loss is uniformly distributed. We are interested in the weight loss of a randomly selected individual following the program for one month.
英語のヒント
ジョン・マクドゥーガル医師による自身の滞在型減量プログラムの研究では、参加者は引き締まった体重に近づくまで、月に6〜15ポンド減量する。減量幅が一様分布に従うと仮定しよう。1か月間プログラムに従う、無作為に選んだ人の減量幅に関心がある。
- Define the random variable. X = _________確率変数を定義せよ。X = _________
- X ~ _________
- Graph the probability distribution.確率分布のグラフを描け。
- f(x) = _________
- μ = _________
- σ = _________
- Find the probability that the individual lost more than ten pounds in a month.1か月で10ポンドより多く減量した確率を求めよ。
- Suppose it is known that the individual lost more than ten pounds in a month. Find the probability that he lost less than 12 pounds in the month.1か月で10ポンドより多く減量したと分かっているとする。その月の減量幅が12ポンド未満である確率を求めよ。
- P(7 < x < 13|x > 9) = __________. State this in a probability question, similarly to parts g and h, draw the picture, and find the probability.P(7 < x < 13|x > 9) = __________。gとhと同様に、これを確率の問いとして言葉で表し、図を描いて確率を求めよ。
Exercise 51問題 51
A subway train arrives every eight minutes during rush hour. We are interested in the length of time a commuter must wait for a train to arrive. The time follows a uniform distribution.
英語のヒント
ラッシュ時には地下鉄が8分ごとに到着する。通勤客が列車の到着を待つ時間に関心がある。その時間は一様分布に従う。
- Define the random variable. X = _______確率変数を定義せよ。X = _______
- X ~ _______
- Graph the probability distribution.確率分布のグラフを描け。
- f(x) = _______
- μ = _______
- σ = _______
- Find the probability that the commuter waits less than one minute.通勤客の待ち時間が1分未満である確率を求めよ。
- Find the probability that the commuter waits between three and four minutes.通勤客が3分から4分の間待つ確率を求めよ。
- Sixty percent of commuters wait more than how long for the train? State this in a probability question, similarly to parts g and h, draw the picture, and find the probability.通勤客の60%は、何分より長く列車を待つか。gとhと同様に確率の問いとして言葉で表し、図を描いて確率を求めよ。
Solution解き方
- X represents the length of time a commuter must wait for a train to arrive on the Red Line.Xは、通勤客がレッドラインの列車の到着を待つ時間を表す。
- X ~ U(0, 8)
- Graph the probability distribution.確率分布のグラフを描け。
- whereで
- four4
- 2.31
- 3.2
Exercise 52問題 52
The age of a first grader on September 1 at Garden Elementary School is uniformly distributed from 5.8 to 6.8 years. We randomly select one first grader from the class.
ガーデン小学校の1年生の9月1日時点の年齢は、5.8歳から6.8歳の一様分布に従う。クラスから1年生を1人無作為に選ぶ。
- Define the random variable. X = _________確率変数を定義せよ。X = _________
- X ~ _________
- Graph the probability distribution.確率分布のグラフを描け。
- f(x) = _________
- μ = _________
- σ = _________
- Find the probability that she is over 6.5 years old.6.5歳を超えている確率を求めよ。
- Find the probability that she is between four and six years old.4歳と6歳の間である確率を求めよ。
- Find the 70th percentile for the age of first graders on September 1 at Garden Elementary School.ガーデン小学校の1年生の9月1日時点の年齢について、第70パーセンタイルを求めよ。
Exercises 53–59練習問題 53–59
Use the following information to answer the next three exercises. The Sky Train from the terminal to the rental–car and long–term parking center is supposed to arrive every eight minutes. The waiting times for the train are known to follow a uniform distribution.
次の情報を使って、続く3問に答えよ。ターミナルからレンタカー・長期駐車場センターへ向かうスカイトレインは、8分ごとに到着することになっている。待ち時間は一様分布に従うと分かっている。
Exercise 53問題 53
What is the average waiting time (in minutes)?
平均待ち時間(分)はいくらか。
- zero0
- two2
- three3
- four4
Solution解き方
d
Exercise 54問題 54
Find the 30th percentile for the waiting times (in minutes).
待ち時間(分)の第30パーセンタイルを求めよ。
- two2
- 2.4
- 2.75
- three3
Exercise 55問題 55
The probability of waiting more than seven minutes given a person has waited more than four minutes is?
すでに4分を超えて待ったとき、待ち時間が7分を超える確率はいくらか。
- 0.125
- 0.25
- 0.5
- 0.75
Solution解き方
b
Exercise 56問題 56
The time (in minutes) until the next bus departs a major bus depot follows a distribution with f(x) = where x goes from 25 to 45 minutes.
英語のヒント
大きなバスターミナルから次のバスが出発するまでの時間(分)は、25分から45分の範囲でf(x) = という分布に従う。
- Define the random variable. X = ________確率変数を定義せよ。X = ________
- X ~ ________
- Graph the probability distribution.確率分布のグラフを描け。
- The distribution is ______________ (name of distribution). It is _____________ (discrete or continuous).分布は______________(分布名)であり、_____________(離散型または連続型)である。
- μ = ________
- σ = ________
- Find the probability that the time is at most 30 minutes. Sketch and label a graph of the distribution. Shade the area of interest. Write the answer in a probability statement.時間が30分以下である確率を求めよ。分布のグラフを概略で描いて名称を付け、関心のある領域を着色せよ。答えを確率の式で表せ。
- Find the probability that the time is between 30 and 40 minutes. Sketch and label a graph of the distribution. Shade the area of interest. Write the answer in a probability statement.時間が30分から40分の間である確率を求めよ。分布のグラフを概略で描いて名称を付け、関心のある領域を着色せよ。答えを確率の式で表せ。
- P(25 < x < 55) = _________. State this in a probability statement, similarly to parts g and h, draw the picture, and find the probability.P(25 < x < 55) = _________。gとhと同様に、これを確率に関する文で表し、図を描いて確率を求めよ。
- Find the 90th percentile. This means that 90% of the time, the time is less than _____ minutes.第90パーセンタイルを求めよ。これは、90%の場合に時間が_____分未満であることを意味する。
- Find the 75th percentile. In a complete sentence, state what this means. (See part j.)第75パーセンタイルを求めよ。その意味を完全な文で述べよ(j参照)。
- Find the probability that the time is more than 40 minutes given (or knowing that) it is at least 30 minutes.時間が少なくとも30分だと与えられた(分かっている)とき、40分を超える確率を求めよ。
Exercise 57問題 57
Suppose that the value of a stock varies each day from $16 to $25 with a uniform distribution.
ある株の価格が毎日16ドルから25ドルの間で、一様分布に従って変動するとする。
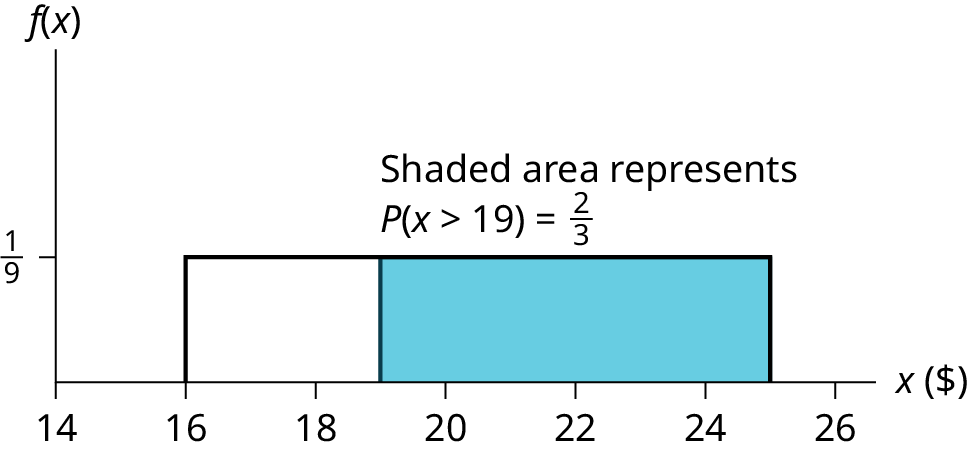
- Find the probability that the value of the stock is more than $19.株価が19ドルを超える確率を求めよ。
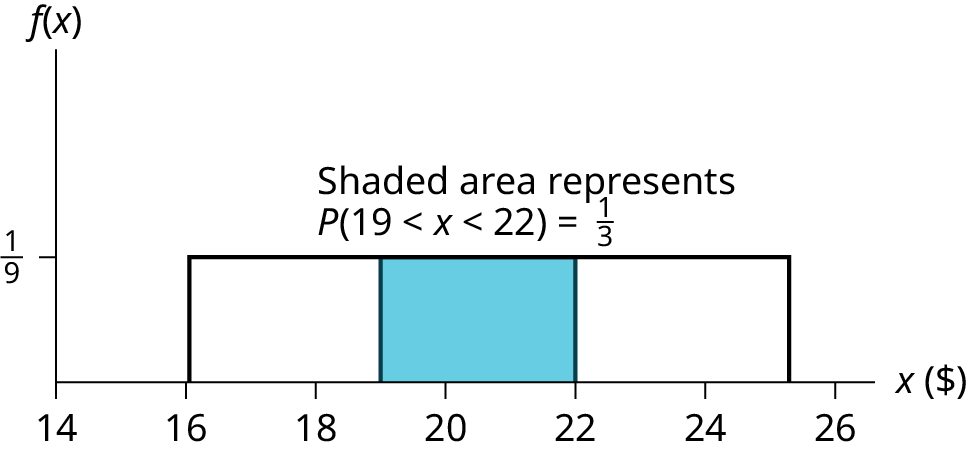
- Find the probability that the value of the stock is between $19 and $22.株価が19ドルから22ドルの間である確率を求めよ。
- Find the upper quartile - 25% of all days the stock is above what value? Draw the graph.上側四分位数を求めよ。全日数の25%で株価はどの値を超えるか。グラフを描け。
- Given that the stock is greater than $18, find the probability that the stock is more than $21.株価が18ドルを超えているとき、21ドルを超える確率を求めよ。
Solution解き方
- The probability density function of X is .
P(X > 19) = (25 – 19) = = .Xの確率密度関数はである。P(X > 19) = (25 − 19) = = 。Figure 5.37図 5.37 - P(19 < X < 22) = (22 – 19) = = .Figure 5.38図 5.38
- The area must be 0.25, and 0.25 = (width), so width = (0.25)(9) = 2.25. Thus, the value is 25 – 2.25 = 22.75.面積は0.25でなければならず、0.25 = (幅)なので、幅 = (0.25)(9) = 2.25となる。したがって、求める値は25 − 2.25 = 22.75である。
- This is a conditional probability question. P(x > 21| x > 18). You can do this two ways:これは条件付き確率P(x > 21|x > 18)の問題である。二通りに解ける。
- Draw the graph where a is now 18 and b is still 25. The height is =
So, P(x > 21|x > 18) = (25 – 21) = 4/7.aを18、bをそのまま25としてグラフを描く。高さは = である。したがって、P(x > 21|x > 18) = (25 − 21) = 4/7となる。 - Use the formula: P(x > 21|x > 18) =
= = = .公式を使う。P(x > 21|x > 18) = = = = 。


Exercise 58問題 58
A fireworks show is designed so that the time between fireworks is between one and five seconds, and follows a uniform distribution.
花火大会は、花火の間隔が1秒から5秒の一様分布に従うように設計されている。
- Find the average time between fireworks.花火の平均間隔を求めよ。
- Find probability that the time between fireworks is greater than four seconds.花火の間隔が4秒より長い確率を求めよ。
Exercise 59問題 59
The number of miles driven by a truck driver falls between 300 and 700, and follows a uniform distribution.
あるトラック運転手の走行距離は300マイルから700マイルの間で、一様分布に従う。
- Find the probability that the truck driver goes more than 650 miles in a day.運転手が1日に650マイルを超えて走る確率を求めよ。
- Find the probability that the truck drivers goes between 400 and 650 miles in a day.運転手が1日に400マイルから650マイルの間を走る確率を求めよ。
- At least how many miles does the truck driver travel on the furthest 10% of days?走行距離の長いほうの10%の日には、少なくとも何マイル走るか。
Solution解き方
- P(X > 650) = = 0.125
- P(400 < X < 650) = = 0.625
- 0.10 = , so width = 400(0.10) = 40. Since 700 – 40 = 660, the drivers travel at least 660 miles on the furthest 10% of days.0.10 = なので、幅 = 400(0.10) = 40となる。700 − 40 = 660より、走行距離の長いほうの10%の日には少なくとも660マイル走る。
Conditional Probability
条件付き確率
the likelihood that an event will occur given that another event has already occurred.
別の事象がすでに起こったと分かっているとき、ある事象が起こる可能性。