第5章連続確率変数
Homework宿題
Exercises 86–90練習問題 86–90
Exercise 86問題 86
Suppose that the length of phone calls, measured in minutes, is known to have an exponential distribution with the average length of a call equal to eight minutes.
分単位で測った電話の通話時間が、平均8分の指数分布に従うことがわかっているとする。
- Define the random variable. X = ________________.確率変数を定義せよ。X = ________________。
- Is X continuous or discrete?Xは連続型か、それとも離散型か。
- X ~ ________
- μ = ________
- σ = ________
- Draw a graph of the probability distribution. Label the axes.確率分布のグラフを描き、各軸にラベルを付けよ。
- Find the probability that a phone call lasts less than nine minutes.通話時間が9分未満となる確率を求めよ。
- Find the probability that a phone call lasts more than nine minutes.通話時間が9分を超える確率を求めよ。
- Find the probability that a phone call lasts between seven and nine minutes.通話時間が7〜9分となる確率を求めよ。
- If 25 phone calls are made one after another, on average, what would you expect the total to be? Why?25件の電話を続けてかけるとき、合計の通話時間は平均でどれほどになると予想するか。理由も述べよ。
Exercise 87問題 87
Suppose that the useful life of a particular car battery, measured in months, decays with parameter 0.025. We are interested in the life of the battery.
月単位で測ったある自動車用バッテリーの寿命は、母数0.025で減衰するとする。このバッテリーの寿命に関心がある。
- Define the random variable. X = _________________________________.確率変数を定義せよ。X = _________________________________。
- Is X continuous or discrete?Xは連続型か、それとも離散型か。
- X ~ ________
- On average, how long would you expect one car battery to last?自動車用バッテリー1個は平均してどれほど長持ちすると予想するか。
- On average, how long would you expect nine car batteries to last, if they are used one after another?自動車用バッテリー9個を1個ずつ続けて使うと、平均してどれほど長持ちすると予想するか。
- Find the probability that a car battery lasts more than 36 months.自動車用バッテリーが36か月を超えて使える確率を求めよ。
- Seventy percent of the batteries last at least how long?バッテリーの70%は、少なくともどれほど長持ちするか。
Solution解き方
- X = the useful life of a particular car battery, measured in months.X = ある自動車用バッテリーの寿命(月)。
- X is continuous.Xは連続型である。
- X ~ Exp(0.025)
- 40 months40か月。
- 360 months360か月。
- 0.4066
- 14.27
Exercise 88問題 88
At one point in time, the percent of persons (ages five and older) in each state who speak a language at home other than English is approximately exponentially distributed with a mean of 9.848. Suppose we randomly pick a state.
ある時点で、各州の5歳以上の住民のうち家庭で英語以外の言語を話す人の百分率は、平均9.848の指数分布にほぼ従っていた。州を1つ無作為に選ぶとする。
- Define the random variable. X = _________________________________.確率変数を定義せよ。X = _________________________________。
- Is X continuous or discrete?Xは連続型か、それとも離散型か。
- X ~ ________
- μ = ________
- σ = ________
- Draw a graph of the probability distribution. Label the axes.確率分布のグラフを描き、各軸にラベルを付けよ。
- Find the probability that the percent is less than 12.この百分率が12未満である確率を求めよ。
- Find the probability that the percent is between eight and 14.この百分率が8〜14である確率を求めよ。
- The percent of all individuals living in the United States who speak a language at home other than English is 13.8.米国に住むすべての人のうち、家庭で英語以外の言語を話す人の百分率は13.8である。
- Why is this number different from 9.848%?なぜこの数値は9.848%と異なるのか。
- What would make this number higher than 9.848%?何によって、この数値は9.848%より高くなるのか。
Exercise 89問題 89
The time (in years) after reaching age 60 that it takes an individual to retire is approximately exponentially distributed with a mean of about five years. Suppose we randomly pick one retired individual. We are interested in the time after age 60 to retirement.
60歳になってから退職するまでの時間(年)は、平均約5年の指数分布にほぼ従う。退職した人を1人無作為に選ぶとする。60歳から退職までの時間に関心がある。
- Define the random variable. X = _________________________________.確率変数を定義せよ。X = _________________________________。
- Is X continuous or discrete?Xは連続型か、それとも離散型か。
- X ~ = ________
- μ = ________
- σ = ________
- Draw a graph of the probability distribution. Label the axes.確率分布のグラフを描き、各軸にラベルを付けよ。
- Find the probability that the person retired after age 70.その人が70歳を過ぎて退職した確率を求めよ。
- Do more people retire before age 65 or after age 65?65歳より前に退職する人と、65歳より後に退職する人は、どちらが多いか。
- In a room of 1,000 people over age 80, how many do you expect will NOT have retired yet?80歳を超える人が1,000人いる部屋では、まだ退職していない人は何人いると予想するか。
Solution解き方
- X = the time (in years) after reaching age 60 that it takes an individual to retireX = 60歳になってから退職するまでの時間(年)。
- X is continuous.Xは連続型である。
- X ~ Exp
- five5
- five5
- Answers may vary.解答は一通りではない。
- 0.1353
- before65歳より前。
- 18.3
Exercise 90問題 90
The cost of all maintenance for a car during its first year is approximately exponentially distributed with a mean of $150.
英語のヒント
自動車の最初の1年間にかかる整備費用の総額は、平均150ドルの指数分布にほぼ従う。
- Define the random variable. X = _________________________________.確率変数を定義せよ。X = _________________________________。
- X ~ = ________
- μ = ________
- σ = ________
- Draw a graph of the probability distribution. Label the axes.確率分布のグラフを描き、各軸にラベルを付けよ。
- Find the probability that a car required over $300 for maintenance during its first year.自動車の最初の1年間に、整備費用が300ドルを超えてかかる確率を求めよ。
Exercises 91–101練習問題 91–101
Use the following information to answer the next three exercises. The average lifetime of a certain new smartphone is three years. The manufacturer will replace any smartphone failing within two years of the date of purchase. The lifetime of these smartphones is known to follow an exponential distribution.
英語のヒント
次の情報を使って、この後の3問に答えよ。ある新しいスマートフォンの平均寿命は3年である。メーカーは、購入日から2年以内に故障したスマートフォンを交換する。これらのスマートフォンの寿命は指数分布に従うことがわかっている。
Exercise 91問題 91
The decay rate is:
減衰率は次のうちどれか。
- 0.3333
- 0.5000
- 2
- 3
Solution解き方
a
Exercise 92問題 92
What is the probability that a smartphone will fail within two years of the date of purchase?
スマートフォンが購入日から2年以内に故障する確率はいくらか。
- 0.8647
- 0.4866
- 0.2212
- 0.9997
Exercise 93問題 93
What is the median lifetime of these phones (in years)?
これらの電話の寿命の中央値は何年か。
- 0.1941
- 1.3863
- 2.0794
- 5.5452
Solution解き方
c
Exercise 94問題 94
Let X ~ Exp(0.1).
X ~ Exp(0.1)とする。
- decay rate = ________減衰率 = ________
- μ = ________
- Graph the probability distribution function.確率分布関数のグラフを描け。
- On the graph, shade the area corresponding to P(x < 6) and find the probability.グラフ上でP(x < 6)に対応する部分を塗り、その確率を求めよ。
- Sketch a new graph, shade the area corresponding to P(3 < x < 6) and find the probability.新しくグラフを描き、P(3 < x < 6)に対応する部分を塗って、その確率を求めよ。
- Sketch a new graph, shade the area corresponding to P(x < 7) and find the probability.新しくグラフを描き、P(x < 7)に対応する部分を塗って、その確率を求めよ。
- Sketch a new graph, shade the area corresponding to the 40th percentile and find the value.新しくグラフを描き、第40パーセンタイルに対応する部分を塗って、その値を求めよ。
- Find the average value of x.xの平均値を求めよ。
Exercise 95問題 95
Suppose that the longevity of a light bulb is exponential with a mean lifetime of eight years.
電球の寿命が、平均8年の指数分布に従うとする。
- Find the probability that a light bulb lasts less than one year.電球の寿命が1年未満である確率を求めよ。
- Find the probability that a light bulb lasts between six and ten years.電球の寿命が6〜10年である確率を求めよ。
- Seventy percent of all light bulbs last at least how long?電球全体の70%は、少なくともどれほど長持ちするか。
- A company decides to offer a warranty to give refunds to light bulbs whose lifetime is among the lowest two percent of all bulbs. To the nearest month, what should be the cutoff lifetime for the warranty to take place?
英語のヒント
ある会社は、寿命が電球全体の下位2%に入るものについて返金する保証を設けることにした。保証を適用する寿命の上限を、月単位に四捨五入して求めよ。 - If a light bulb has lasted seven years, what is the probability that it fails within the 8th year.電球が7年間使えているとき、8年目のうちに故障する確率はいくらか。
Solution解き方
Let T = the life time of a light bulb.
T = 電球の寿命とする。
The decay parameter is m = 1/8, and T ∼ Exp(1/8). The cumulative distribution function is
減衰母数はm = 1/8であり、T ∼ Exp(1/8)となる。累積分布関数はである。
- Therefore, P(T < 1) = 1 – e ≈ 0.1175.したがって、P(T < 1) = 1 – e ≈ 0.1175となる。
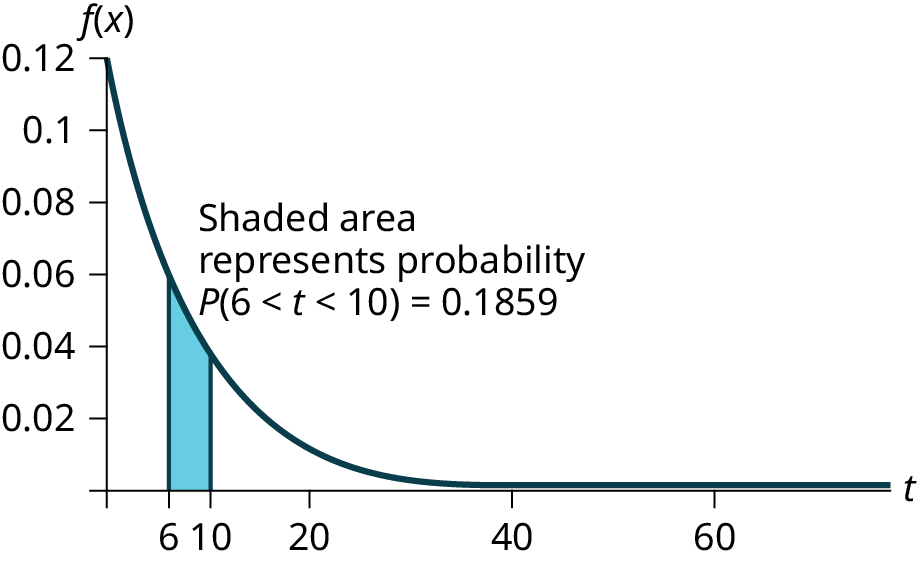
- We want to find P(6 < t < 10).
To do this, P(6 < t < 10) – P(t < 6)
≈ 0.7135 – 0.5276 = 0.1859求めるのはP(6 < t < 10)である。P(6 < t < 10) – P(t < 6) ≈ 0.7135 – 0.5276 = 0.1859と計算する。Figure 5.54図 5.54 - We want to find 0.70
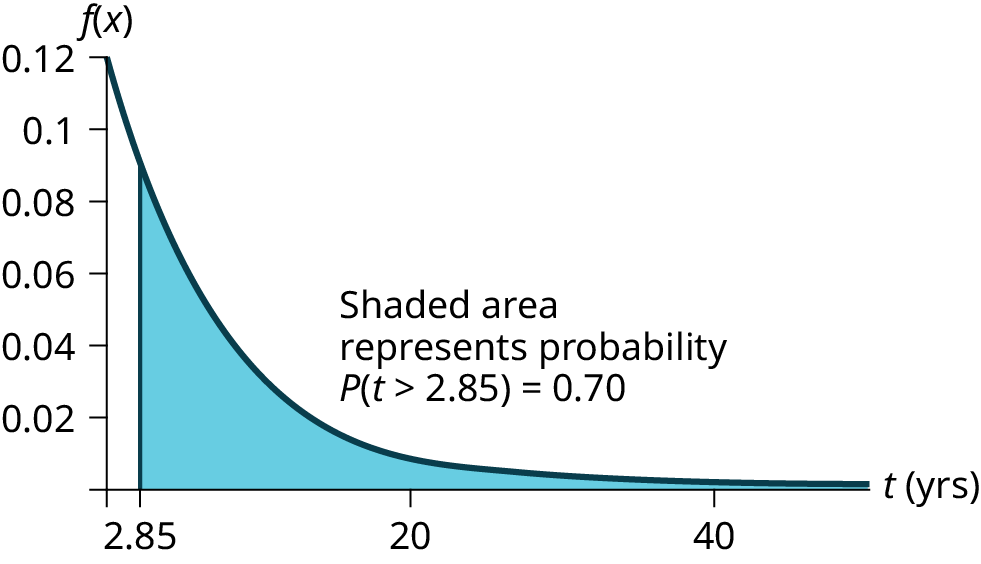
Solving for t, e = 0.70, so = ln(0.70), and t = –8ln(0.70) ≈ 2.85 years.
Or use t = .0.70 となる値を求める。tについて解くと、e = 0.70より = ln(0.70)、したがってt = –8ln(0.70) ≈ 2.85年となる。またはt = を用いる。Figure 5.55図 5.55 - We want to find 0.02 = P(T < t) = 1 – e.
Solving for t, e = 0.98, so = ln(0.98), and t = –8ln(0.98) ≈ 0.1616 years, or roughly two months.
The warranty should cover light bulbs that last less than 2 months.
Or use = 0.1616.0.02 = P(T < t) = 1 – eとなる値を求める。tについて解くと、e = 0.98より = ln(0.98)、したがってt = –8ln(0.98) ≈ 0.1616年、すなわち約2か月となる。保証の対象は、寿命が2か月未満の電球とすればよい。または = 0.1616を用いる。 - We must find P(T < 8|T > 7).
Notice that by the rule of complement events, P(T < 8|T > 7) = 1 – P(T > 8|T > 7).
By the memoryless property (P(X > r + t|X > r) = P(X > t)).
So P(T > 8|T > 7) = P(T > 1) =
Therefore, P(T < 8|T > 7) = 1 – 0.8825 = 0.1175.P(T < 8|T > 7)を求める必要がある。余事象の法則より、P(T < 8|T > 7) = 1 – P(T > 8|T > 7)となる。無記憶性P(X > r + t|X > r) = P(X > t)より、P(T > 8|T > 7) = P(T > 1) = となる。したがって、P(T < 8|T > 7) = 1 – 0.8825 = 0.1175である。


Exercise 96問題 96
At a 911 call center, calls come in at an average rate of one call every two minutes. Assume that the time that elapses from one call to the next has the exponential distribution.
911緊急通報センターには、平均して2分に1件の電話がかかってくる。1件の電話から次の電話までの時間が指数分布に従うと仮定する。
- On average, how much time occurs between five consecutive calls?
英語のヒント
連続する5件の電話の間には、平均でどれほどの時間が経過するか。 - Find the probability that after a call is received, it takes more than three minutes for the next call to occur.電話を1件受けた後、次の電話までに3分を超える時間がかかる確率を求めよ。
- Ninety-percent of all calls occur within how many minutes of the previous call?電話全体の90%は、前の電話から何分以内にかかってくるか。
- Suppose that two minutes have elapsed since the last call. Find the probability that the next call will occur within the next minute.最後の電話から2分経過したとする。次の1分以内に電話がかかってくる確率を求めよ。
- Find the probability that less than 20 calls occur within an hour.1時間にかかってくる電話が20件未満となる確率を求めよ。
Exercise 97問題 97
In major league baseball, a no-hitter is a game in which a pitcher, or pitchers, doesn't give up any hits throughout the game. No-hitters occur at a rate of about three per season. Assume that the duration of time between no-hitters is exponential.
英語のヒント
メジャーリーグの野球では、1人または複数の投手が試合を通して1本も安打を許さない試合をノーヒッターという。ノーヒッターは1シーズンに約3回の頻度で起こる。ノーヒッターの発生間隔が指数分布に従うと仮定する。
- What is the probability that an entire season elapses with a single no-hitter?1シーズンを通してノーヒッターが1回だけ起こる確率はいくらか。
- If an entire season elapses without any no-hitters, what is the probability that there are no no-hitters in the following season?ノーヒッターが一度も起こらず1シーズンが経過したとき、次のシーズンにもノーヒッターが起こらない確率はいくらか。
- What is the probability that there are more than 3 no-hitters in a single season?1シーズンにノーヒッターが3回を超えて起こる確率はいくらか。
Solution解き方
Let X = the number of no-hitters throughout a season. Since the duration of time between no-hitters is exponential, the number of no-hitters per season is Poisson with mean λ = 3.
Therefore, (X = 0) = = e–3 ≈ 0.0498
Therefore, (X = 0) = = e–3 ≈ 0.0498
X = 1シーズンを通したノーヒッターの回数とする。ノーヒッターの発生間隔が指数分布に従うので、1シーズンの回数は平均λ = 3のポアソン分布に従う。したがって、(X = 0) = = e–3 ≈ 0.0498となる。
- The desired probability is P(T > 1) = 1 – P(T < 1) = 1 – (1 – e–3) = e–3 ≈ 0.0498.求める確率はP(T > 1) = 1 – P(T < 1) = 1 – (1 – e–3) = e–3 ≈ 0.0498である。
- Let T = duration of time between no-hitters. We find P(T > 2|T > 1), and by the memoryless property this is simply P(T > 1), which we found to be 0.0498 in part a.T = ノーヒッターの発生間隔とする。P(T > 2|T > 1)を求める。無記憶性より、これはP(T > 1)に等しく、aで求めた0.0498となる。
- Let X = the number of no-hitters is a season. Assume that X is Poisson with mean λ = 3. Then P(X > 3) = 1 – P(X ≤ 3) = 0.3528.X = 1シーズンのノーヒッターの回数とする。Xが平均λ = 3のポアソン分布に従うと仮定すると、P(X > 3) = 1 – P(X ≤ 3) = 0.3528となる。
Exercise 98問題 98
During the years 1998–2012, a total of 29 earthquakes of magnitude greater than 6.5 have occurred in Papua New Guinea. Assume that the time spent waiting between earthquakes is exponential.
1998〜2012年に、パプアニューギニアではマグニチュード6.5を超える地震が合計29回起こった。地震の間の待ち時間が指数分布に従うと仮定する。
- What is the probability that the next earthquake occurs within the next three months?次の地震が今後3か月以内に起こる確率はいくらか。
- Given that six months has passed without an earthquake in Papua New Guinea, what is the probability that the next three months will be free of earthquakes?
英語のヒント
パプアニューギニアで地震が起こらず6か月が経過したとき、その後3か月も地震が起こらない確率はいくらか。 - What is the probability of zero earthquakes occurring in 2014?2014年に地震が一度も起こらない確率はいくらか。
- What is the probability that at least two earthquakes will occur in 2014?2014年に少なくとも2回の地震が起こる確率はいくらか。
Exercise 99問題 99
According to the American Red Cross, about one out of nine people in the U.S. have Type B positive blood. Suppose the blood types of people arriving at a blood drive are independent. In this case, the number of Type B positive blood types that arrive roughly follows the Poisson distribution.
米国赤十字によると、米国の約9人に1人は血液型がB型Rh陽性である。献血会場に来る人々の血液型は独立であるとする。この場合、来場するB型Rh陽性の人数は、おおよそポアソン分布に従う。
- If 100 people arrive, how many on average would be expected to have Type B positive blood?100人が来場したとき、B型Rh陽性の人は平均何人と予想されるか。
- What is the probability that over 10 people out of these 100 have type B positive blood?この100人のうちB型Rh陽性の人が10人を超える確率はいくらか。
- What is the probability that more than 20 people arrive before a person with type B positive blood is found?B型Rh陽性の人が見つかるまでに、20人を超える人が来場する確率はいくらか。
Solution解き方
- = 11.11
- P(X > 10) = 1 – P(X ≤ 10) = 1 – Poissoncdf(11.11, 10) ≈ 0.5532.P(X > 10) = 1 – P(X ≤ 10) = 1 – Poissoncdf(11.11, 10) ≈ 0.5532。
- The number of people with Type B positive blood encountered roughly follows the Poisson distribution, so the number of people X who arrive between successive Type B positive arrivals is roughly exponential with mean μ = 9 and m = . The cumulative distribution function of X is . Thus, P(X > 20) = 1 - P(X ≤ 20) =出会うB型Rh陽性の人数はおおよそポアソン分布に従う。そのため、B型Rh陽性の人が来てから次のB型Rh陽性の人が来るまでの来場者数Xは、平均μ = 9、m = の指数分布にほぼ従う。Xの累積分布関数はである。したがって、P(X > 20) = 1 – P(X ≤ 20) = となる。
Exercise 100問題 100
A web site experiences traffic during normal working hours at a rate of 12 visits per hour. Assume that the duration between visits has the exponential distribution.
英語のヒント
あるウェブサイトには、通常の勤務時間中、1時間に12件のアクセスがある。アクセス間隔が指数分布に従うと仮定する。
- Find the probability that the duration between two successive visits to the web site is more than ten minutes.このウェブサイトへの連続する2回のアクセスの間隔が、10分を超える確率を求めよ。
- The top 25% of durations between visits are at least how long?アクセス間隔の長いほうから25%に入る間隔は、少なくともどれほどか。
- Suppose that 20 minutes have passed since the last visit to the web site. What is the probability that the next visit will occur within the next 5 minutes?このウェブサイトへの最後のアクセスから20分経過したとする。次の5分以内にアクセスがある確率はいくらか。
- Find the probability that less than 7 visits occur within a one-hour period.1時間のアクセスが7件未満となる確率を求めよ。
Exercise 101問題 101
At an urgent care facility, patients arrive at an average rate of one patient every seven minutes. Assume that the duration between arrivals is exponentially distributed.
ある急患診療施設には、平均して7分に1人の患者が来る。患者の到着間隔は指数分布に従うと仮定する。
- Find the probability that the time between two successive visits to the urgent care facility is less than 2 minutes.この急患診療施設への連続する2人の来院間隔が、2分未満となる確率を求めよ。
- Find the probability that the time between two successive visits to the urgent care facility is more than 15 minutes.この急患診療施設への連続する2人の来院間隔が、15分を超える確率を求めよ。
- If 10 minutes have passed since the last arrival, what is the probability that the next person will arrive within the next five minutes?最後の来院から10分経過したとき、次の患者がその後5分以内に来る確率はいくらか。
- Find the probability that more than eight patients arrive during a half-hour period.30分間に8人を超える患者が来る確率を求めよ。
Solution解き方
Let T = duration (in minutes) between successive visits. Since patients arrive at a rate of one patient every seven minutes, μ = 7 and the decay constant is m = . The cdf is P(T < t) =
T = 連続する来院の間隔(分)とする。7分に1人の頻度で来院するので、μ = 7、減衰定数はm = となる。累積分布関数はP(T < t) = である。
- P(T < 2) = 1 - ≈ 0.2485.
- P(T > 15) = .
- P(T > 15|T > 10) = P(T > 5) = .
- Let X = # of patients arriving during a half-hour period. Then X has the Poisson distribution with a mean of , X ∼ Poisson. Find P(X > 8) = 1 – P(X ≤ 8) ≈ 0.0311.X = 30分間に来院する患者数とする。Xは平均のポアソン分布に従い、X ∼ Poissonである。求める確率はP(X > 8) = 1 – P(X ≤ 8) ≈ 0.0311となる。
decay parameter
減衰母数
The decay parameter describes the rate at which probabilities decay to zero for increasing values of x. It is the value m in the probability density function f(x) = me(-mx) of an exponential random variable. It is also equal to m = , where μ is the mean of the random variable.
減衰母数は、xが増加するとき確率が0に向かって減衰する速さを表す。指数確率変数の確率密度関数f(x) = me(-mx)におけるmの値である。また、m = にも等しい。ここでμは確率変数の平均である。
memoryless property
無記憶性
For an exponential random variable X, the memoryless property is the statement that knowledge of what has occurred in the past has no effect on future probabilities. This means that the probability that X exceeds x + k, given that it has exceeded x, is the same as the probability that X would exceed k if we had no knowledge about it. In symbols we say that P(X > x + k|X > x) = P(X > k).
指数確率変数Xの無記憶性とは、過去に何が起きたかを知っても将来の確率は変わらないという性質である。つまり、Xがすでにxを超えたとわかっているときにx + kを超える確率は、Xについて何も知らないときにkを超える確率と同じである。記号ではP(X > x + k|X > x) = P(X > k)と表す。
Poisson distribution
ポアソン分布
If there is a known average of λ events occurring per unit time, and these events are independent of each other, then the number of events X occurring in one unit of time has the Poisson distribution. The probability of k events occurring in one unit time is equal to .
単位時間当たりに起こる事象の平均回数λがわかっており、各事象が互いに独立であるとき、単位時間内の発生回数Xはポアソン分布に従う。単位時間内にk回起こる確率はに等しい。