第10章三角法のさらなる応用Further Applications of Trigonometry
10.7 Parametric Equations: Graphs10.7 媒介変数表示: グラフ
Learning Objectives 学習目標
In this section you will:
この節を終えると、次のことができるようになる。
• Graph plane curves described by parametric equations by plotting points.• Graph parametric equations.
・点を打って、媒介変数表示で述べられた平面曲線のグラフを描く。・媒介変数表示のグラフを描く。
While not every fan (or team manager) appreciates it, baseball and many other sports have become dependent on analytics, which involve complex data recording and quantitative evaluation used to understand and predict behavior. The earliest influence of analytics was mostly statistical; more recently, physics and other sciences have come into play. Foremost among these is the focus on launch angle and exit velocity, which when at certain values can almost guarantee a home run. On the other hand, emphasis on launch angle and focusing on home runs rather than overall hitting results in far more outs. Consider the following situation: it is the bottom of the ninth inning, with two outs and two players on base. The home team is losing by two runs. The batter swings and hits the baseball at 140 feet per second and at an angle of approximately to the horizontal. How far will the ball travel? Will it clear the fence for a game-winning home run? The outcome may depend partly on other factors (for example, the wind), but mathematicians can model the path of a projectile and predict approximately how far it will travel using parametric equations. In this section, we’ll discuss parametric equations and some common applications, such as projectile motion problems.
すべての球団関係者(や監督)が喜ぶわけではないが、野球やほかの多くの競技は分析に頼るようになった。分析とは、ふるまいを理解し予測するために使う、込み入った資料の記録と量的な評価のことである。分析の初めの影響はほとんど統計だったが、より最近では物理やほかの科学も関わってきた。その筆頭が、打ち出しの角と打球の速さへの注目である。この値がある範囲にあると、本塁打がほぼ確実になる。一方で、打ち出しの角を重んじ、全体の打撃の結果より本塁打に絞ると、凡打がはるかに増える。次の状況を考えよう。九回裏、二死走者二人。本拠地の球団は2点負けている。打者が振り、毎秒140フィート、水平からおよそ の角で球を打つ。この球はどれだけ飛ぶか。柵を越えて試合を決める本塁打になるか。結果は一部ほかの要因(たとえば風)にも依るが、数学者は媒介変数表示を使って投射体の道筋をモデル化し、どれだけ飛ぶかをおおよそ予測できる。この節では、媒介変数表示と、投射体の運動の問題のようなよくある応用を論じる。

Graphing Parametric Equations by Plotting Points点を打って媒介変数表示のグラフを描く
In lieu of a graphing calculator or a computer graphing program, plotting points to represent the graph of an equation is the standard method. As long as we are careful in calculating the values, point-plotting is highly dependable.
グラフ電卓や計算機のグラフ描画の算譜が無いなら、点を打って式のグラフを表すのが標準の方法である。値を注意深く計算しさえすれば、点を打つのはとても頼りになる。
How To 手順
Given a pair of parametric equations, sketch a graph by plotting points.
媒介変数表示の組が与えられたとき、点を打ってグラフの概形を描く。
1. Construct a table with three columns: 2. Evaluate and for values of over the interval for which the functions are defined.3. Plot the resulting pairs
1. 三つの列 を持つ表を作る。2. 関数が定義される区間の の値について、 と の値を求める。3. できあがった組 を打つ。
Example 1例1
Sketching the Graph of a Pair of Parametric Equations by Plotting Points点を打って媒介変数表示の組のグラフの概形を描く
Sketch the graph of the parametric equations
媒介変数表示 のグラフの概形を描け。
Solution 解答
Construct a table of values for and as in Table 1, and plot the points in a plane.
表1のように の値の表を作り、平面に点を打つ。
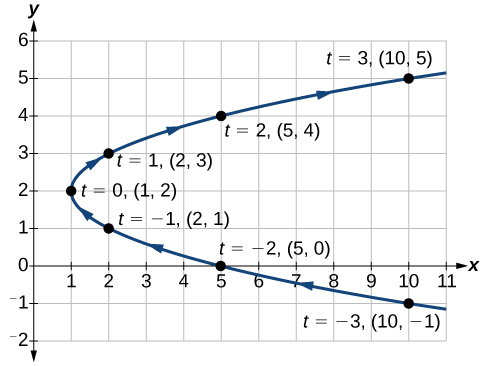
The graph is a parabola with vertex at the point opening to the right. See Figure 2.
このグラフは、点 に頂点を持ち右に開く放物線である。図2を見よ。
Analysis 考察
As values for progress in a positive direction from 0 to 5, the plotted points trace out the top half of the parabola. As values of become negative, they trace out the lower half of the parabola. There are no restrictions on the domain. The arrows indicate direction according to increasing values of The graph does not represent a function, as it will fail the vertical line test. The graph is drawn in two parts: the positive values for and the negative values for
の値が0から5へ正の向きに進むと、打った点は放物線の上半分をたどる。 の値が負になると、放物線の下半分をたどる。定義域に制限は無い。矢印は の値が増える向きを示す。このグラフは縦の直線の判定に落ちるので、関数を表さない。このグラフは二つの部分に分けて描かれる。 の正の値と の負の値である。
Try It #1やってみよう1
Sketch the graph of the parametric equations
媒介変数表示 のグラフの概形を描け。
Example 2例2
Sketching the Graph of Trigonometric Parametric Equations三角の媒介変数表示のグラフの概形を描く
Construct a table of values for the given parametric equations and sketch the graph:
与えられた媒介変数表示の値の表を作り、グラフの概形を描け。
Solution 解答
Construct a table like that in Table 2 using angle measure in radians as inputs for and evaluating and Using angles with known sine and cosine values for makes calculations easier.
表2のように、 の入力としてラジアンでの角の大きさを使い、 と の値を求める表を作る。 に正弦と余弦の値が分かっている角を使うと計算が楽になる。
| 0 | ||
Figure 3 shows the graph.
図3にグラフを示す。
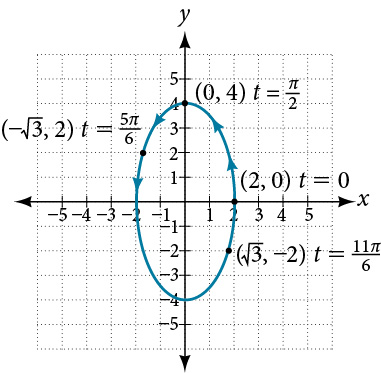
By the symmetry shown in the values of and we see that the parametric equations represent an ellipse. The ellipse is mapped in a counterclockwise direction as shown by the arrows indicating increasing values.
と の値に見える対称性から、この媒介変数表示が楕円を表すと分かる。 の値が増える向きを示す矢印のとおり、この楕円は反時計回りにたどられる。
Analysis 考察
We have seen that parametric equations can be graphed by plotting points. However, a graphing calculator will save some time and reveal nuances in a graph that may be too tedious to discover using only hand calculations.
媒介変数表示は点を打ってグラフに描けると見た。だがグラフ電卓を使えば時間が省け、手計算だけでは見つけるのが面倒すぎるグラフの細かな違いも明らかになる。
Make sure to change the mode on the calculator to parametric (PAR). To confirm, the window should show
電卓のモードを媒介変数(PAR)に必ず変えること。確かめるには、 の画面に次が表示されているはずである。
instead of
の代わりに。
Try It #2やってみよう2
Graph the parametric equations:
媒介変数表示 のグラフを描け。
Example 3例3
Graphing Parametric Equations and Rectangular Form Together媒介変数表示と直交形式を一緒にグラフに描く
Graph the parametric equations and First, construct the graph using data points generated from the parametric form. Then graph the rectangular form of the equation. Compare the two graphs.
媒介変数表示 と のグラフを描け。まず媒介変数の形から生まれる資料の点を使ってグラフを作れ。そしてこの式の直交形式のグラフを描け。二つのグラフを比べよ。
Solution 解答
Construct a table of values like that in Table 3.
表3のような値の表を作る。
Plot the values from the table. See Figure 4.
表の の値を打つ。図4を見よ。
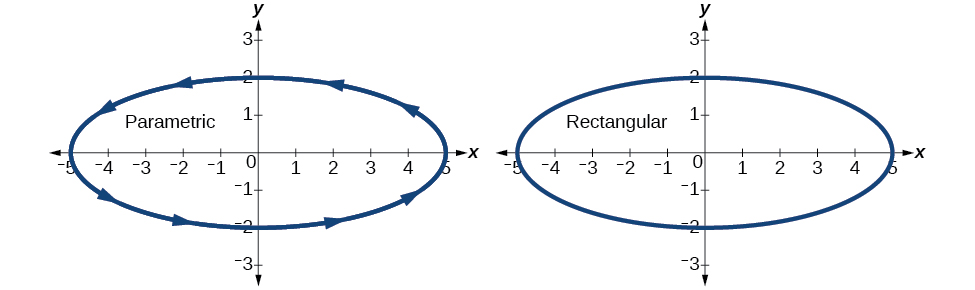
Next, translate the parametric equations to rectangular form. To do this, we solve for in either or and then substitute the expression for in the other equation. The result will be a function if solving for as a function of or if solving for as a function of
次に、媒介変数表示を直交形式に移す。そのために、 か のどちらかで について解き、その の式をもう一方の式に代入する。 の関数として について解くなら関数 、 の関数として について解くなら が結果になる。
Then, use the Pythagorean Theorem.
そしてピタゴラスの定理を使う。
Analysis 考察
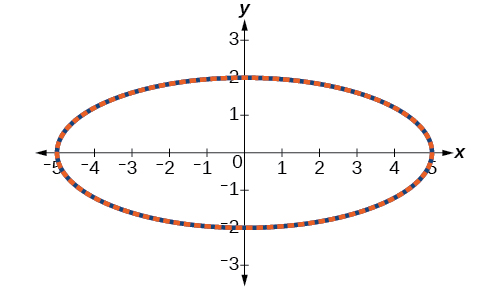
In Figure 5, the data from the parametric equations and the rectangular equation are plotted together. The parametric equations are plotted in blue; the graph for the rectangular equation is drawn on top of the parametric in a dashed style colored red. Clearly, both forms produce the same graph.
図5では、媒介変数表示の資料と直交座標での方程式を一緒に打ってある。媒介変数表示は青で、直交座標での方程式のグラフは媒介変数のものの上に赤い破線で描いてある。明らかに、どちらの形も同じグラフを生む。
Example 4例4
Graphing Parametric Equations and Rectangular Equations on the Coordinate System媒介変数表示と直交座標での方程式を同じ座標系にグラフに描く
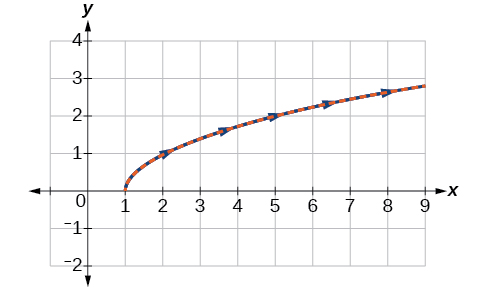
Graph the parametric equations and and the rectangular equivalent on the same coordinate system.
媒介変数表示 と 、および同値な直交座標での方程式 を同じ座標系にグラフに描け。
Solution 解答
Construct a table of values for the parametric equations, as we did in the previous example, and graph on the same grid, as in Figure 6.
前の例でしたのと同じく媒介変数表示の値の表を作り、図6のように同じ格子に のグラフを描く。
Analysis 考察
With the domain on restricted, we only plot positive values of The parametric data is graphed in blue and the graph of the rectangular equation is dashed in red. Once again, we see that the two forms overlap.
の定義域が制限されているので、 の正の値だけを打つ。媒介変数の資料は青、直交座標での方程式のグラフは赤い破線で描いてある。ここでも、二つの形が重なるのが分かる。
Try It #3やってみよう3
Sketch the graph of the parametric equations along with the rectangular equation on the same grid.
媒介変数表示 のグラフの概形を、直交座標での方程式とともに同じ格子に描け。
Applications of Parametric Equations媒介変数表示の応用
Many of the advantages of parametric equations become obvious when applied to solving real-world problems. Although rectangular equations in x and y give an overall picture of an object's path, they do not reveal the position of an object at a specific time. Parametric equations, however, illustrate how the values of x and y change depending on t, as the location of a moving object at a particular time.
媒介変数表示の利点の多くは、現実の問題を解くのに使うとはっきりする。x と y の直交座標での方程式は物の道筋の全体像を与えるが、ある時刻での物の位置は明かさない。だが媒介変数表示は、ある時刻の動く物の位置として、x と y の値が t に応じてどう変わるかを示す。
A common application of parametric equations is solving problems involving projectile motion. In this type of motion, an object is propelled forward in an upward direction forming an angle of to the horizontal, with an initial speed of and at a height above the horizontal.
媒介変数表示のよくある応用は、投射体の運動を含む問題を解くことである。この種の運動では、物が初速 で、水平に対して の角をなす上向きに、水平から高さ のところから前へ打ち出される。
The path of an object propelled at an inclination of to the horizontal, with initial speed and at a height above the horizontal, is given by
水平に対して の傾きで、初速 で、水平から高さ のところから打ち出された物の道筋は、次で与えられる。
where accounts for the effects of gravity and is the initial height of the object. Depending on the units involved in the problem, use or The equation for gives horizontal distance, and the equation for gives the vertical distance.
ここで が重力の効きを表し、 は物の初めの高さである。問題に出てくる単位に応じて か を使う。 の式が水平距離、 の式が鉛直距離を与える。
How To 手順
Given a projectile motion problem, use parametric equations to solve.
投射体の運動の問題が与えられたとき、媒介変数表示を使って解く。
1. The horizontal distance is given by Substitute the initial speed of the object for 2. The expression indicates the angle at which the object is propelled. Substitute that angle in degrees for 3. The vertical distance is given by the formula The term represents the effect of gravity. Depending on units involved, use or Again, substitute the initial speed for and the height at which the object was propelled for 4. Proceed by calculating each term to solve for
1. 水平距離は で与えられる。 に物の初速を代入する。2. 式 は物が打ち出される角を示す。 にその角を度で代入する。3. 鉛直距離は公式 で与えられる。項 が重力の効きを表す。出てくる単位に応じて か を使う。ここでも に初速、 に物が打ち出された高さを代入する。4. 各項を計算して について解き進める。
Example 5例5
Finding the Parametric Equations to Describe the Motion of a Baseball野球の球の運動を述べる媒介変数表示を求める
Solve the problem presented at the beginning of this section. Does the batter hit the game-winning home run? Assume that the ball is hit with an initial velocity of 140 feet per second at an angle of to the horizontal, making contact 3 feet above the ground.
この節の初めに示した問題を解け。この打者は試合を決める本塁打を打つか。球は初速毎秒140フィート、水平に対して の角で、地上3フィートのところで打たれたとする。
ⓐFind the parametric equations to model the path of the baseball.ⓑWhere is the ball after 2 seconds?ⓒHow long is the ball in the air?ⓓIs it a home run?
ⓐこの球の道筋のモデルとなる媒介変数表示を求めよ。ⓑ2秒後、球はどこにあるか。ⓒ球は何秒間空中にあるか。ⓓこれは本塁打か。
Solution 解答
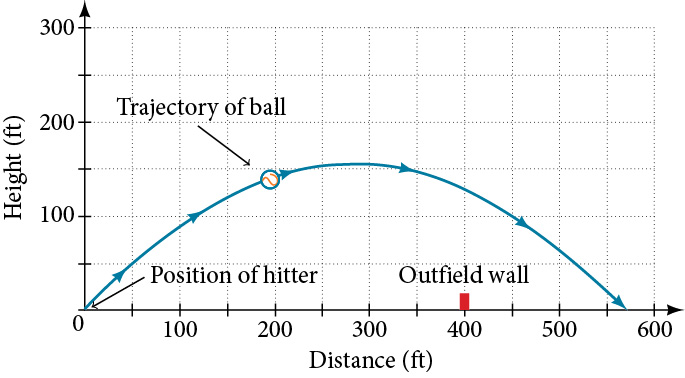
ⓐUse the formulas to set up the equations. The horizontal position is found using the parametric equation for Thus, The vertical position is found using the parametric equation for Thus, ⓑSubstitute 2 into the equations to find the horizontal and vertical positions of the ball.After 2 seconds, the ball is 198 feet away from the batter’s box and 137 feet above the ground.ⓒTo calculate how long the ball is in the air, we have to find out when it will hit ground, or when Thus, When seconds, the ball has hit the ground. (The quadratic equation can be solved in various ways, but this problem was solved using a computer math program.)ⓓWe cannot confirm that the hit was a home run without considering the size of the outfield, which varies from field to field. However, for simplicity’s sake, let’s assume that the outfield wall is 400 feet from home plate in the deepest part of the park. Let’s also assume that the wall is 10 feet high. In order to determine whether the ball clears the wall, we need to calculate how high the ball is when x = 400 feet. So we will set x = 400, solve for and input into The ball is 141.8 feet in the air when it soars out of the ballpark. It was indeed a home run. See Figure 7.
ⓐ公式を使って式を立てる。水平の位置は の媒介変数表示で求める。よって である。鉛直の位置は の媒介変数表示で求める。よって である。ⓑ式に2を代入して、球の水平と鉛直の位置を求める。。2秒後、球は打席から198フィート離れ、地上137フィートにある。ⓒ球が何秒間空中にあるかを計算するには、いつ地面に当たるか、すなわち となるときを求めなければならない。よって である。 秒のとき、球は地面に当たっている。(この二次方程式はいろいろなしかたで解けるが、この問題は計算機の数学の算譜で解いた。)ⓓ球場ごとに違う外野の広さを考えずに、この打球が本塁打だったとは言い切れない。だが話を簡単にするために、外野の壁が球場の最も深いところで本塁から400フィートだとしよう。壁の高さも10フィートだとしよう。球が壁を越えるかどうかを決めるには、x = 400 フィートのとき球がどれだけ高いかを計算する必要がある。そこで x = 400 とおき、 について解き、 に を入れる。。球は球場の外へ飛び出すとき地上141.8フィートにある。実際に本塁打だった。図7を見よ。
Media 教材
Access the following online resource for additional instruction and practice with graphs of parametric equations.
媒介変数表示のグラフについての説明と練習をさらに求めるなら、次のオンライン教材にあたるとよい。
• Graphing Parametric Equations on the TI-84
・TI-84 で媒介変数表示のグラフを描く
Verbal言葉で答える問題
2. What is one difference in point-plotting parametric equations compared to Cartesian equations?
2. 媒介変数表示で点を打つのは、デカルトの式のときとどう違うか。一つ挙げよ。
4. Name a few common types of graphs of parametric equations.
4. 媒介変数表示のグラフのよくある種類をいくつか挙げよ。
Graphicalグラフの問題
For the following exercises, graph each set of parametric equations by making a table of values. Include the orientation on the graph.
次の各問について、値の表を作って各媒介変数表示の組のグラフを描け。グラフに向きを入れよ。
For the following exercises, sketch the curve and include the orientation.
次の各問について、曲線の概形を描き、向きを入れよ。
For the following exercises, graph the equation and include the orientation. Then, write the Cartesian equation.
次の各問について、式のグラフを描き、向きを入れよ。そしてデカルトの式を書け。
For the following exercises, graph the equation and include the orientation.
次の各問について、式のグラフを描き、向きを入れよ。
For the following exercises, use the parametric equations for integers a and b:
次の各問では、整数 a と b について次の媒介変数表示を使え。
34. Graph on the domain where and and include the orientation.
34. かつ として、定義域 でグラフを描き、向きを入れよ。
36. Graph on the domain where and , and include the orientation.
36. かつ として、定義域 でグラフを描き、向きを入れよ。
38. If is 1 more than describe the effect the values of and have on the graph of the parametric equations.
38. が より1大きいとき、 と の値が媒介変数表示のグラフに与える効きを述べよ。
40. What happens if is 1 more than Describe the graph.
40. が より1大きいとどうなるか。そのグラフを述べよ。
For the following exercises, describe the graph of the set of parametric equations.
次の各問について、その媒介変数表示の組のグラフを述べよ。
42. and is linear
42. かつ は一次
44. and is linear
44. かつ は一次
46. Write the parametric equations of an ellipse with center major axis of length 10, minor axis of length 6, and a counterclockwise orientation.
46. 中心 、長軸の長さ10、短軸の長さ6、反時計回りの向きの楕円の媒介変数表示を書け。
For the following exercises, use a graphing utility to graph on the window by on the domain for the following values of and , and include the orientation.
次の各問について、 と の次の値について、定義域 で表示範囲 × にグラフ作成ツールでグラフを描き、向きを入れよ。
Technology機器を使う問題
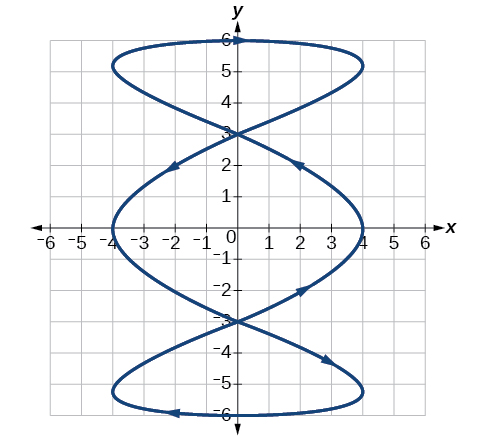
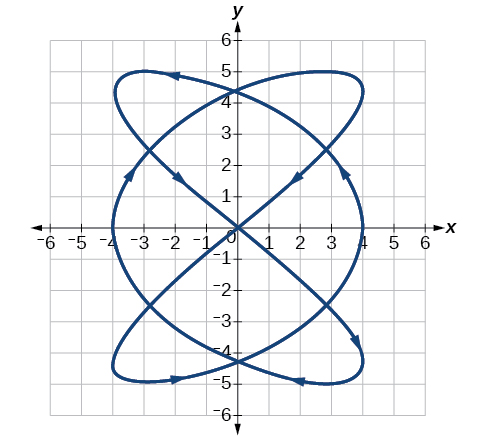
For the following exercises, look at the graphs that were created by parametric equations of the form Use the parametric mode on the graphing calculator to find the values of and to achieve each graph.
次の各問では、 の形の媒介変数表示で作られたグラフを見よ。グラフ電卓の媒介変数のモードを使って、各グラフになる と の値を求めよ。
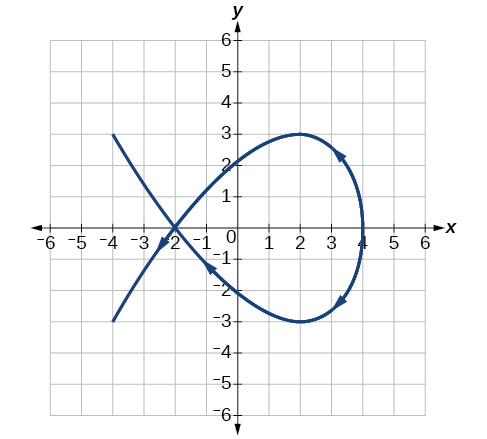
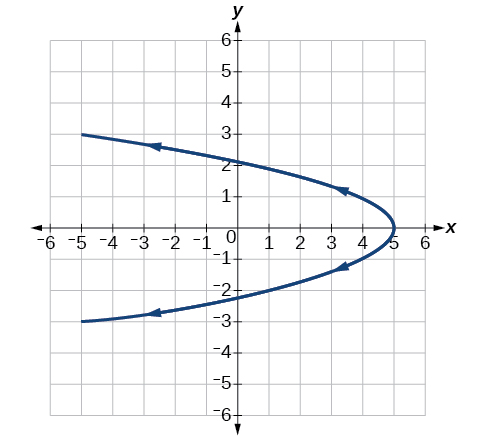
For the following exercises, use a graphing utility to graph the given parametric equations.
次の各問について、グラフ作成ツールを使って与えられた媒介変数表示のグラフを描け。
58. Graph all three sets of parametric equations on the domain
58. 定義域 で、三つの媒介変数表示の組すべてのグラフを描け。
60. The graph of each set of parametric equations appears to “creep” along one of the axes. What controls which axis the graph creeps along?
60. 各媒介変数表示の組のグラフは、座標軸の一方に沿って「這う」ように見える。どちらの軸に沿って這うかは、何で決まるか。
62. Explain the effect on the graph of the parametric equation when we changed the domain.
62. 定義域を変えたとき、媒介変数表示のグラフに現れる効きを説明せよ。
Extensions発展問題
63. An object is thrown in the air with vertical velocity of 20 ft/s and horizontal velocity of 15 ft/s. The object’s height can be described by the equation , while the object moves horizontally with constant velocity 15 ft/s. Write parametric equations for the object’s position, and then eliminate time to write height as a function of horizontal position.
63. ある物が、鉛直の速度毎秒20フィート、水平の速度毎秒15フィートで空中に投げられる。この物の高さは式 で述べられ、一方この物は一定の速度毎秒15フィートで水平に動く。この物の位置の媒介変数表示を書き、そして時間を消して高さを水平の位置の関数として書け。
64. A skateboarder riding on a level surface at a constant speed of 9 ft/s throws a ball in the air, the height of which can be described by the equation Write parametric equations for the ball’s position, and then eliminate time to write height as a function of horizontal position.
64. 平らな面を一定の速さ毎秒9フィートで進むスケートボーダーが球を空中に投げる。その高さは式 で述べられる。この球の位置の媒介変数表示を書き、そして時間を消して高さを水平の位置の関数として書け。
For the following exercises, use this scenario: A dart is thrown upward with an initial velocity of 64 ft/s at an angle of elevation of 52°. Consider the position of the dart at any time Neglect air resistance.
次の各問では、次の筋書きを使え。ダーツが初速毎秒64フィート、仰角52°で上向きに投げられる。任意の時刻 でのダーツの位置を考えよ。空気の抵抗は無視せよ。
66. Find all possible values of that represent the situation.
66. この状況を表す のありうる値をすべて求めよ。
68. Find the maximum height of the dart.
68. ダーツの最大の高さを求めよ。
For the following exercises, look at the graphs of each of the four parametric equations. Although they look unusual and beautiful, they are so common that they have names, as indicated in each exercise. Use a graphing utility to graph each on the indicated domain.
次の各問では、四つの媒介変数表示それぞれのグラフを見よ。珍しく美しく見えるが、あまりによくあるので、各問に示すとおり名前が付いている。グラフ作成ツールを使って、指定された定義域でそれぞれのグラフを描け。
70. An epicycloid: on the domain .
70. 外サイクロイド: 定義域 で 。
72. A hypotrochoid: on the domain .
72. 内トロコイド: 定義域 で 。