第10章三角法のさらなる応用Further Applications of Trigonometry
Graphing Polar Equations by Plotting Points点を打って極方程式のグラフを描く
To graph in the rectangular coordinate system we construct a table of and values. To graph in the polar coordinate system we construct a table of and values. We enter values of into a polar equation and calculate However, using the properties of symmetry and finding key values of and means fewer calculations will be needed.
直交座標系でグラフを描くには、 と の値の表を作る。極座標系でグラフを描くには、 と の値の表を作る。 の値を極方程式に入れて を計算する。だが対称性の性質を使い、 と の要点となる値を求めれば、計算は少なくて済む。
Finding Zeros and Maxima零点と最大値を求める
To find the zeros of a polar equation, we solve for the values of that result in Recall that, to find the zeros of polynomial functions, we set the equation equal to zero and then solve for We use the same process for polar equations. Set and solve for
極方程式の零点を求めるには、 となる の値について解く。多項式関数の零点を求めるには、式を0とおいて について解いたことを思い出そう。極方程式でも同じ手順を使う。 とおいて について解く。
For many of the forms we will encounter, the maximum value of a polar equation is found by substituting those values of into the equation that result in the maximum value of the trigonometric functions. Consider the maximum distance between the curve and the pole is 5 units. The maximum value of the cosine function is 1 when so our polar equation is and the value will yield the maximum
これから出会う形の多くでは、三角関数が最大値になる の値を式に代入すれば、極方程式の最大値が求まる。 を考えよう。曲線と極のあいだの最大の距離は5単位である。余弦関数の最大値は のとき1なので、この極方程式は であり、値 が最大の を生む。
Similarly, the maximum value of the sine function is 1 when and if our polar equation is the value will yield the maximum We may find additional information by calculating values of when These points would be polar axis intercepts, which may be helpful in drawing the graph and identifying the curve of a polar equation.
同じように、正弦関数の最大値は のとき1であり、極方程式が なら、値 が最大の を生む。 のときの の値を計算すれば、さらに情報が得られる。この点は極軸との切片であり、グラフを描いて極方程式の曲線を見分けるのに役立つ。
Example 2例2
Finding Zeros and Maximum Values for a Polar Equation極方程式の零点と最大値を求める
Using the equation in Example 1, find the zeros and maximum and, if necessary, the polar axis intercepts of
例1の式を使って、 の零点と最大の 、そして必要なら極軸との切片を求めよ。
Solution 解答
To find the zeros, set equal to zero and solve for
零点を求めるには、 を0とおいて について解く。
Substitute any one of the values into the equation. We will use
の値のどれか一つを式に代入する。 を使う。
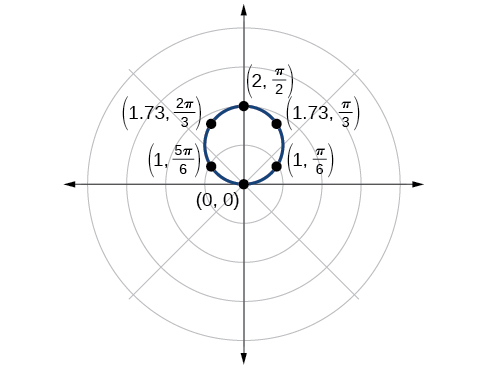
The points and are the zeros of the equation. They all coincide, so only one point is visible on the graph. This point is also the only polar axis intercept.
点 と がこの式の零点である。どれも重なるので、グラフには点が一つしか見えない。この点は唯一の極軸との切片でもある。
To find the maximum value of the equation, look at the maximum value of the trigonometric function which occurs when resulting in Substitute for
この式の最大値を求めるには、三角関数 の最大値を見る。それは のときで、 になる。 に を代入する。
Try It #2やってみよう2
Without converting to Cartesian coordinates, test the given equation for symmetry and find the zeros and maximum values of
デカルト座標に直さずに、与えられた式 の対称性を調べ、 の零点と最大値を求めよ。
Investigating Circles円を調べる
Now we have seen the equation of a circle in the polar coordinate system. In the last two examples, the same equation was used to illustrate the properties of symmetry and demonstrate how to find the zeros, maximum values, and plotted points that produced the graphs. However, the circle is only one of many shapes in the set of polar curves.
これで極座標系での円の式を見た。前の二つの例では、同じ式を使って対称性の性質を示し、零点・最大値・グラフを生む打つべき点の求め方を示した。だが円は、極の曲線の組にある多くの形のうちの一つにすぎない。
There are five classic polar curves: cardioids, limaҫons, lemniscates, rose curves, and Archimedes’ spirals. We will briefly touch on the polar formulas for the circle before moving on to the classic curves and their variations.
古典的な極の曲線が五つある。カージオイド、リマソン、レムニスケート、バラ曲線、アルキメデスの渦巻きである。古典的な曲線とその変形に移る前に、円の極の公式に簡単に触れる。
Formulas for the Equation of a Circle 円の極方程式
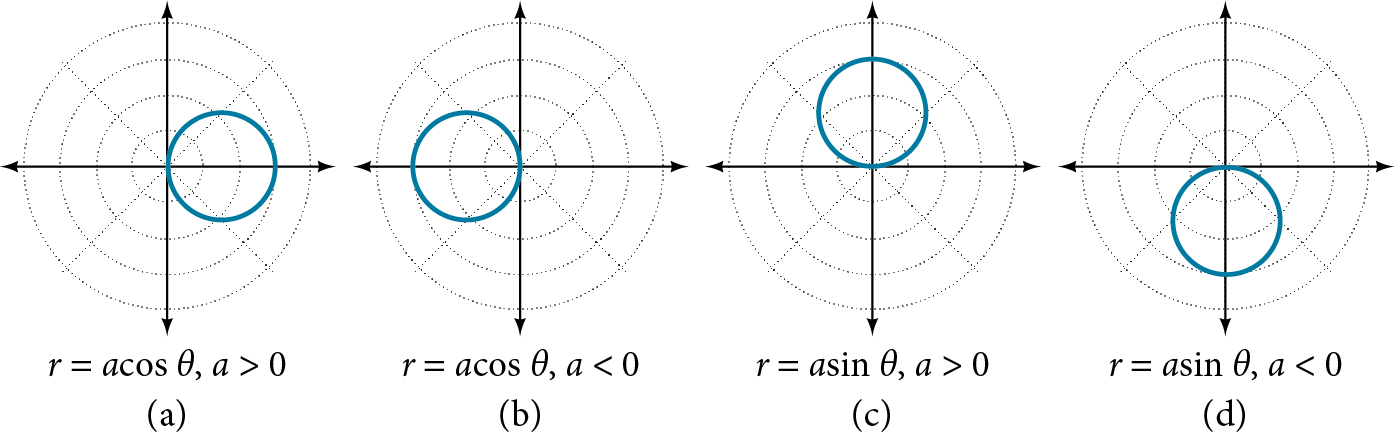
Some of the formulas that produce the graph of a circle in polar coordinates are given by and where is the diameter of the circle or the distance from the pole to the farthest point on the circumference. The radius is or one-half the diameter. For the center is For the center is Figure 5 shows the graphs of these four circles.
極座標で円のグラフを生む公式のいくつかは と で与えられる。ここで は円の直径、すなわち極から円周上の最も遠い点までの距離である。半径は 、すなわち直径の半分である。 では中心が 、 では中心が である。図5にこの四つの円のグラフを示す。
Example 3例3
Sketching the Graph of a Polar Equation for a Circle円の極方程式のグラフの概形を描く
Sketch the graph of
のグラフの概形を描け。
Solution 解答
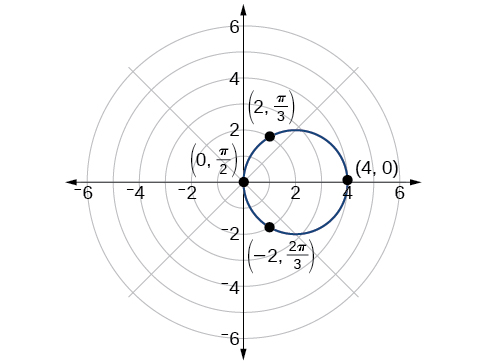
First, testing the equation for symmetry, we find that the graph is symmetric about the polar axis. Next, we find the zeros and maximum for First, set and solve for . Thus, a zero occurs at A key point to plot is
まず式の対称性を調べると、このグラフは極軸に関して対称だと分かる。次に の零点と最大の を求める。まず とおいて について解く。よって零点は に現れる。打つべき要点は である。
To find the maximum value of note that the maximum value of the cosine function is 1 when Substitute into the equation:
の最大値を求めるために、余弦関数の最大値が のとき1であることに注意する。式に を代入する。
The maximum value of the equation is 4. A key point to plot is
この式の最大値は4である。打つべき要点は である。
As is symmetric with respect to the polar axis, we only need to calculate r-values for over the interval Points in the upper quadrant can then be reflected to the lower quadrant. Make a table of values similar to Table 3. The graph is shown in Figure 6.
は極軸に関して対称なので、区間 の について r の値を計算すればよい。そして上の象限の点を下の象限に折り返せる。表3のような値の表を作る。グラフを図6に示す。
| 0 | |||||||||
| 4 | 3.46 | 2.83 | 2 | 0 | −2 | −2.83 | −3.46 | −4 |
Investigating Cardioidsカージオイドを調べる
While translating from polar coordinates to Cartesian coordinates may seem simpler in some instances, graphing the classic curves is actually less complicated in the polar system. The next curve is called a cardioid, as it resembles a heart. This shape is often included with the family of curves called limaçons, but here we will discuss the cardioid on its own.
極座標からデカルト座標へ移すほうが簡単に見える場合もあるが、古典的な曲線のグラフを描くのは実は極の系のほうが込み入っていない。次の曲線は心臓に似ているのでカージオイドと呼ばれる。この形はしばしばリマソンと呼ばれる曲線の族に含められるが、ここではカージオイドを単独で論じる。
Formulas for a Cardioid カージオイドの方程式
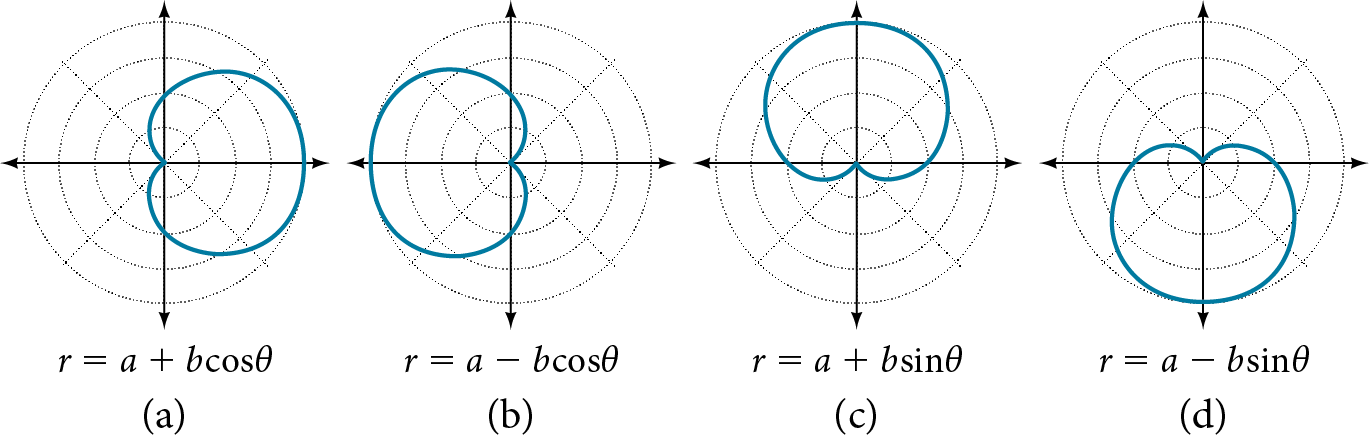
The formulas that produce the graphs of a cardioid are given by and where and The cardioid graph passes through the pole, as we can see in Figure 7.
カージオイドのグラフを生む公式は と で与えられる。ここで 、、 である。図7から分かるとおり、カージオイドのグラフは極を通る。
How To 手順
Given the polar equation of a cardioid, sketch its graph.
カージオイドの極方程式が与えられたとき、そのグラフの概形を描く。
1. Check equation for the three types of symmetry.2. Find the zeros. Set 3. Find the maximum value of the equation according to the maximum value of the trigonometric expression.4. Make a table of values for and 5. Plot the points and sketch the graph.
1. 三つの種類の対称性について式を調べる。2. 零点を求める。 とおく。3. 三角関数の式の最大値に応じて、式の最大値を求める。4. と の値の表を作る。5. 点を打ち、グラフの概形を描く。
Example 4例4
Sketching the Graph of a Cardioidカージオイドのグラフの概形を描く
Sketch the graph of
のグラフの概形を描け。
Solution 解答
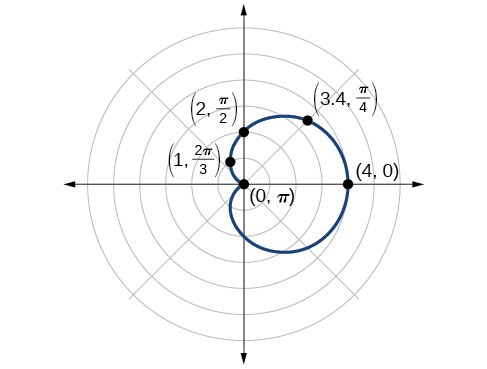
First, testing the equation for symmetry, we find that the graph of this equation will be symmetric about the polar axis. Next, we find the zeros and maximums. Setting we have The zero of the equation is located at The graph passes through this point.
まず式の対称性を調べると、この式のグラフは極軸に関して対称だと分かる。次に零点と最大値を求める。 とおくと である。この式の零点は にある。グラフはこの点を通る。
The maximum value of occurs when is a maximum, which is when or when Substitute into the equation, and solve for
の最大値は が最大のとき、すなわち のとき、つまり のときに現れる。式に を代入し、 について解く。
The point is the maximum value on the graph.
点 がグラフ上の最大値である。
We found that the polar equation is symmetric with respect to the polar axis, but as it extends to all four quadrants, we need to plot values over the interval The upper portion of the graph is then reflected over the polar axis. Next, we make a table of values, as in Table 4, and then we plot the points and draw the graph. See Figure 8.
この極方程式は極軸に関して対称だと分かったが、四つの象限すべてに広がるので、区間 で値を打つ必要がある。そしてグラフの上の部分を極軸に関して折り返す。次に表4のような値の表を作り、点を打ってグラフを描く。図8を見よ。
| 4 | 3.41 | 2 | 1 | 0 |
Investigating Limaçonsリマソンを調べる
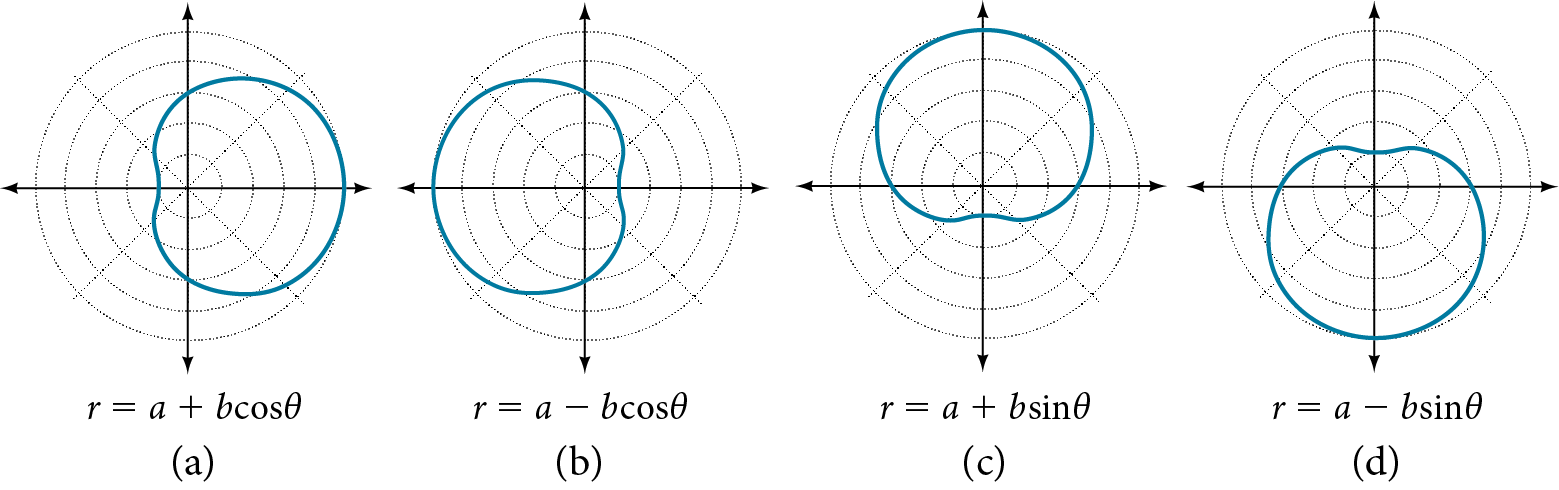
The word limaçon is Old French for “snail,” a name that describes the shape of the graph. As mentioned earlier, the cardioid is a member of the limaçon family, and we can see the similarities in the graphs. The other images in this category include the one-loop limaçon and the two-loop (or inner-loop) limaçon. One-loop limaçons are sometimes referred to as dimpled limaçons when and convex limaçons when
リマソンという語は古フランス語で「カタツムリ」を意味し、グラフの形を述べる名である。先に述べたとおり、カージオイドはリマソンの族の一員であり、グラフに似たところが見てとれる。この分類のほかの図には、一つの輪のリマソンと、二つの輪(すなわち内輪)のリマソンがある。一つの輪のリマソンは、 のときへこみのあるリマソン、 のとき凸のリマソンと呼ばれることがある。
Formulas for One-Loop Limaçons 内側のループを持たないリマソンの方程式
The formulas that produce the graph of a dimpled one-loop limaçon are given by and where All four graphs are shown in Figure 9.
へこみのある一つの輪のリマソンのグラフを生む公式は と で与えられる。ここで 、 である。四つのグラフをすべて図9に示す。
How To 手順
Given a polar equation for a one-loop limaçon, sketch the graph.
一つの輪のリマソンの極方程式が与えられたとき、そのグラフを描く。
1. Test the equation for symmetry. Remember that failing a symmetry test does not mean that the shape will not exhibit symmetry. Often the symmetry may reveal itself when the points are plotted.2. Find the zeros.3. Find the maximum values according to the trigonometric expression.4. Make a table.5. Plot the points and sketch the graph.
1. 式の対称性を調べる。対称性の判定に落ちても、その形が対称性を示さないとは限らないことを忘れないでほしい。点を打つと対称性が現れることがしばしばある。2. 零点を求める。3. 三角関数の式に応じて最大値を求める。4. 表を作る。5. 点を打ち、グラフの概形を描く。
Example 5例5
Sketching the Graph of a One-Loop Limaçon一つの輪のリマソンのグラフの概形を描く
Graph the equation
式 のグラフを描け。
Solution 解答
First, testing the equation for symmetry, we find that it fails all three symmetry tests, meaning that the graph may or may not exhibit symmetry, so we cannot use the symmetry to help us graph it. However, this equation has a graph that clearly displays symmetry with respect to the line yet it fails all the three symmetry tests. A graphing calculator will immediately illustrate the graph’s reflective quality.
まず式の対称性を調べると、三つの対称性の判定すべてに落ちると分かる。つまりグラフは対称性を示すかもしれないし示さないかもしれないので、対称性を手がかりにグラフを描くことはできない。だがこの式のグラフは、直線 に関する対称性をはっきり示すのに、三つの対称性の判定すべてに落ちる。グラフ電卓を使えば、このグラフの折り返しの性質がすぐに見てとれる。
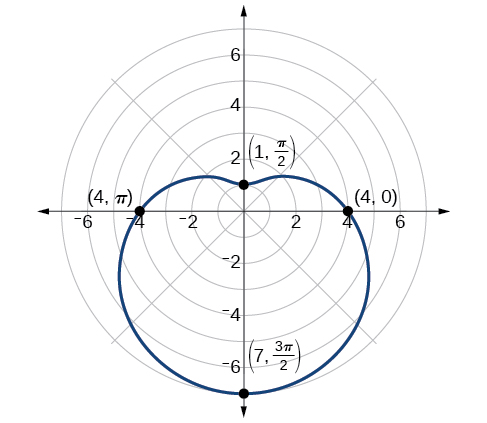
Next, we find the zeros and maximum, and plot the reflecting points to verify any symmetry. Setting results in being undefined. What does this mean? How could be undefined? The angle is undefined for any value of Therefore, is undefined because there is no value of for which Consequently, the graph does not pass through the pole. Perhaps the graph does cross the polar axis, but not at the pole. We can investigate other intercepts by calculating when
次に零点と最大値を求め、対称性を確かめるために折り返した点を打つ。 とおくと が定義されなくなる。これはどういうことか。 が定義されないとはどういうことか。角 は のどの値についても定義されない。したがって、 となる の値が無いので は定義されない。よってこのグラフは極を通らない。グラフは極軸を横切るかもしれないが、極ではない。 のときの を計算すれば、ほかの切片が調べられる。
So, there is at least one polar axis intercept at
よって、極軸との切片が少なくとも一つ にある。
Next, as the maximum value of the sine function is 1 when we will substitute into the equation and solve for Thus,
次に、正弦関数の最大値は のとき1なので、式に を代入して について解く。よって である。
Make a table of the coordinates similar to Table 5.
表5のような座標の表を作る。
| 4 | 2.5 | 1.4 | 1 | 1.4 | 2.5 | 4 | 5.5 | 6.6 | 7 | 6.6 | 5.5 | 4 |
The graph is shown in Figure 10.
グラフを図10に示す。
Analysis 考察
This is an example of a curve for which making a table of values is critical to producing an accurate graph. The symmetry tests fail; the zero is undefined. While it may be apparent that an equation involving is likely symmetric with respect to the line evaluating more points helps to verify that the graph is correct.
これは、正しいグラフを描くのに値の表を作ることが欠かせない曲線の例である。対称性の判定は落ち、零点は定義されない。 を含む式が直線 に関して対称らしいのは明らかかもしれないが、点をもっと求めれば、グラフが正しいと確かめるのに役立つ。
Try It #3やってみよう3
Sketch the graph of
のグラフの概形を描け。
Another type of limaçon, the inner-loop limaçon, is named for the loop formed inside the general limaçon shape. It was discovered by the German artist Albrecht Dürer(1471-1528), who revealed a method for drawing the inner-loop limaçon in his 1525 book Underweysung der Messing. A century later, the father of mathematician Blaise Pascal, Étienne Pascal(1588-1651), rediscovered it.
もう一つの種類のリマソン、内輪のリマソンは、一般のリマソンの形の内側にできる輪から名づけられた。ドイツの画家アルブレヒト・デューラー(1471-1528)が見いだし、1525年の著書『測定法教則』で内輪のリマソンを描く方法を明かした。1世紀後、数学者ブレーズ・パスカルの父エティエンヌ・パスカル(1588-1651)がこれを再発見した。
Formulas for Inner-Loop Limaçons 内側にループを持つリマソンの方程式
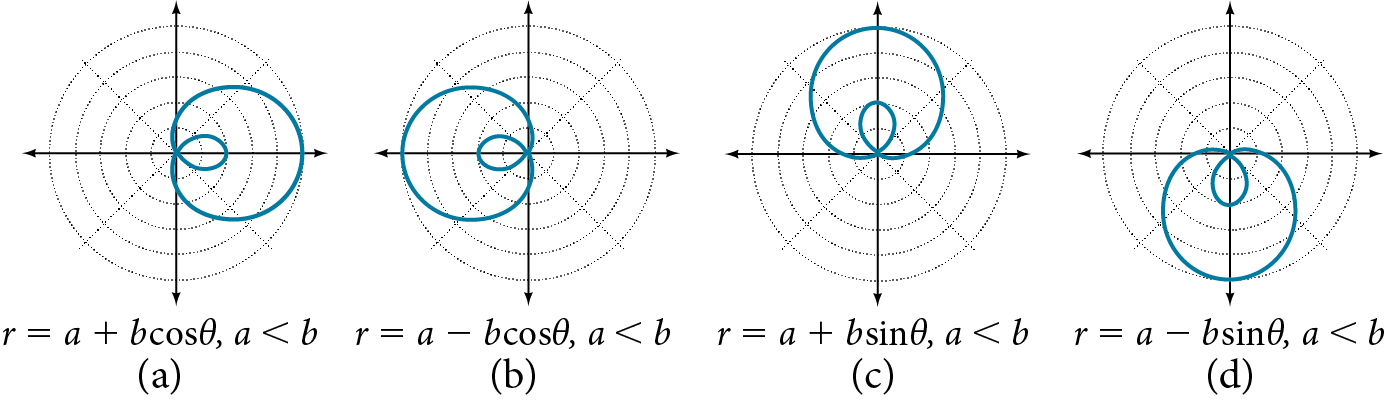
The formulas that generate the inner-loop limaçons are given by and where and The graph of the inner-loop limaçon passes through the pole twice: once for the outer loop, and once for the inner loop. See Figure 11 for the graphs.
内輪のリマソンを生む公式は と で与えられる。ここで 、、 である。内輪のリマソンのグラフは極を二度通る。外側の輪で一度、内側の輪で一度である。グラフは図11を見よ。
Example 6例6
Sketching the Graph of an Inner-Loop Limaçon内輪のリマソンのグラフの概形を描く
Sketch the graph of
のグラフの概形を描け。
Solution 解答
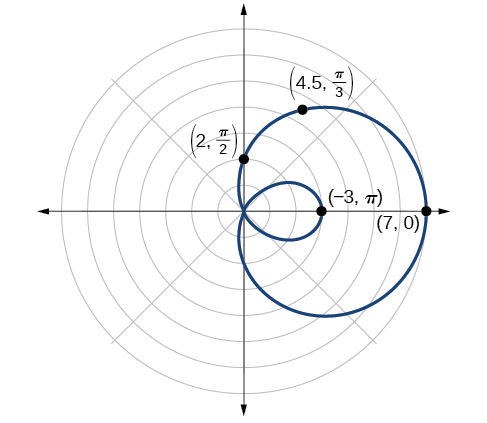
Testing for symmetry, we find that the graph of the equation is symmetric about the polar axis. Next, finding the zeros reveals that when The maximum is found when or when Thus, the maximum is found at the point (7, 0).
対称性を調べると、この式のグラフは極軸に関して対称だと分かる。次に零点を求めると、 のとき だと分かる。最大の は のとき、すなわち のときに求まる。よって最大値は点 (7, 0) にある。
Even though we have found symmetry, the zero, and the maximum, plotting more points will help to define the shape, and then a pattern will emerge.
対称性・零点・最大値は求まったが、点をもっと打てば形がはっきりし、そして型が現れる。
See Table 6.
表6を見よ。
| 7 | 6.3 | 4.5 | 2 | −0.5 | −2.3 | −3 | −2.3 | −0.5 | 2 | 4.5 | 6.3 | 7 |
As expected, the values begin to repeat after The graph is shown in Figure 12.
見込みどおり、 の後で値が繰り返し始める。グラフを図12に示す。
Investigating Lemniscatesレムニスケートを調べる
The lemniscate is a polar curve resembling the infinity symbol or a figure 8. Centered at the pole, a lemniscate is symmetrical by definition.
レムニスケートは、無限大の記号 すなわち数字の8に似た極の曲線である。極を中心とし、レムニスケートは定義により対称である。
Formulas for Lemniscates レムニスケートの方程式
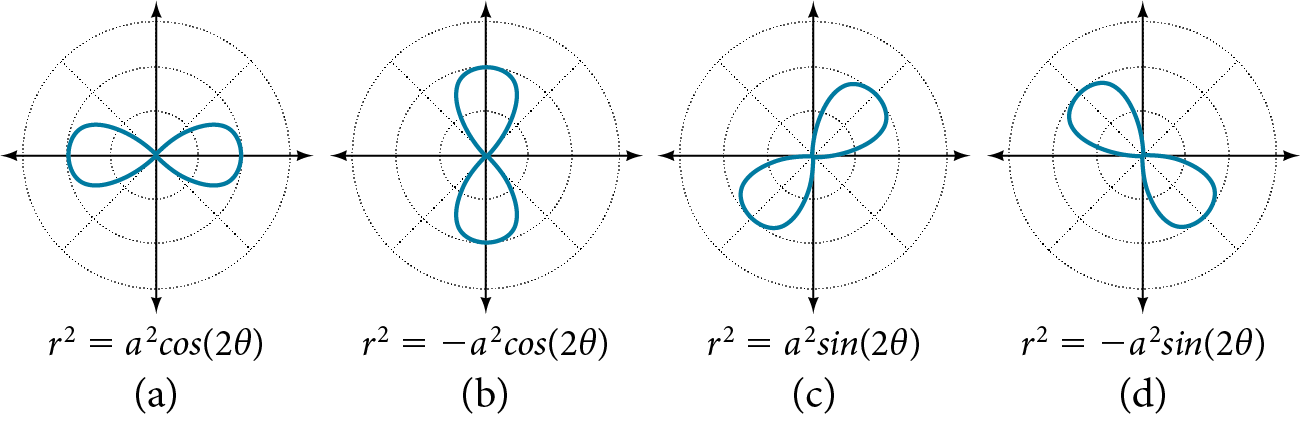
The formulas that generate the graph of a lemniscate are given by and where The formula is symmetric with respect to the pole. The formula is symmetric with respect to the pole, the line and the polar axis. See Figure 13 for the graphs.
レムニスケートのグラフを生む公式は と で与えられる。ここで である。公式 は極に関して対称である。公式 は極・直線 ・極軸に関して対称である。グラフは図13を見よ。
Example 7例7
Sketching the Graph of a Lemniscateレムニスケートのグラフの概形を描く
Sketch the graph of
のグラフの概形を描け。
Solution 解答
The equation exhibits symmetry with respect to the line the polar axis, and the pole.
この式は直線 ・極軸・極に関する対称性を示す。
Let’s find the zeros. It should be routine by now, but we will approach this equation a little differently by making the substitution
零点を求めよう。もう手慣れているはずだが、置き換え をして、この式には少し違うしかたで取り組む。
So, the point is a zero of the equation.
よって点 がこの式の零点である。
Now let’s find the maximum value. Since the maximum of when the maximum when Thus,
次に最大値を求めよう。 のとき が最大なので、 のとき が最大である。よって、
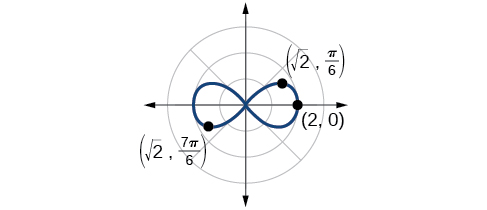
We have a maximum at (2, 0). Since this graph is symmetric with respect to the pole, the line and the polar axis, we only need to plot points in the first quadrant.
(2, 0) に最大値がある。このグラフは極・直線 ・極軸に関して対称なので、第1象限の点だけを打てばよい。
Make a table similar to Table 7.
表7のような表を作る。
| 0 | |||
| 0 |
Plot the points on the graph, such as the one shown in Figure 14.
図14に示すように、グラフに点を打つ。
Analysis 考察
Making a substitution such as is a common practice in mathematics because it can make calculations simpler. However, we must not forget to replace the substitution term with the original term at the end, and then solve for the unknown.
のような置き換えは、計算を簡単にできるので数学でよく使われる。だが最後に置き換えた項を元の項に戻し、未知の値について解くのを忘れてはならない。
Some of the points on this graph may not show up using the Trace function on the TI-84 graphing calculator, and the calculator table may show an error for these same points of This is because there are no real square roots for these values of In other words, the corresponding r-values of are complex numbers because there is a negative number under the radical.
このグラフの点のいくつかは、TI-84 グラフ電卓の Trace 機能では出てこないかもしれず、電卓の表でも同じ の点で誤りが出るかもしれない。これは、 のこの値に対して実の平方根が無いからである。言い換えれば、根号の中が負の数なので、対応する の r の値は複素数である。
Investigating Rose Curvesバラ曲線を調べる
The next type of polar equation produces a petal-like shape called a rose curve. Although the graphs look complex, a simple polar equation generates the pattern.
次の種類の極方程式は、バラ曲線と呼ばれる花びらのような形を生む。グラフは込み入って見えるが、単純な極方程式がこの型を生む。
Rose Curves バラ曲線
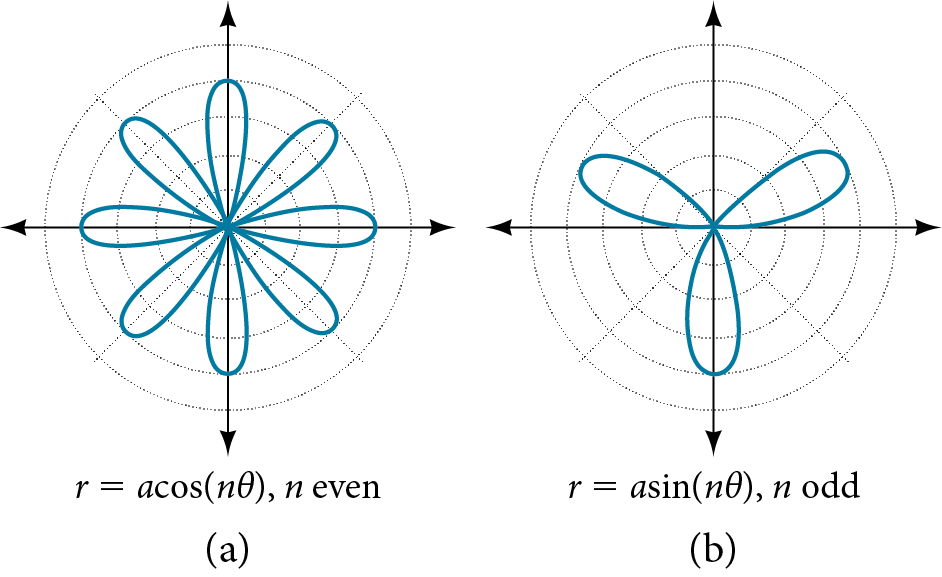
The formulas that generate the graph of a rose curve are given by and where If is even, the curve has petals. If is odd, the curve has petals. See Figure 15.
バラ曲線のグラフを生む公式は と で与えられる。ここで である。 が偶数なら、この曲線の花びらは 枚である。 が奇数なら、この曲線の花びらは 枚である。図15を見よ。
Example 8例8
Sketching the Graph of a Rose Curve (n Even)バラ曲線のグラフの概形を描く(n が偶数)
Sketch the graph of
のグラフの概形を描け。
Solution 解答
Testing for symmetry, we find again that the symmetry tests do not tell the whole story. The graph is not only symmetric with respect to the polar axis, but also with respect to the line and the pole.
対称性を調べると、ここでも対称性の判定はすべてを語らないと分かる。このグラフは極軸に関してだけでなく、直線 と極に関しても対称である。
Now we will find the zeros. First make the substitution
次に零点を求める。まず置き換え をする。
The zero is The point is on the curve.
零点は である。点 が曲線上にある。
Next, we find the maximum We know that the maximum value of when Thus,
次に最大の を求める。 のとき の最大値になると分かっている。よって、
The point is on the curve.
点 が曲線上にある。
The graph of the rose curve has unique properties, which are revealed in Table 8.
バラ曲線のグラフには独特の性質があり、表8に現れる。
| 0 | |||||||
| 2 | 0 | −2 | 0 | 2 | 0 | −2 |
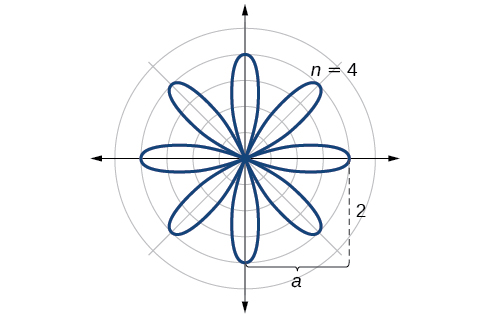
As when it makes sense to divide values in the table by units. A definite pattern emerges. Look at the range of r-values: 2, 0, −2, 0, 2, 0, −2, and so on. This represents the development of the curve one petal at a time. Starting at each petal extends out a distance of and then turns back to zero times for a total of eight petals. See the graph in Figure 16.
のとき なので、表の値を 単位で分けるのが理にかなっている。はっきりした型が現れる。r の値の範囲を見よ。2、0、−2、0、2、0、−2、と続く。これは、この曲線が花びらを一枚ずつ描いていくようすを表している。 から始めて、各花びらが の距離だけ伸び、そして0に戻ることを 回繰り返し、合わせて八枚の花びらになる。図16のグラフを見よ。
Analysis 考察
When these curves are drawn, it is best to plot the points in order, as in the Table 8. This allows us to see how the graph hits a maximum (the tip of a petal), loops back crossing the pole, hits the opposite maximum, and loops back to the pole. The action is continuous until all the petals are drawn.
この曲線を描くときは、表8のように順に点を打つのが最も良い。そうすれば、グラフが最大値(花びらの先)に達し、輪を描いて極を横切り、反対の最大値に達し、また極に戻るようすが見てとれる。この動きは、すべての花びらが描かれるまで続く。
Try It #4やってみよう4
Sketch the graph of
のグラフの概形を描け。
Example 9例9
Sketching the Graph of a Rose Curve (n Odd)バラ曲線のグラフの概形を描く(n が奇数)
Sketch the graph of
のグラフの概形を描け。
Solution 解答
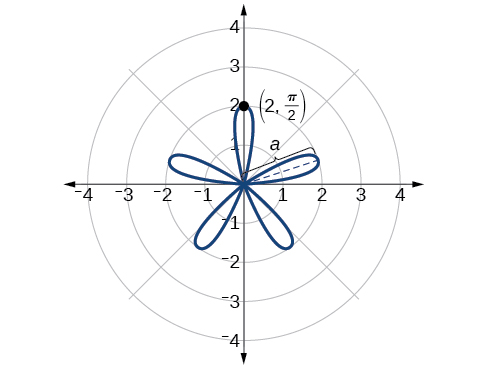
The graph of the equation shows symmetry with respect to the line Next, find the zeros and maximum. We will want to make the substitution
この式のグラフは直線 に関する対称性を示す。次に零点と最大値を求める。置き換え をする。
The maximum value is calculated at the angle where is a maximum. Therefore,
最大値は が最大になる角のところで計算される。したがって、
Thus, the maximum value of the polar equation is 2. This is the length of each petal. As the curve for odd yields the same number of petals as there will be five petals on the graph. See Figure 17.
よってこの極方程式の最大値は2である。これが各花びらの長さである。 が奇数の曲線は と同じ数の花びらを生むので、グラフには五枚の花びらがある。図17を見よ。
Create a table of values similar to Table 9.
表9のような値の表を作る。
| 0 | |||||||
| 0 | 1 | −1.73 | 2 | −1.73 | 1 | 0 |
Try It #5やってみよう5
Sketch the graph of
のグラフの概形を描け。
Investigating the Archimedes’ Spiralアルキメデスの渦巻きを調べる
The final polar equation we will discuss is the Archimedes’ spiral, named for its discoverer, the Greek mathematician Archimedes (c. 287 BCE-c. 212 BCE), who is credited with numerous discoveries in the fields of geometry and mechanics.
最後に論じる極方程式はアルキメデスの渦巻きである。これは見いだしたギリシアの数学者アルキメデス(紀元前287年頃〜紀元前212年頃)にちなむ。彼は幾何と力学の分野で数多くの発見をしたとされる。
Archimedes’ Spiral アルキメデスのらせん
The formula that generates the graph of the Archimedes’ spiral is given by for As increases, increases at a constant rate in an ever-widening, never-ending, spiraling path. See Figure 18.
アルキメデスの渦巻きのグラフを生む公式は、 について で与えられる。 が増えると、 は一定の割合で増え、どこまでも広がり終わることのない渦を描く道筋になる。図18を見よ。
![Two graphs side by side of Archimedes' spiral. (A) is r= theta, [0, 2pi]. (B) is r=theta, [0, 4pi]. Both start at origin and spiral out counterclockwise. The second has two spirals out while the first has one.](img/34c75489d723ad46c6f693a2b0e61a12819d3520.png)
How To 手順
Given an Archimedes’ spiral over sketch the graph.
のアルキメデスの渦巻きが与えられたとき、そのグラフの概形を描く。
1. Make a table of values for and over the given domain.2. Plot the points and sketch the graph.
1. 与えられた定義域で と の値の表を作る。2. 点を打ち、グラフの概形を描く。
Example 10例10
Sketching the Graph of an Archimedes’ Spiralアルキメデスの渦巻きのグラフの概形を描く
Sketch the graph of over
で のグラフの概形を描け。
Solution 解答
As is equal to the plot of the Archimedes’ spiral begins at the pole at the point (0, 0). While the graph hints of symmetry, there is no formal symmetry with regard to passing the symmetry tests. Further, there is no maximum value, unless the domain is restricted.
が に等しいので、アルキメデスの渦巻きの図は極の点 (0, 0) から始まる。グラフは対称性を思わせるが、対称性の判定に通るという意味での正式な対称性は無い。さらに、定義域を制限しない限り最大値も無い。
Create a table such as Table 10.
表10のような表を作る。
| 0.785 | 1.57 | 3.14 | 4.71 | 5.50 | 6.28 |
Notice that the r-values are just the decimal form of the angle measured in radians. We can see them on a graph in Figure 19.
r の値が、ラジアンで測った角を小数で表しただけのものであることに注目しよう。図19のグラフで見てとれる。
![Graph of Archimedes' spiral r=theta over [0,2pi]. Starts at origin and spirals out in one loop counterclockwise. Points (pi/4, pi/4), (pi/2,pi/2), (pi,pi), (5pi/4, 5pi/4), (7pi/4, pi/4), and (2pi, 2pi) are marked.](img/9e9c23a8cddf5369389f19384e60008158dd8fbb.jpg)
Analysis 考察
The domain of this polar curve is In general, however, the domain of this function is Graphing the equation of the Archimedes’ spiral is rather simple, although the image makes it seem like it would be complex.
この極の曲線の定義域は である。だが一般には、この関数の定義域は である。アルキメデスの渦巻きの式のグラフを描くのは、図は込み入って見えるが、むしろ簡単である。
Try It #6やってみよう6
Sketch the graph of over the interval
区間 で のグラフの概形を描け。