第10章三角法のさらなる応用Further Applications of Trigonometry
10.4 Polar Coordinates: Graphs10.4 極座標: グラフ
Learning Objectives 学習目標
In this section you will:
この節を終えると、次のことができるようになる。
• Test polar equations for symmetry.• Graph polar equations by plotting points.
・極方程式の対称性を調べる。・点を打って極方程式のグラフを描く。
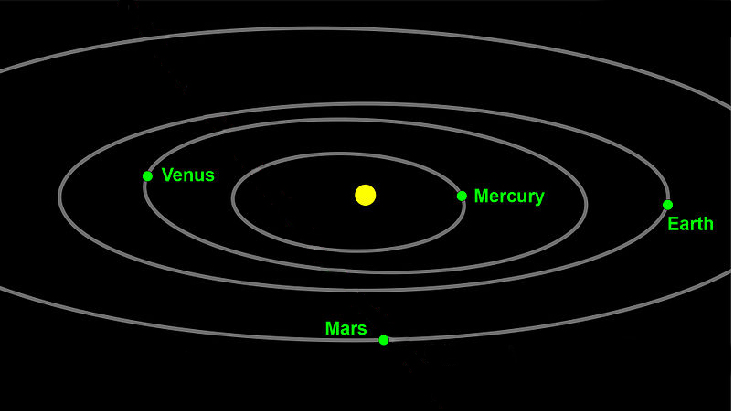
The planets move through space in elliptical, periodic orbits about the sun, as shown in Figure 1. They are in constant motion, so fixing an exact position of any planet is valid only for a moment. In other words, we can fix only a planet’s instantaneous position. This is one application of polar coordinates, represented as We interpret as the distance from the center of the sun and as the planet’s angular bearing, or its direction from the center of the sun. In this section, we will focus on the polar system and the graphs that are generated directly from polar coordinates.
図1に示すとおり、惑星は太陽のまわりを楕円の周期の軌道で空間を動く。つねに動いているので、どの惑星の正確な位置も、ある瞬間についてしか定まらない。言い換えれば、惑星の瞬間の位置しか定められない。これは と表される極座標の応用の一つである。 を太陽の中心からの距離、 を惑星の角の方位、すなわち太陽の中心から見た向きと読む。この節では、極の系と、極座標から直接生まれるグラフに絞る。