第3章生物心理学
Brain Imaging脳画像法
You have learned how brain injury can provide information about the functions of different parts of the brain. Increasingly, however, we are able to obtain that information using brain imaging techniques on individuals who have not suffered brain injury. In this section, we take a more in-depth look at some of the techniques that are available for imaging the brain, including techniques that rely on radiation, magnetic fields, or electrical activity within the brain.
英語のヒント
ここまで、脳の損傷が、脳のさまざまな部位の機能についての情報をどのように与えてくれるかを学んできた。しかし近年ますます、脳に損傷を負っていない人に脳画像法を用いることで、そうした情報を得られるようになってきている。この節では、脳を画像化するために利用できる手法のいくつかを、放射線、磁場、脳内の電気的活動を利用する手法も含めて、より詳しく見ていく。
Techniques Involving Radiation放射線を用いる手法
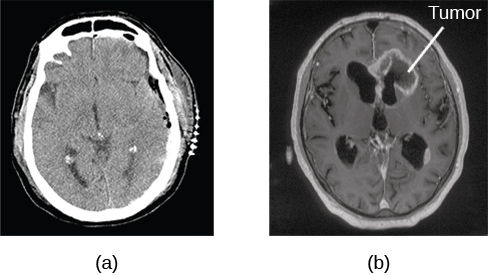
A computerized tomography (CT) scan involves taking a number of x-rays of a particular section of a person’s body or brain (Figure 3.26). The x-rays pass through tissues of different densities at different rates, allowing a computer to construct an overall image of the area of the body being scanned. A CT scan is often used to determine whether someone has a tumor or significant brain atrophy.
英語のヒント
コンピューター断層撮影(CT)では、人の体や脳の特定の断面について、X線写真を何枚も撮影する(図3.26)。X線は密度の異なる組織を異なる割合で通過するため、コンピューターはスキャンされている体の部位の全体像を組み立てられる。CTスキャンは、腫瘍や顕著な脳萎縮があるかどうかを判断するためによく用いられる。
OpenStax, Rice University; Psychology 2e. (credit a: modification of work by "Aceofhearts1968"/Wikimedia Commons; credit b: modification of work by Roland Schmitt et al) · CC BY 4.0 · Source出典
Figure 3.26図 3.26
A CT scan can be used to show brain tumors. (a) The image on the left shows a healthy brain, whereas (b) the image on the right indicates a brain tumor in the left frontal lobe. (credit a: modification of work by "Aceofhearts1968"/Wikimedia Commons; credit b: modification of work by Roland Schmitt et al)
CTスキャンは、脳腫瘍を示すのに使える。(a)左の画像は健康な脳を示し、一方(b)右の画像は左前頭葉にある脳腫瘍を示している。(出典a:"Aceofhearts1968"/Wikimedia Commonsの作品を改変、出典b:Roland Schmitt et alの作品を改変)
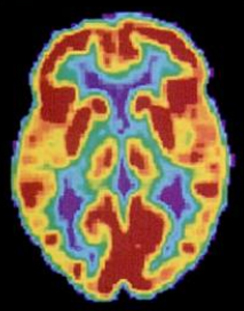
Positron emission tomography (PET) scans create pictures of the living, active brain (Figure 3.27). An individual receiving a PET scan drinks or is injected with a mildly radioactive substance, called a tracer. Once in the bloodstream, the amount of tracer in any given region of the brain can be monitored. As a brain area becomes more active, more blood flows to that area. A computer monitors the movement of the tracer and creates a rough map of active and inactive areas of the brain during a given behavior. PET scans show little detail, are unable to pinpoint events precisely in time, and require that the brain be exposed to radiation; therefore, this technique has been replaced by the fMRI as an alternative diagnostic tool. However, combined with CT, PET technology is still being used in certain contexts. For example, CT/PET scans allow better imaging of the activity of neurotransmitter receptors and open new avenues in schizophrenia research. In this hybrid CT/PET technology, CT contributes clear images of brain structures, while PET shows the brain’s activity.
英語のヒント
陽電子放出断層撮影(PET)は、生きて活動している脳の画像をつくる(図3.27)。PETスキャンを受ける人は、トレーサーと呼ばれる弱い放射性物質を飲むか、注射される。トレーサーがいったん血流に入ると、脳のどの領域についても、そこにあるトレーサーの量を観測できる。脳のある領域の活動が高まるにつれて、その領域へ流れる血液は多くなる。コンピューターがトレーサーの動きを観測し、ある行動をしている間の、脳の活動している領域と活動していない領域のおおまかな地図をつくる。PETスキャンは細部をほとんど示せず、出来事の時点を正確に特定できず、脳を放射線にさらす必要がある。そのため、この手法は、代わりとなる診断手段であるfMRIに取って代わられてきた。しかし、CTと組み合わせることで、PETの技術は今でも特定の場面で使われている。たとえばCT/PETスキャンは、神経伝達物質の受容体の活動をよりよく画像化でき、統合失調症の研究に新しい道を開いている。このCTとPETを組み合わせた技術では、CTが脳の構造の鮮明な画像を提供し、PETが脳の活動を示す。
OpenStax, Rice University; Psychology 2e. (credit: Health and Human Services Department, National Institutes of Health) · CC BY 4.0 · Source出典
Figure 3.27図 3.27
A PET scan is helpful for showing activity in different parts of the brain. (credit: Health and Human Services Department, National Institutes of Health)
PETスキャンは、脳のさまざまな部位の活動を示すのに役立つ。(出典:Health and Human Services Department, National Institutes of Health)
Techniques Involving Magnetic Fields磁場を用いる手法
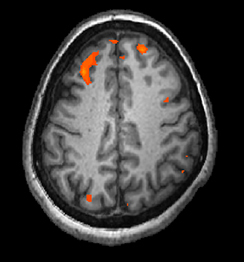
In magnetic resonance imaging (MRI), a person is placed inside a machine that generates a strong magnetic field. The magnetic field causes the hydrogen atoms in the body’s cells to move. When the magnetic field is turned off, the hydrogen atoms emit electromagnetic signals as they return to their original positions. Tissues of different densities give off different signals, which a computer interprets and displays on a monitor. Functional magnetic resonance imaging (fMRI) operates on the same principles, but it shows changes in brain activity over time by tracking blood flow and oxygen levels. The fMRI provides more detailed images of the brain’s structure, as well as better accuracy in time, than is possible in PET scans (Figure 3.28). With their high level of detail, MRI and fMRI are often used to compare the brains of healthy individuals to the brains of individuals diagnosed with psychological disorders. This comparison helps determine what structural and functional differences exist between these populations.
英語のヒント
磁気共鳴画像法(MRI)では、人は強い磁場を発生させる装置の中に入れられる。磁場によって、体の細胞の中の水素原子が動く。磁場を切ると、水素原子はもとの位置に戻る際に電磁信号を発する。密度の異なる組織は異なる信号を出し、コンピューターがそれを解釈してモニターに表示する。機能的磁気共鳴画像法(fMRI)も同じ原理で動くが、血流と酸素濃度を追跡することで、脳の活動の時間的な変化を示す。fMRIは、PETスキャンで得られるよりも詳細な脳の構造の画像を提供し、時間的な精度も高い(図3.28)。細部まで詳しくとらえられるため、MRIとfMRIは、健康な人の脳と、心理的障害と診断された人の脳を比べるのによく用いられる。この比較は、これらの集団の間にどのような構造的・機能的な違いがあるのかを明らかにするのに役立つ。
OpenStax, Rice University; Psychology 2e. (credit: modification of work by Kim J, Matthews NL, Park S.) · CC BY 4.0 · Source出典
Figure 3.28図 3.28
An fMRI shows activity in the brain over time. This image represents a single frame from an fMRI. (credit: modification of work by Kim J, Matthews NL, Park S.)
fMRIは、脳の活動の時間的な変化を示す。この画像は、fMRIの1コマを表している。(出典:Kim J, Matthews NL, Park S.の作品を改変)
Techniques Involving Electrical Activity電気的活動を用いる手法
In some situations, it is helpful to gain an understanding of the overall activity of a person’s brain, without needing information on the actual location of the activity. Electroencephalography (EEG) serves this purpose by providing a measure of a brain’s electrical activity. An array of electrodes is placed around a person’s head (Figure 3.29). The signals received by the electrodes result in a printout of the electrical activity of their brain, or brainwaves, showing both the frequency (number of waves per second) and amplitude (height) of the recorded brainwaves, with an accuracy within milliseconds. Such information is especially helpful to researchers studying sleep patterns among individuals with sleep disorders.
英語のヒント
場面によっては、活動が実際にどこで起きているかという情報は必要とせずに、人の脳の全体的な活動を把握することが役に立つ。脳波検査(EEG)は、脳の電気的活動の測定値を提供することで、この目的を果たす。人の頭の周りに一連の電極が配置される(図3.29)。電極が受け取った信号から、脳の電気的活動、すなわち脳波の記録が打ち出される。この記録は、記録された脳波の周波数(1秒あたりの波の数)と振幅(高さ)の両方を、ミリ秒単位の精度で示す。こうした情報は、睡眠障害のある人の睡眠パターンを研究する研究者にとって、とりわけ役に立つ。
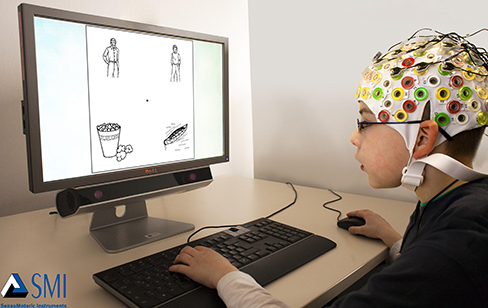


Figure 3.29図 3.29
Using caps with electrodes, modern EEG research can study the precise timing of overall brain activities. (credit: SMI Eye Tracking)
電極の付いた帽子を使うことで、現代のEEG研究は、脳全体の活動の正確なタイミングを調べることができる。(出典:SMI Eye Tracking)