第6章指数関数と対数関数Exponential and Logarithmic Functions
Practice Test実力テスト
2. Find an exponential equation that passes through the points and
2. 点 と を通る指数の式を求めよ。
4. An investment account was opened with an initial deposit of $9,600 and earns interest, compounded continuously. How much will the account be worth after years?
4. 初めに9,600ドルを預けて投資口座を開き、 の利子が連続複利でつく。 年後、この口座はいくらになるか。
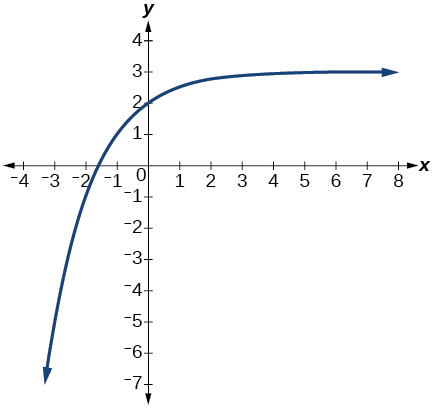
6. The graph shows transformations of the graph of What is the equation for the transformation?
6. このグラフは のグラフを変形したものを示している。この変形の式は何か。
8. Rewrite as an equivalent logarithmic equation.
8. を同値な対数の式に書き直せ。
10. Evaluate without using a calculator.
10. 電卓を使わずに の値を求めよ。
12. Graph the function
12. 関数 のグラフを描け。
14. Rewrite as a sum.
14. を和として書き直せ。
16. Rewrite as a product.
16. を積として書き直せ。
18. Condense the expression to a single logarithm.
18. 式 を一つの対数にまとめよ。
20. Solve by rewriting each side with a common base.
20. 両辺を共通の底に書き直して を解け。
22. Find the exact solution for If there is no solution, write no solution.
22. の厳密な解を求めよ。解が無ければ「解なし」と書け。
24. Find the exact solution for If there is no solution, write no solution.
24. の厳密な解を求めよ。解が無ければ「解なし」と書け。
26. Use the definition of a logarithm to find the exact solution for
26. 対数の定義を使って の厳密な解を求めよ。
28. The formula for measuring sound intensity in decibels is defined by the equation where is the intensity of the sound in watts per square meter and is the lowest level of sound that the average person can hear. How many decibels are emitted from a rock concert with a sound intensity of watts per square meter?
28. 音の強さをデシベル で測る公式は、式 で定められる。ここで は1平方メートルあたりのワットで表した音の強さ、 はふつうの人が聞きとれる最も低い音の水準である。音の強さが1平方メートルあたり ワットのロックの演奏会は、何デシベルを出しているか。
29. A radiation safety officer is working with grams of a radioactive substance. After days, the sample has decayed to grams. Rounding to five significant digits, write an exponential equation representing this situation. To the nearest day, what is the half-life of this substance?
29. ある放射線安全管理者が、放射性物質 グラムを扱っている。 日後、その試料は グラムに減っている。有効数字5桁に丸めて、この状況を表す指数の式を書け。この物質の半減期は、日単位でいくらか。
30. Write the formula found in the previous exercise as an equivalent equation with base Express the exponent to five significant digits.
30. 前問で求めた公式を、底 の同値な式として書け。指数は有効数字5桁で表せ。
31. A bottle of soda with a temperature of Fahrenheit was taken off a shelf and placed in a refrigerator with an internal temperature of After ten minutes, the internal temperature of the soda was Use Newton’s Law of Cooling to write a formula that models this situation. To the nearest degree, what will the temperature of the soda be after one hour?
31. 温度が華氏 度の炭酸飲料の瓶を棚から下ろし、庫内温度 の冷蔵庫に入れた。10分後、この飲料の中心温度は だった。ニュートンの冷却の法則を使って、この状況のモデルとなる式を書け。1時間後、この飲料の温度は度単位でいくらになるか。
32. The population of a wildlife habitat is modeled by the equation where is given in years. How many animals were originally transported to the habitat? How many years will it take before the habitat reaches half its capacity?
32. ある野生生物の生息地の個体数は、式 でモデル化される。ここで は年で与えられる。もともと何頭がこの生息地に移されたか。この生息地が収容力の半分に達するのに何年かかるか。
33. Enter the data from Table 1 into a graphing calculator and graph the resulting scatter plot. Determine whether the data from the table would likely represent a function that is linear, exponential, or logarithmic.
33. 表1の資料をグラフ電卓に入れ、できあがった散布図を描け。表の資料が一次・指数・対数のどの関数を表しそうかを判定せよ。
| x | f(x) |
| 1 | 3 |
| 2 | 8.55 |
| 3 | 11.79 |
| 4 | 14.09 |
| 5 | 15.88 |
| 6 | 17.33 |
| 7 | 18.57 |
| 8 | 19.64 |
| 9 | 20.58 |
| 10 | 21.42 |
34. The population of a lake of fish is modeled by the logistic equation where is time in years. To the nearest hundredth, how many years will it take the lake to reach of its carrying capacity?
34. ある湖の魚の個体数は、ロジスティックの式 でモデル化される。ここで は年単位の時間である。この湖が環境収容力の に達するのに何年かかるか。小数第二位まで求めよ。
For the following exercises, use a graphing utility to create a scatter diagram of the data given in the table. Observe the shape of the scatter diagram to determine whether the data is best described by an exponential, logarithmic, or logistic model. Then use the appropriate regression feature to find an equation that models the data. When necessary, round values to five decimal places.
次の各問について、グラフ作成ツールを使って、表に与えられた資料の散布図を作れ。散布図の形を見て、その資料が指数・対数・ロジスティックのどのモデルで最もよく述べられるかを決めよ。そしてふさわしい回帰の機能を使って、その資料のモデルとなる式を求めよ。必要なら、値を小数第五位まで丸めよ。
| x | f(x) |
| 1 | 20 |
| 2 | 21.6 |
| 3 | 29.2 |
| 4 | 36.4 |
| 5 | 46.6 |
| 6 | 55.7 |
| 7 | 72.6 |
| 8 | 87.1 |
| 9 | 107.2 |
| 10 | 138.1 |
| x | f(x) |
| 3 | 13.98 |
| 4 | 17.84 |
| 5 | 20.01 |
| 6 | 22.7 |
| 7 | 24.1 |
| 8 | 26.15 |
| 9 | 27.37 |
| 10 | 28.38 |
| 11 | 29.97 |
| 12 | 31.07 |
| 13 | 31.43 |
| x | f(x) |
| 0 | 2.2 |
| 0.5 | 2.9 |
| 1 | 3.9 |
| 1.5 | 4.8 |
| 2 | 6.4 |
| 3 | 9.3 |
| 4 | 12.3 |
| 5 | 15 |
| 6 | 16.2 |
| 7 | 17.3 |
| 8 | 17.9 |