第6章指数関数と対数関数Exponential and Logarithmic Functions
Review Exercises復習問題
Exponential Functions指数関数
2. The population of a herd of deer is represented by the function where is given in years. To the nearest whole number, what will the herd population be after years?
2. ある鹿の群れの個体数は関数 で表される。ここで は年で与えられる。 年後、この群れの個体数は整数でいくらになるか。
4. Determine whether Table 1 could represent a function that is linear, exponential, or neither. If it appears to be exponential, find a function that passes through the points.
4. 表1が一次関数を表しうるか、指数関数を表しうるか、どちらでもないかを判定せよ。指数関数に見えるなら、その点を通る関数を求めよ。
| x | 1 | 2 | 3 | 4 |
| f(x) | 3 | 0.9 | 0.27 | 0.081 |
6. Hsu-Mei wants to save $5,000 for a down payment on a car. To the nearest dollar, how much will she need to invest in an account now with APR, compounded daily, in order to reach her goal in years?
6. Hsu-Mei は車の頭金として5,000ドルを貯めたい。 年でこの目標に届くには、年利 、毎日複利の口座に今いくら投じる必要があるか。ドル単位で答えよ。
8. Suppose an investment account is opened with an initial deposit of earning interest, compounded continuously. How much will the account be worth after years?
8. 初めに を預けて投資口座を開き、 の利子が連続複利でつくとする。 年後、この口座はいくらになるか。
Graphs of Exponential Functions指数関数のグラフ
10. Graph the function and its reflection about the y-axis on the same axes, and give the y-intercept.
10. 関数 と、それを y軸に関して折り返したもののグラフを同じ座標軸に描き、y切片を示せ。
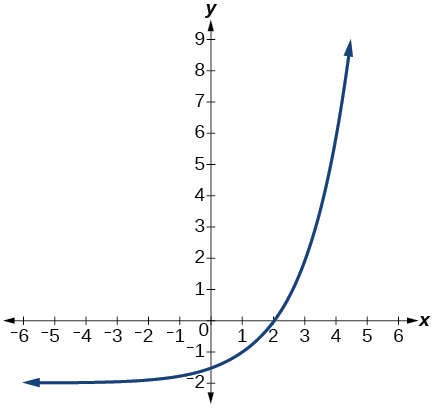
12. The graph below shows transformations of the graph of What is the equation for the transformation?
12. 下のグラフは のグラフを変形したものを示している。この変形の式は何か。
Logarithmic Functions対数関数
14. Rewrite as an equivalent exponential equation.
14. を同値な指数の式に書き直せ。
16. Rewrite as an equivalent logarithmic equation.
16. を同値な対数の式に書き直せ。
18. Evaluate without using a calculator.
18. 電卓を使わずに の値を求めよ。
20. Evaluate using a calculator. Round to the nearest thousandth.
20. 電卓を使って の値を求めよ。小数第三位まで丸めよ。
22. Evaluate using a calculator. Round to the nearest thousandth.
22. 電卓を使って の値を求めよ。小数第三位まで丸めよ。
Graphs of Logarithmic Functions対数関数のグラフ
24. Graph the function
24. 関数 のグラフを描け。
Logarithmic Properties対数の性質
26. Rewrite in expanded form.
26. を展開した形に書き直せ。
28. Rewrite in expanded form.
28. を展開した形に書き直せ。
30. Rewrite as a product.
30. を積として書き直せ。
32. Use properties of logarithms to expand
32. 対数の性質を使って を展開せよ。
34. Condense the expression to a single logarithm.
34. 式 を一つの対数にまとめよ。
36. Rewrite to base
36. を底 に書き直せ。
Exponential and Logarithmic Equations指数方程式と対数方程式
38. Solve by rewriting each side with a common base.
38. 両辺を共通の底に書き直して を解け。
40. Use logarithms to find the exact solution for If there is no solution, write no solution.
40. 対数を使って の厳密な解を求めよ。解が無ければ「解なし」と書け。
42. Find the exact solution for . If there is no solution, write no solution.
42. の厳密な解を求めよ。解が無ければ「解なし」と書け。
44. Find the exact solution for If there is no solution, write no solution.
44. の厳密な解を求めよ。解が無ければ「解なし」と書け。
46. Use the definition of a logarithm to solve.
46. 対数の定義を使って解け。
48. Use the one-to-one property of logarithms to find an exact solution for If there is no solution, write no solution.
48. 対数の一対一の性質を使って の厳密な解を求めよ。解が無ければ「解なし」と書け。
50. The formula for measuring sound intensity in decibels is defined by the equation where is the intensity of the sound in watts per square meter and is the lowest level of sound that the average person can hear. How many decibels are emitted from a large orchestra with a sound intensity of watts per square meter?
50. 音の強さをデシベル で測る公式は、式 で定められる。ここで は1平方メートルあたりのワットで表した音の強さ、 はふつうの人が聞きとれる最も低い音の水準である。音の強さが1平方メートルあたり ワットの大編成の管弦楽団は、何デシベルを出しているか。
52. Find the inverse function for the exponential function
52. 指数関数 の逆関数 を求めよ。
Exponential and Logarithmic Models指数・対数モデル
For the following exercises, use this scenario: A doctor prescribes milligrams of a therapeutic drug that decays by about each hour.
次の各問では、次の筋書きを使え。ある医師が、1時間ごとにおよそ ずつ減る治療薬を ミリグラム処方する。
54. To the nearest minute, what is the half-life of the drug?
54. この薬の半減期は、分単位でいくらか。
55. Write an exponential model representing the amount of the drug remaining in the patient’s system after hours. Then use the formula to find the amount of the drug that would remain in the patient’s system after hours. Round to the nearest hundredth of a gram.
55. 時間後に患者の体内に残る薬の量を表す指数のモデルを書け。そしてその式を使って、 時間後に患者の体内に残る薬の量を求めよ。グラムの小数第二位まで丸めよ。
For the following exercises, use this scenario: A soup with an internal temperature of Fahrenheit was taken off the stove to cool in a room. After fifteen minutes, the internal temperature of the soup was
次の各問では、次の筋書きを使え。中心温度が華氏 度のスープを、 度の部屋で冷ますためにこんろから下ろした。15分後、スープの中心温度は だった。
56. Use Newton’s Law of Cooling to write a formula that models this situation.
56. ニュートンの冷却の法則を使って、この状況のモデルとなる式を書け。
For the following exercises, use this scenario: The equation models the number of people in a school who have heard a rumor after days.
次の各問では、次の筋書きを使え。式 は、 日後に噂を聞いた学校の人数のモデルである。
58. How many people started the rumor?
58. 噂を始めたのは何人か。
60. What is the carrying capacity?
60. 環境収容力はいくらか。
For the following exercises, enter the data from each table into a graphing calculator and graph the resulting scatter plots. Determine whether the data from the table would likely represent a function that is linear, exponential, or logarithmic.
次の各問について、各表の資料をグラフ電卓に入れ、できあがった散布図を描け。表の資料が一次・指数・対数のどの関数を表しそうかを判定せよ。
| x | f(x) |
| 1 | 3.05 |
| 2 | 4.42 |
| 3 | 6.4 |
| 4 | 9.28 |
| 5 | 13.46 |
| 6 | 19.52 |
| 7 | 28.3 |
| 8 | 41.04 |
| 9 | 59.5 |
| 10 | 86.28 |
| x | f(x) |
| 0.5 | 18.05 |
| 1 | 17 |
| 3 | 15.33 |
| 5 | 14.55 |
| 7 | 14.04 |
| 10 | 13.5 |
| 12 | 13.22 |
| 13 | 13.1 |
| 15 | 12.88 |
| 17 | 12.69 |
| 20 | 12.45 |
Fitting Exponential Models to Dataデータへの指数モデルの当てはめ
64. What is the carrying capacity for a population modeled by the logistic equation What is the initial population for the model?
64. ロジスティックの式 でモデル化される個体数の環境収容力はいくらか。このモデルの初めの個体数はいくらか。
For the following exercises, use a graphing utility to create a scatter diagram of the data given in the table. Observe the shape of the scatter diagram to determine whether the data is best described by an exponential, logarithmic, or logistic model. Then use the appropriate regression feature to find an equation that models the data. When necessary, round values to five decimal places.
次の各問について、グラフ作成ツールを使って、表に与えられた資料の散布図を作れ。散布図の形を見て、その資料が指数・対数・ロジスティックのどのモデルで最もよく述べられるかを決めよ。そしてふさわしい回帰の機能を使って、その資料のモデルとなる式を求めよ。必要なら、値を小数第五位まで丸めよ。
| x | f(x) |
| 1 | 409.4 |
| 2 | 260.7 |
| 3 | 170.4 |
| 4 | 110.6 |
| 5 | 74 |
| 6 | 44.7 |
| 7 | 32.4 |
| 8 | 19.5 |
| 9 | 12.7 |
| 10 | 8.1 |
| x | f(x) |
| 0.15 | 36.21 |
| 0.25 | 28.88 |
| 0.5 | 24.39 |
| 0.75 | 18.28 |
| 1 | 16.5 |
| 1.5 | 12.99 |
| 2 | 9.91 |
| 2.25 | 8.57 |
| 2.75 | 7.23 |
| 3 | 5.99 |
| 3.5 | 4.81 |
| x | f(x) |
| 0 | 9 |
| 2 | 22.6 |
| 4 | 44.2 |
| 5 | 62.1 |
| 7 | 96.9 |
| 8 | 113.4 |
| 10 | 133.4 |
| 11 | 137.6 |
| 15 | 148.4 |
| 17 | 149.3 |