第6章指数関数と対数関数Exponential and Logarithmic Functions
6.4 Graphs of Logarithmic Functions6.4 対数関数のグラフ
Learning Objectives 学習目標
In this section, you will:
この節を終えると、次のことができるようになる。
• Identify the domain of a logarithmic function.• Graph logarithmic functions.
・対数関数の定義域を見分ける。・対数関数のグラフを描く。
In Graphs of Exponential Functions, we saw how creating a graphical representation of an exponential model gives us another layer of insight for predicting future events. How do logarithmic graphs give us insight into situations? Because every logarithmic function is the inverse function of an exponential function, we can think of every output on a logarithmic graph as the input for the corresponding inverse exponential equation. In other words, logarithms give the cause for an effect.
「指数関数のグラフ」で、指数のモデルをグラフに表すと、これから起こることを予測するもう一つの手がかりが得られるのを見た。対数のグラフは、どんな手がかりを与えてくれるのか。どの対数関数も指数関数の逆関数なので、対数のグラフのどの出力も、対応する逆の指数の式への入力と見なせる。言い換えれば、対数は結果に対する原因を与える。
To illustrate, suppose we invest in an account that offers an annual interest rate of compounded continuously. We already know that the balance in our account for any year can be found with the equation
例として、年の利率 が連続複利でつく口座に を投じるとしよう。任意の年 の口座の残高が、式 で求まることはすでに知っている。
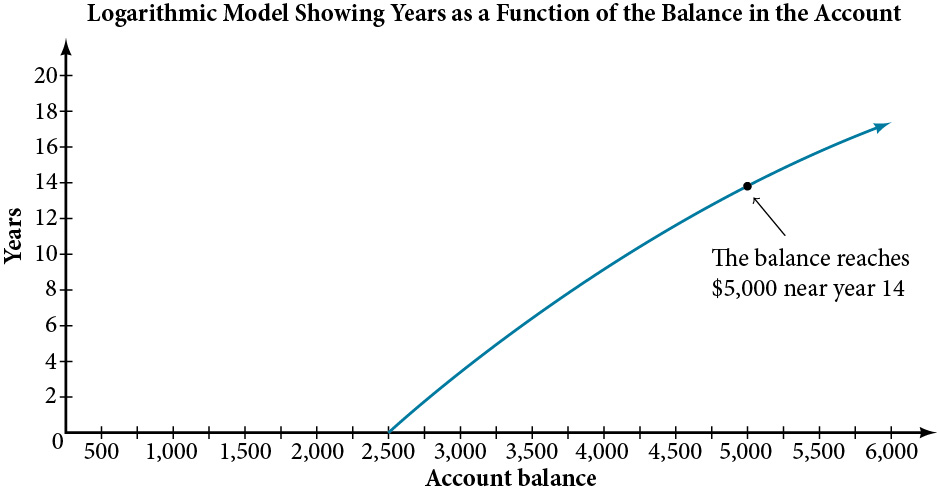
But what if we wanted to know the year for any balance? We would need to create a corresponding new function by interchanging the input and the output; thus we would need to create a logarithmic model for this situation. By graphing the model, we can see the output (year) for any input (account balance). For instance, what if we wanted to know how many years it would take for our initial investment to double? Figure 1 shows this point on the logarithmic graph.
だが、任意の残高になる年を知りたいならどうするか。入力と出力を入れ替えて、対応する新しい関数を作る必要がある。つまり、この状況の対数のモデルを作る必要がある。そのモデルのグラフを描けば、任意の入力(口座の残高)に対する出力(年)が見てとれる。たとえば、初めの投資が2倍になるのに何年かかるかを知りたいとしよう。図1は対数のグラフ上のこの点を示している。
In this section we will discuss the values for which a logarithmic function is defined, and then turn our attention to graphing the family of logarithmic functions.
この節では、対数関数が定義される値を論じ、それから対数関数の族のグラフを描くことに目を向ける。