第6章指数関数と対数関数Exponential and Logarithmic Functions
Graphing Logarithmic Functions対数関数のグラフを描く
Now that we have a feel for the set of values for which a logarithmic function is defined, we move on to graphing logarithmic functions. The family of logarithmic functions includes the parent function along with all its transformations: shifts, stretches, compressions, and reflections.
対数関数が定義される値の集合をつかんだので、対数関数のグラフを描くことに移る。対数関数の族には、親関数 と、それを移動・伸長・圧縮・折り返しで変形したものすべてが含まれる。
We begin with the parent function Because every logarithmic function of this form is the inverse of an exponential function with the form their graphs will be reflections of each other across the line To illustrate this, we can observe the relationship between the input and output values of and its equivalent in Table 1.
まず親関数 から始める。この形の対数関数はどれも の形の指数関数の逆なので、そのグラフは直線 に関して互いに折り返したものになる。これを示すために、表1で と、それと同値な の入力値と出力値の関係を見よう。
Using the inputs and outputs from Table 1, we can build another table to observe the relationship between points on the graphs of the inverse functions and See Table 2.
表1の入力と出力を使えば、互いに逆関数である と のグラフ上の点の関係を見るための別の表が作れる。表2を見よ。
As we’d expect, the x- and y-coordinates are reversed for the inverse functions. Figure 2 shows the graph of and
見込みどおり、逆関数では x座標と y座標が入れ替わっている。図2は と のグラフを示している。
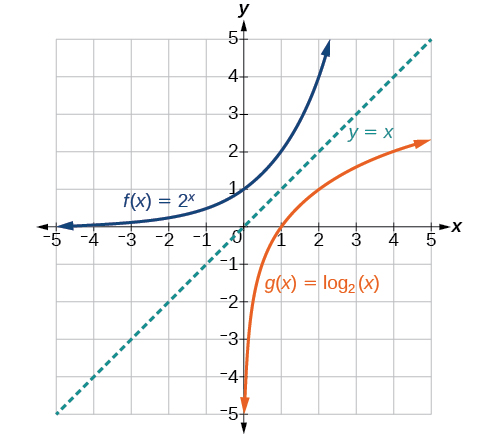
Observe the following from the graph:
このグラフから次のことを見よう。
• has a y-intercept at and has an x- intercept at • The domain of is the same as the range of • The range of is the same as the domain of
・ は に y切片を持ち、 は に x切片を持つ。・、 の定義域は、 の値域と同じである。・、 の値域は、 の定義域と同じである。
Characteristics of the Graph of the Parent Function, 基本となる関数のグラフの特徴
Characteristics of the Graph of the Parent Function, 親関数 のグラフの特徴
For any real number and constant we can see the following characteristics in the graph of
任意の実数 と定数 、 について、 のグラフに次の特徴が見てとれる。
• one-to-one function• vertical asymptote: • domain: • range: • x-intercept: and key point • y-intercept: none• increasing if • decreasing if
・一対一の関数・垂直漸近線: ・定義域: ・値域: ・x切片: 、そして要点 ・y切片: 無し・ なら増加する・ なら減少する
See Figure 3.
図3を見よ。
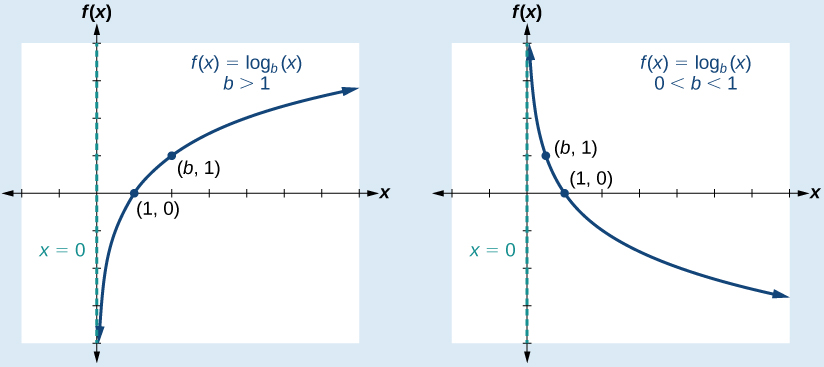
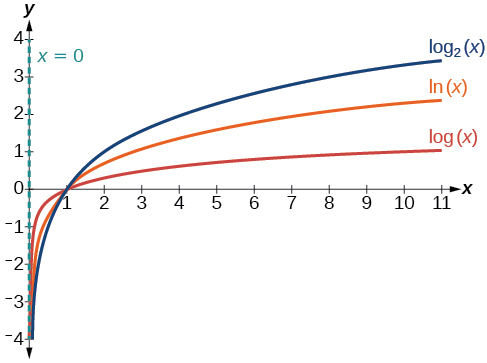
Figure 4 shows how changing the base in can affect the graphs. Observe that the graphs compress vertically as the value of the base increases. (Note: recall that the function has base
図4は、 の底 を変えるとグラフがどう変わるかを示している。底の値が大きくなるほどグラフが縦に縮むのを見よう。(注意: 関数 の底は であることを思い出そう。)
How To 手順
Given a logarithmic function with the form graph the function.
の形の対数関数が与えられたとき、その関数のグラフを描く。
1. Draw and label the vertical asymptote, 2. Plot the x-intercept, 3. Plot the key point 4. Draw a smooth curve through the points.5. State the domain, the range, and the vertical asymptote,
1. 垂直漸近線 を描いて名前を付ける。2. x切片 を打つ。3. 要点 を打つ。4. その点を通る滑らかな曲線を描く。5. 定義域 、値域 、垂直漸近線 を答える。
Example 3例3
Graphing a Logarithmic Function with the Form f(x) = logb(x).f(x) = logb(x) の形の対数関数のグラフを描く
Graph State the domain, range, and asymptote.
のグラフを描け。定義域、値域、漸近線を答えよ。
Solution 解答
Before graphing, identify the behavior and key points for the graph.
グラフを描く前に、ふるまいとグラフの要点を見分ける。
• Since is greater than one, we know the function is increasing. The left tail of the graph will approach the vertical asymptote and the right tail will increase slowly without bound.• The x-intercept is • The key point is on the graph.• We draw and label the asymptote, plot and label the points, and draw a smooth curve through the points (see Figure 5).
・ は1より大きいので、この関数は増加すると分かる。グラフの左の裾は垂直漸近線 に近づき、右の裾はゆっくりと限りなく増える。・x切片は である。・要点 がグラフ上にある。・漸近線を描いて名前を付け、点を打って名前を付け、その点を通る滑らかな曲線を描く(図5を見よ)。
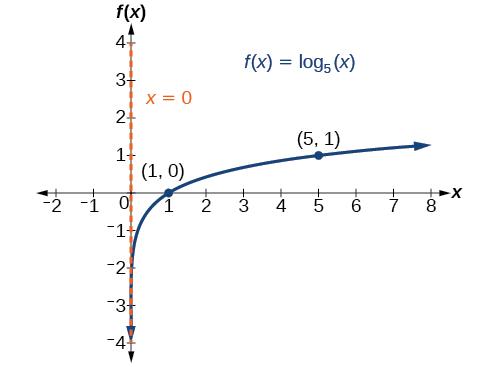
The domain is the range is and the vertical asymptote is
定義域は 、値域は 、垂直漸近線は である。
Try It #3やってみよう3
Graph State the domain, range, and asymptote.
のグラフを描け。定義域、値域、漸近線を答えよ。