第6章指数関数と対数関数Exponential and Logarithmic Functions
Answer Key解答
About billion people; by the year 2031, India’s population will exceed China’s by about 0.001 billion, or 1 million people.
およそ 十億人。2031年までに、インドの人口は中国をおよそ0.001十億人、すなわち100万人上回る。
Answers may vary due to round-off error. The answer should be very close to
。丸めの誤差で答えが違うことがある。答えは にきわめて近くなるはずである。
3.77E-26 (This is calculator notation for the number written as in scientific notation. While the output of an exponential function is never zero, this number is so close to zero that for all practical purposes we can accept zero as the answer.)
3.77E-26(これは、科学的記数法で と書かれる数の電卓での表記である。指数関数の出力が0になることは決して無いが、この数は0にきわめて近いので、実用上は0を答えとしてよい。)
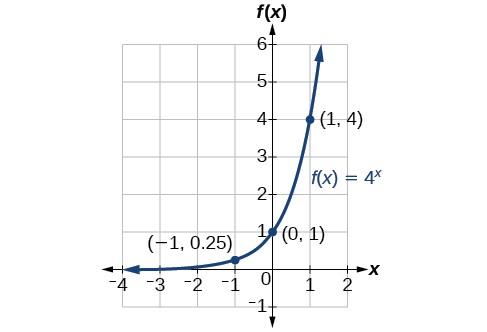
ⓐ is equivalent to ⓑ is equivalent to ⓒ is equivalent to
ⓐ は と同値である。ⓑ は と同値である。ⓒ は と同値である。
It is not possible to take the logarithm of a negative number in the set of real numbers.
実数の範囲で負の数の対数をとることはできない。
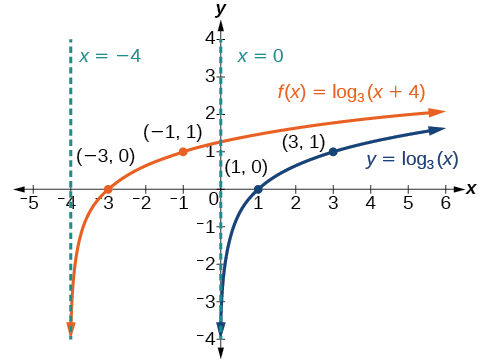
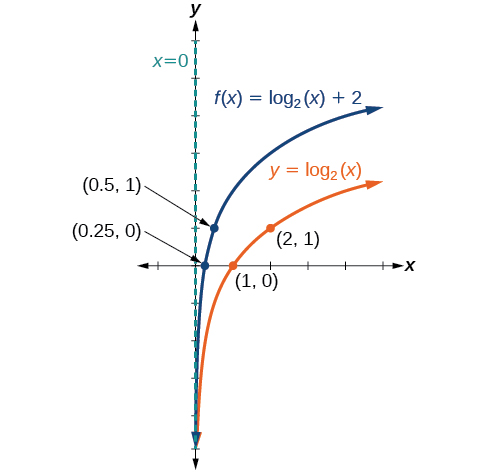
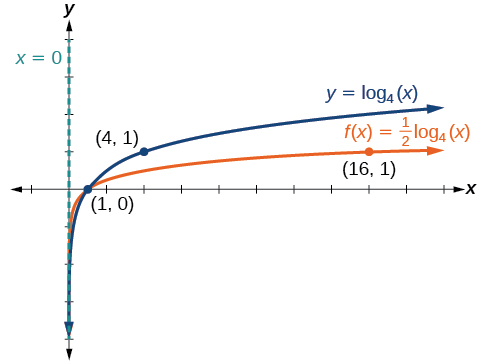
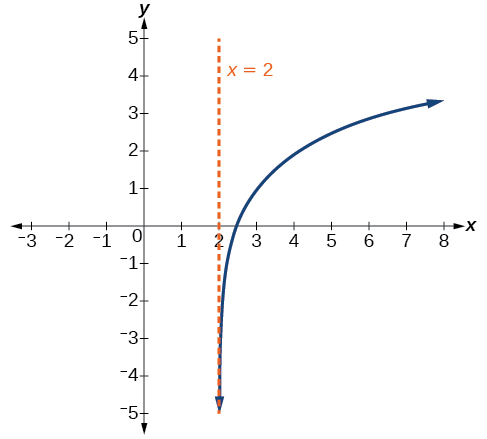
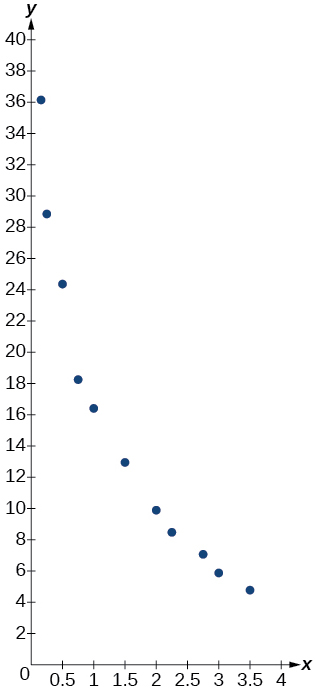
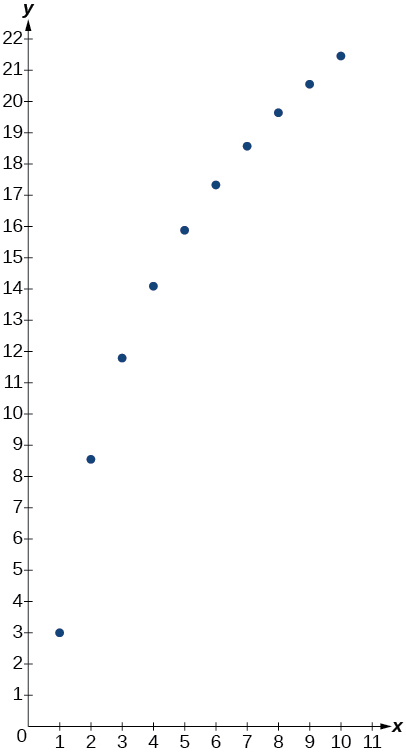
ⓐThe exponential regression model that fits these data is ⓑIf spending continues at this rate, the graduate’s credit card debt will be $4,499.38 after one year.
ⓐこの資料に当てはまる指数回帰のモデルは である。ⓑこの調子で使い続けると、卒業した人のクレジットカードの負債は1年後に4,499.38ドルになる。
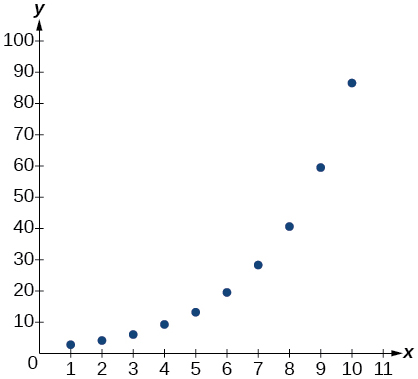
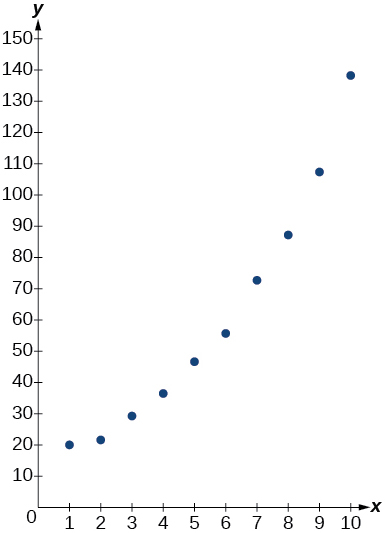
ⓐThe logarithmic regression model that fits these data is ⓑIf sales continue at this rate, about 171,000 games will be sold in the year 2015.
ⓐこの資料に当てはまる対数回帰のモデルは である。ⓑこの調子で売れ続けるなら、2015年にはおよそ171,000本売れる。
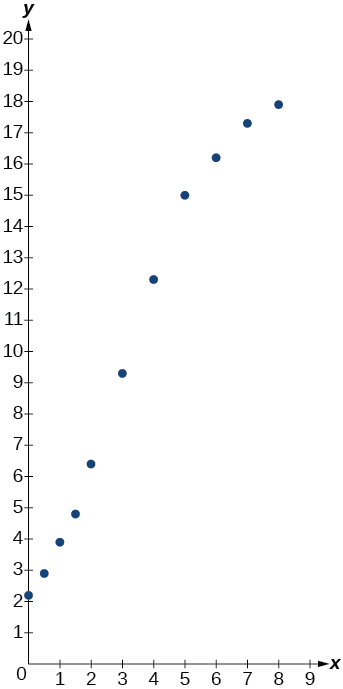
ⓐThe logistic regression model that fits these data is ⓑIf the population continues to grow at this rate, there will be about seals in 2020.ⓒTo the nearest whole number, the carrying capacity is 25,657.
ⓐこの資料に当てはまるロジスティック回帰のモデルは である。ⓑこの調子で個体数が増え続けるなら、2020年にはアザラシがおよそ 頭になる。ⓒ環境収容力は、整数で25,657である。
6.1 Section Exercises6.1 節末問題
Linear functions have a constant rate of change. Exponential functions increase based on a percent of the original.
一次関数は変化の割合が一定である。指数関数は元の量の百分率にもとづいて増える。
When interest is compounded, the percentage of interest earned to principal ends up being greater than the annual percentage rate for the investment account. Thus, the annual percentage rate does not necessarily correspond to the real interest earned, which is the very definition of nominal.
利子が複利でつくと、元金に対する利子の割合は、その投資口座の年利より大きくなる。よって年利は、実際に得られる利子と必ずしも一致しない。これがまさに名目という語の意味である。
not exponential; the charge decreases by a constant amount each visit, so the statement represents a linear function. .
指数でない。1回ごとに料金が一定の額だけ減るので、この記述は一次関数を表す。
Answers will vary. Sample response: For a number of years, the population of forest A will increasingly exceed forest B, but because forest B actually grows at a faster rate, the population will eventually become larger than forest A and will remain that way as long as the population growth models hold. Some factors that might influence the long-term validity of the exponential growth model are drought, an epidemic that culls the population, and other environmental and biological factors.
答えはさまざまでよい。答えの例: 何年かのあいだ、森Aの本数は森Bをますます上回る。だが森Bのほうが実際には速く育つので、いずれ本数は森Aより多くなり、この個体数の増加のモデルが成り立つかぎりそのままである。指数的な増加のモデルが長い目で見て通用するかどうかに関わる要因には、干ばつ、個体数を減らす流行病、そのほかの環境と生物の要因などがある。
Let be the exponential decay function such that Then for some number
を を満たす指数的な減少の関数 とする。すると、ある数 について となる。
6.2 Section Exercises6.2 節末問題
An asymptote is a line that the graph of a function approaches, as either increases or decreases without bound. The horizontal asymptote of an exponential function tells us the limit of the function’s values as the independent variable gets either extremely large or extremely small.
漸近線とは、 が限りなく増えるか減るかするときに、関数のグラフが近づく直線である。指数関数の水平漸近線は、独立変数がきわめて大きくなるか、きわめて小さくなるときの、その関数の値の限りを教えてくれる。
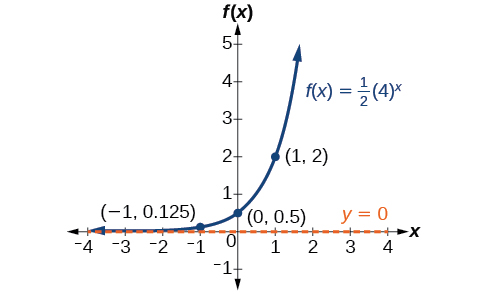
y-intercept: Domain: all real numbers; Range: all real numbers greater than
。y切片: 。定義域: 実数全体。値域: より大きい実数全体。
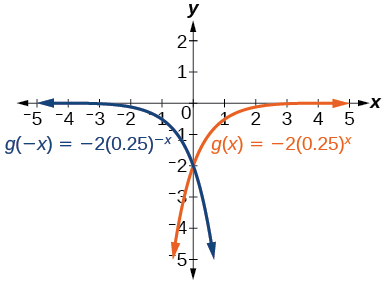
y-intercept: Domain: all real numbers; Range: all real numbers less than
。y切片: 。定義域: 実数全体。値域: より小さい実数全体。
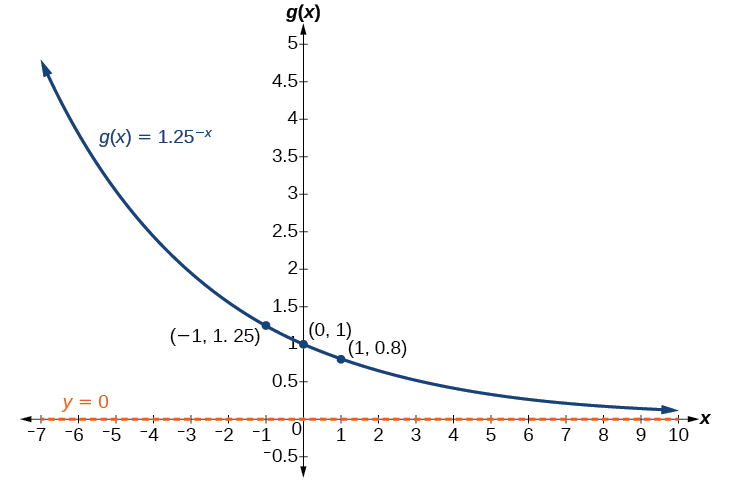
y-intercept: Domain: all real numbers; Range: all real numbers greater than
。y切片: 。定義域: 実数全体。値域: より大きい実数全体。
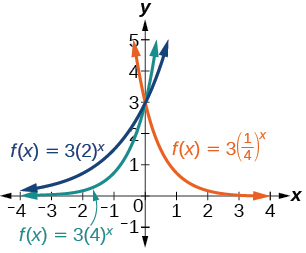
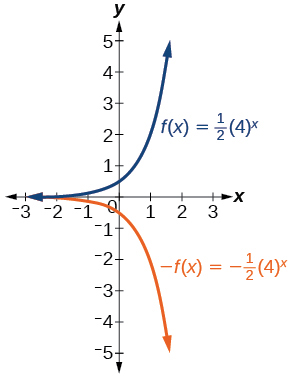
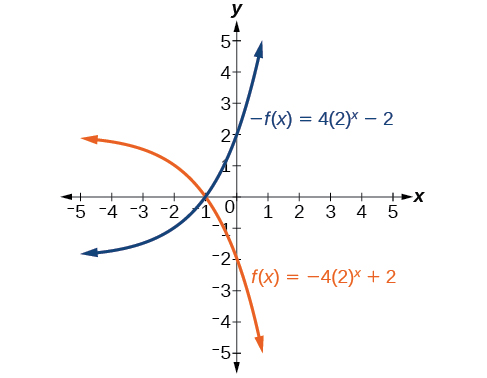
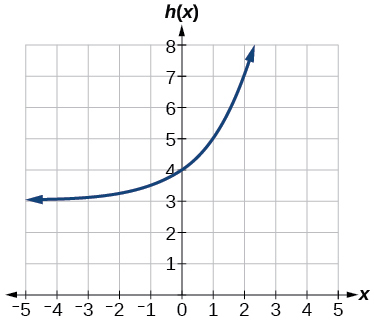
Horizontal asymptote: Domain: all real numbers; Range: all real numbers strictly greater than
水平漸近線: 。定義域: 実数全体。値域: より真に大きい実数全体。
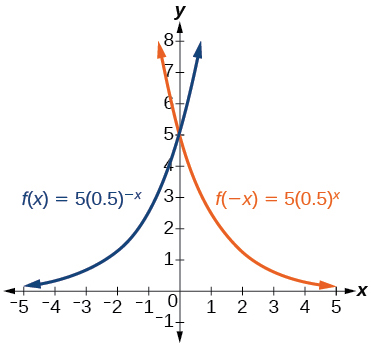
The graph of is the refelction about the y-axis of the graph of For any real number and function the graph of is the the reflection about the y-axis,
のグラフは、 のグラフを y軸に関して折り返したものである。任意の実数 と関数 について、 のグラフは y軸に関する折り返し である。
The graphs of and are the same and are a horizontal shift to the right of the graph of For any real number n, real number and function the graph of is the horizontal shift
と のグラフは同じで、 のグラフを右に横に移したものである。任意の実数 n、実数 、関数 について、 のグラフは横の移動 である。
6.3 Section Exercises6.3 節末問題
A logarithm is an exponent. Specifically, it is the exponent to which a base is raised to produce a given value. In the expressions given, the base has the same value. The exponent, in the expression can also be written as the logarithm, and the value of is the result of raising to the power of
対数は指数である。具体的には、与えられた値を生むために底 を累乗する指数である。与えられた式では、底 が同じ値である。式 の指数 は対数 とも書け、 の値は を 乗した結果である。
Since the equation of a logarithm is equivalent to an exponential equation, the logarithm can be converted to the exponential equation and then properties of exponents can be applied to solve for
対数の式は指数の方程式と同値なので、この対数を指数の方程式 に直せば、指数の性質を当てはめて について解ける。
The natural logarithm is a special case of the logarithm with base in that the natural log always has base Rather than notating the natural logarithm as the notation used is
自然対数は底 の対数の特別な場合で、自然対数の底はつねに である。自然対数を と書く代わりに、 という記法を使う。
No, the function has no defined value for To verify, suppose is in the domain of the function Then there is some number such that Rewriting as an exponential equation gives: which is impossible since no such real number exists. Therefore, is not the domain of the function
いいえ。この関数は で値が定まらない。確かめるために、 が関数 の定義域に入るとしよう。すると となる数 がある。これを指数の方程式に書き直すと となるが、そんな実数 は存在しないのでありえない。したがって は関数 の定義域に入らない。
Yes. Suppose there exists a real number such that Rewriting as an exponential equation gives which is a real number. To verify, let Then, by definition,
はい。 となる実数 が存在するとしよう。これを指数の方程式に書き直すと となり、これは実数である。確かめるために とする。すると定義により となる。
6.4 Section Exercises6.4 節末問題
Since the functions are inverses, their graphs are mirror images about the line So for every point on the graph of a logarithmic function, there is a corresponding point on the graph of its inverse exponential function.
この二つの関数は互いに逆関数なので、そのグラフは直線 に関する鏡像である。よって、対数関数のグラフ上のどの点 に対しても、その逆の指数関数のグラフ上に対応する点 がある。
Shifting the function right or left and reflecting the function about the y-axis will affect its domain.
関数を右や左に移すこと、y軸に関して折り返すことが、その定義域に影響する。
No. A horizontal asymptote would suggest a limit on the range, and the range of any logarithmic function in general form is all real numbers.
いいえ。水平漸近線があれば値域に限りがあることになるが、一般形のどの対数関数の値域も実数全体である。
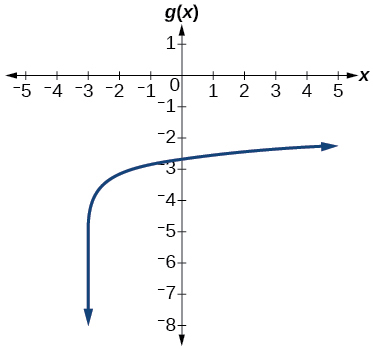
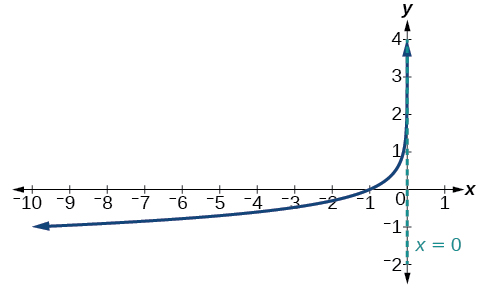
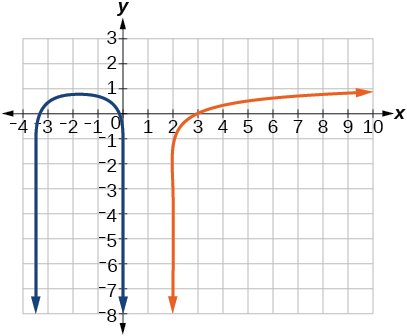
Domain: ;
Vertical asymptote: ; End behavior: as and as
定義域: 。垂直漸近線: 。端のふるまい: となり、 となる。
Domain: ; Vertical asymptote: ;
End behavior: as , and as ,
定義域: 。垂直漸近線: 。端のふるまい: のとき 、 のとき 。
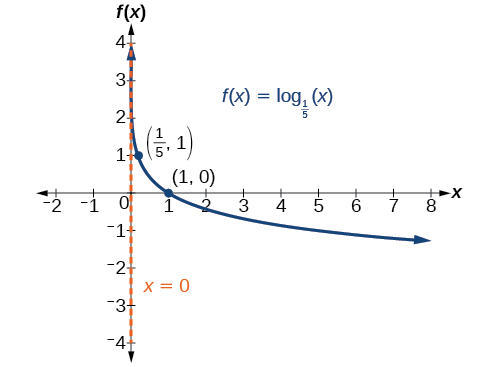
Domain: Range: Vertical asymptote: x-intercept: y-intercept: DNE
定義域: 。値域: 。垂直漸近線: 。x切片: 。y切片: DNE。
Domain: Range: Vertical asymptote: x-intercept: y-intercept: DNE
定義域: 。値域: 。垂直漸近線: 。x切片: 。y切片: DNE。
Domain: Range: Vertical asymptote: x-intercept: y-intercept: DNE
定義域: 。値域: 。垂直漸近線: 。x切片: 。y切片: DNE。
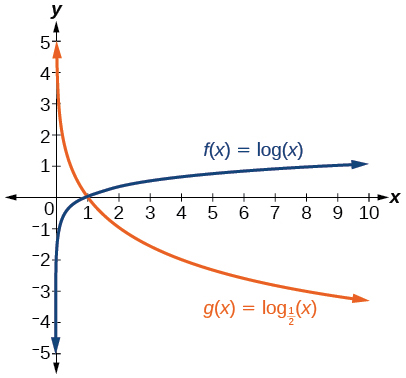
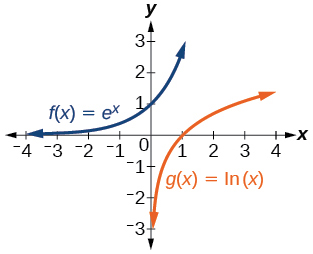
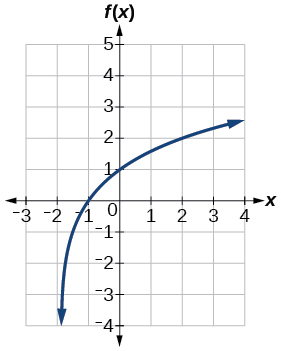
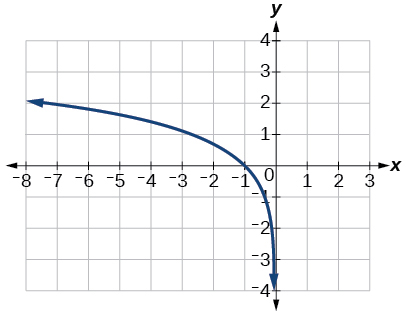
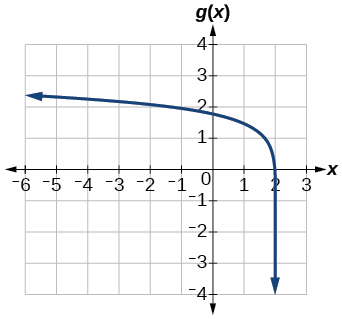
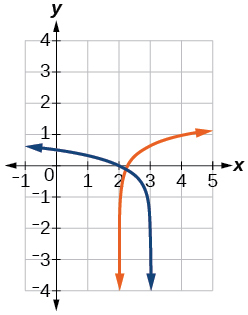
The graphs of and appear to be the same; Conjecture: for any positive base
と のグラフは同じに見える。予想: 任意の正の底 について 。
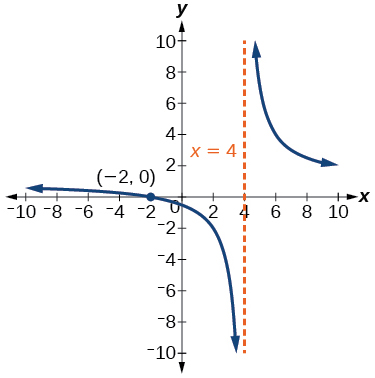
Recall that the argument of a logarithmic function must be positive, so we determine where . From the graph of the function note that the graph lies above the x-axis on the interval and again to the right of the vertical asymptote, that is Therefore, the domain is
対数関数の真数は正でなければならないことを思い出し、 となるところを決める。関数 のグラフから、グラフが x軸より上にあるのは区間 と、垂直漸近線の右すなわち だと分かる。したがって定義域は である。
6.5 Section Exercises6.5 節末問題
Any root expression can be rewritten as an expression with a rational exponent so that the power rule can be applied, making the logarithm easier to calculate. Thus,
どんな根の式も有理数の指数を持つ式に書き直せるので、累乗の法則を当てはめられ、対数の計算が楽になる。したがって である。
By the quotient rule:
。商の法則により 。
Rewriting as an exponential equation and solving for
指数の方程式に書き直して について解く。
Checking, we find that is defined, so
確かめると は定義されるので、 である。
Let and be positive integers greater than Then, by the change-of-base formula,
と を より大きい正の整数とする。すると底の変換公式により となる。
6.6 Section Exercises6.6 節末問題
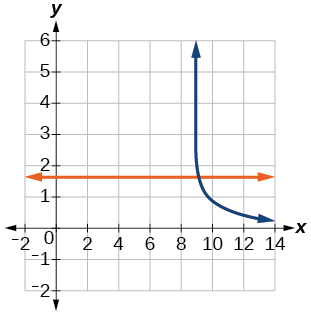
Determine first if the equation can be rewritten so that each side uses the same base. If so, the exponents can be set equal to each other. If the equation cannot be rewritten so that each side uses the same base, then apply the logarithm to each side and use properties of logarithms to solve.
まず、両辺が同じ底を使うように方程式を書き直せるかどうかを決める。書き直せるなら、指数どうしを等しいとおける。両辺が同じ底を使うように書き直せないなら、両辺に対数を当てはめ、対数の性質を使って解く。
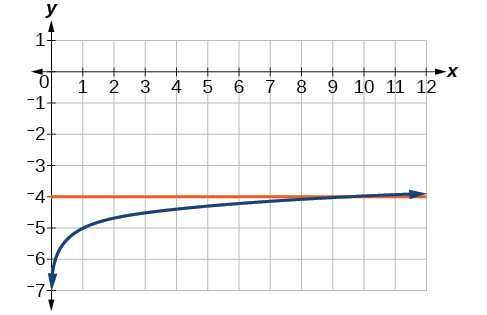
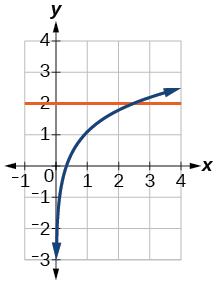
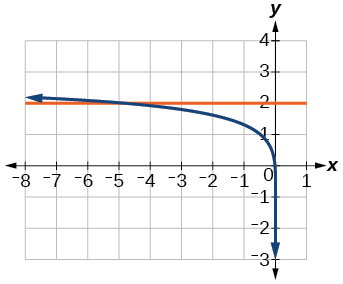
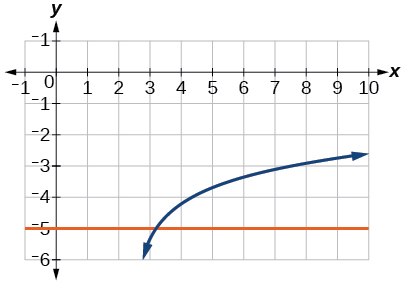
The one-to-one property can be used if both sides of the equation can be rewritten as a single logarithm with the same base. If so, the arguments can be set equal to each other, and the resulting equation can be solved algebraically. The one-to-one property cannot be used when each side of the equation cannot be rewritten as a single logarithm with the same base.
一対一の性質は、方程式の両辺を同じ底の一つの対数に書き直せる場合に使える。書き直せるなら、真数どうしを等しいとおき、できあがった方程式を代数的に解ける。方程式の両辺を同じ底の一つの対数に書き直せないときは、一対一の性質は使えない。
6.7 Section Exercises6.7 節末問題
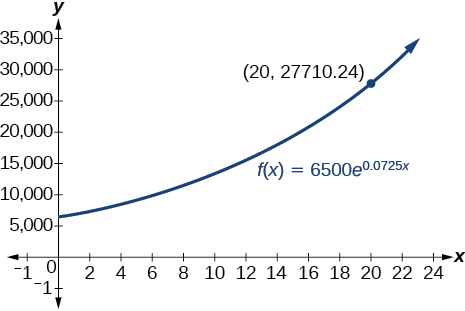
Half-life is a measure of decay and is thus associated with exponential decay models. The half-life of a substance or quantity is the amount of time it takes for half of the initial amount of that substance or quantity to decay.
半減期は減少を測るものであり、したがって指数的な減少のモデルに結びつく。物質や量の半減期とは、その物質や量の初めの量の半分が減るのにかかる時間である。
Doubling time is a measure of growth and is thus associated with exponential growth models. The doubling time of a substance or quantity is the amount of time it takes for the initial amount of that substance or quantity to double in size.
倍加時間は増加を測るものであり、したがって指数的な増加のモデルに結びつく。物質や量の倍加時間とは、その物質や量の初めの量が2倍になるのにかかる時間である。
An order of magnitude is the nearest power of ten by which a quantity exponentially grows. It is also an approximate position on a logarithmic scale; Sample response: Orders of magnitude are useful when making comparisons between numbers that differ by a great amount. For example, the mass of Saturn is 95 times greater than the mass of Earth. This is the same as saying that the mass of Saturn is about times, or 2 orders of magnitude greater, than the mass of Earth.
桁とは、ある量が指数的に増えるときの、最も近い10の累乗である。対数の尺度上のおおよその位置でもある。答えの例: 桁は、大きく違う数どうしを比べるときに役立つ。たとえば土星の質量は地球の質量の95倍である。これは、土星の質量が地球の質量のおよそ 倍、すなわち2桁大きいと言うのと同じである。
6.8 Section Exercises6.8 節末問題
Logistic models are best used for situations that have limited values. For example, populations cannot grow indefinitely since resources such as food, water, and space are limited, so a logistic model best describes populations.
ロジスティックのモデルは、値に限りのある状況に最も向いている。たとえば、食料・水・場所といった資源には限りがあるので個体数は無限には増えられない。よってロジスティックのモデルが個体数を最もよく述べる。
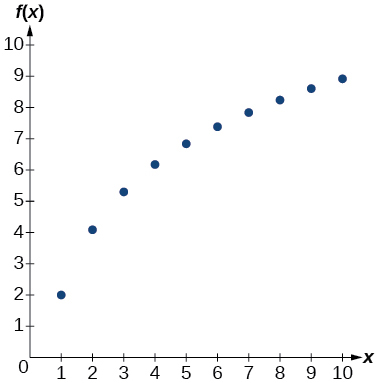
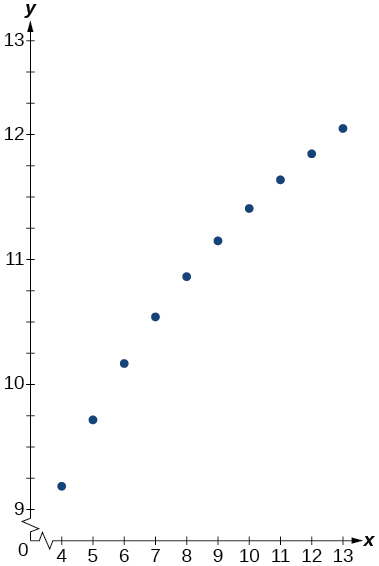
Regression analysis is the process of finding an equation that best fits a given set of data points. To perform a regression analysis on a graphing utility, first list the given points using the STAT then EDIT menu. Next graph the scatter plot using the STAT PLOT feature. The shape of the data points on the scatter graph can help determine which regression feature to use. Once this is determined, select the appropriate regression analysis command from the STAT then CALC menu.
回帰分析とは、与えられた資料の点の組に最もよく当てはまる式を求める作業である。グラフ作成ツールで回帰分析を行うには、まず STAT から EDIT のメニューで与えられた点を並べる。次に STAT PLOT の機能を使って散布図を描く。散布図の点の形が、どの回帰の機能を使うかを決めるのに役立つ。それが決まったら、STAT から CALC のメニューでふさわしい回帰分析の命令を選ぶ。
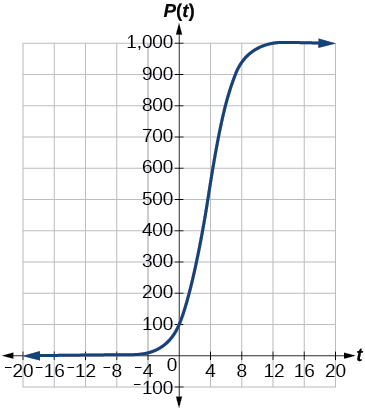
The y-intercept on the graph of a logistic equation corresponds to the initial population for the population model.
ロジスティックの式のグラフの y切片は、その個体数のモデルの初めの個体数に当たる。
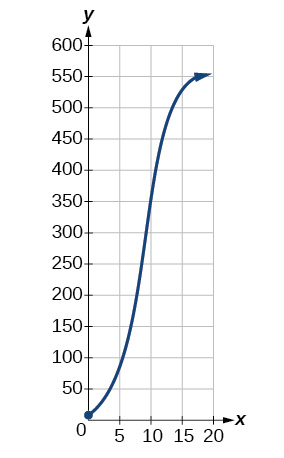
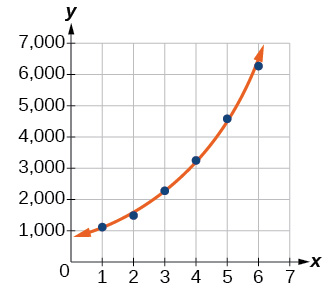
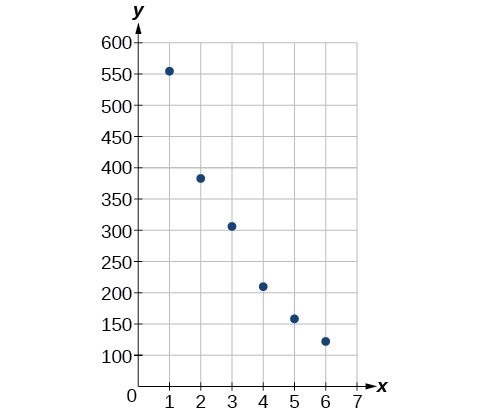
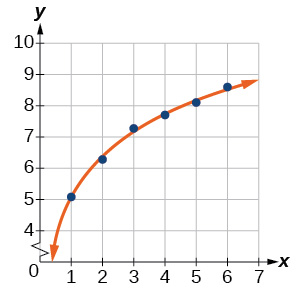
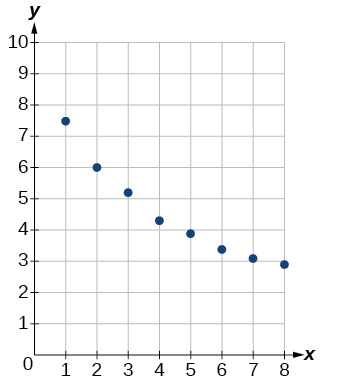
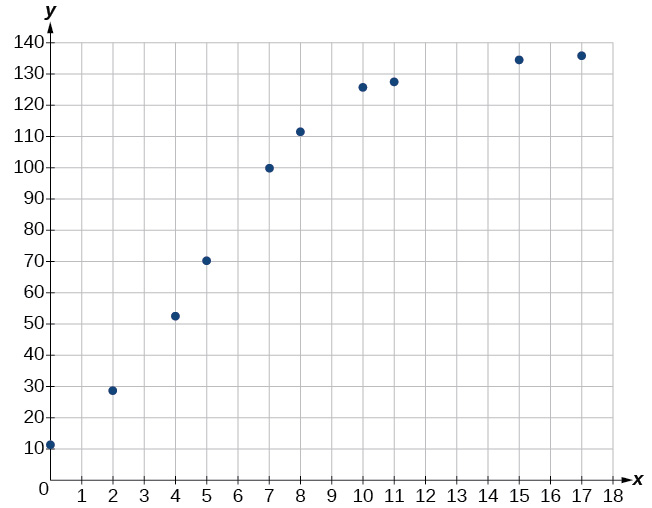
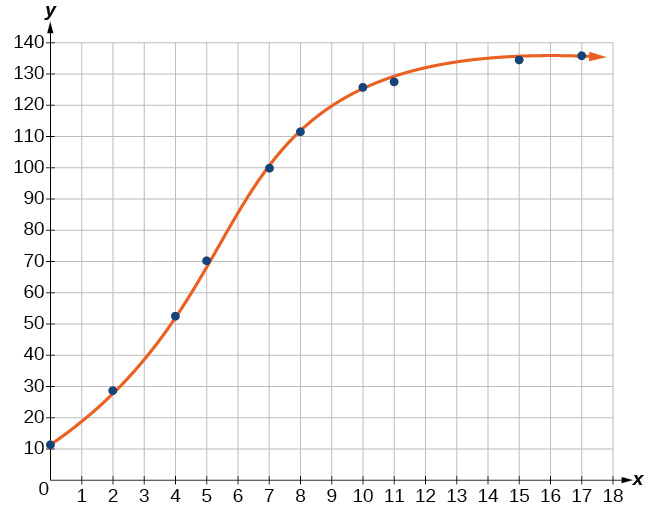
; ; the regression curves are symmetrical about , so it appears that they are inverse functions.
。。この回帰の曲線は に関して対称なので、互いに逆関数だと見られる。
Review Exercises復習問題
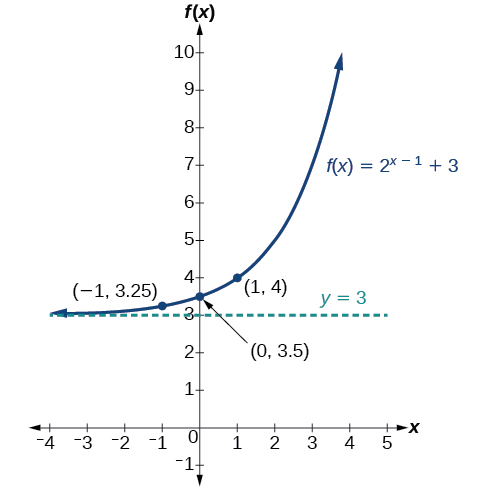
domain: all real numbers; range: all real numbers strictly greater than zero; y-intercept: (0, 3.5);
定義域: 実数全体。値域: 0より真に大きい実数全体。y切片: (0, 3.5)。
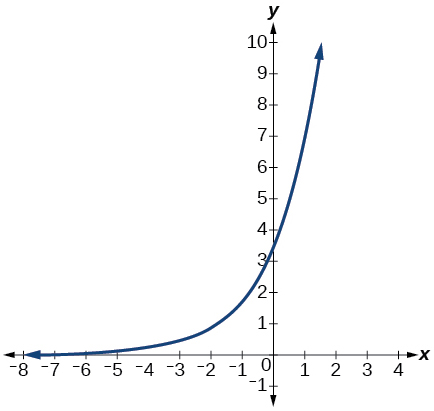
y-intercept: Domain: all real numbers; Range: all real numbers greater than
。y切片: 。定義域: 実数全体。値域: より大きい実数全体。