第6章指数関数と対数関数Exponential and Logarithmic Functions
6.7 Exponential and Logarithmic Models6.7 指数・対数モデル
Learning Objectives 学習目標
In this section, you will:
この節を終えると、次のことができるようになる。
• Model exponential growth and decay.• Use Newton’s Law of Cooling.• Use logistic-growth models.• Choose an appropriate model for data.• Express an exponential model in base .
・指数的な増加と減少のモデルを作る。・ニュートンの冷却の法則を使う。・ロジスティック増加のモデルを使う。・資料にふさわしいモデルを選ぶ。・指数のモデルを底 で表す。
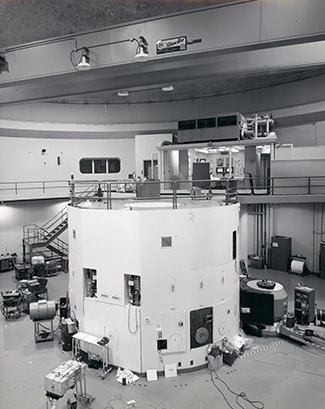
We have already explored some basic applications of exponential and logarithmic functions. In this section, we explore some important applications in more depth, including radioactive isotopes and Newton’s Law of Cooling.
指数関数と対数関数の基本の応用はすでにいくつか調べた。この節では、放射性同位体やニュートンの冷却の法則など、大切な応用のいくつかをもっと深く調べる。
Modeling Exponential Growth and Decay指数的な増加と減少のモデルを作る
In real-world applications, we need to model the behavior of a function. In mathematical modeling, we choose a familiar general function with properties that suggest that it will model the real-world phenomenon we wish to analyze. In the case of rapid growth, we may choose the exponential growth function:
現実の応用では、関数のふるまいのモデルを作る必要がある。数学のモデル作りでは、調べたい現実の現象のモデルになりそうな性質を持つ、よく知られた一般の関数を選ぶ。急速な増加の場合は、指数的な増加の関数を選べる。
where is equal to the value at time zero, is Euler’s constant, and is a positive constant that determines the rate (percentage) of growth. We may use the exponential growth function in applications involving doubling time, the time it takes for a quantity to double. Such phenomena as wildlife populations, financial investments, biological samples, and natural resources may exhibit growth based on a doubling time. In some applications, however, as we will see when we discuss the logistic equation, the logistic model sometimes fits the data better than the exponential model.
ここで は時刻0での値、 はオイラーの定数、 は増加の割合(百分率)を決める正の定数である。指数的な増加の関数は、ある量が2倍になるのにかかる時間、すなわち倍加時間を含む応用に使える。野生生物の個体数、金融の投資、生物の試料、天然資源といった現象は、倍加時間にもとづく増加を示しうる。だが応用によっては、ロジスティック方程式を論じるときに見るように、ロジスティックのモデルのほうが指数のモデルより資料によく当てはまることがある。
On the other hand, if a quantity is falling rapidly toward zero, without ever reaching zero, then we should probably choose the exponential decay model. Again, we have the form where is the starting value, and is Euler’s constant. Now is a negative constant that determines the rate of decay. We may use the exponential decay model when we are calculating half-life, or the time it takes for a substance to exponentially decay to half of its original quantity. We use half-life in applications involving radioactive isotopes.
一方、ある量が0に達することなく急速に0へ落ちていくなら、おそらく指数的な減少のモデルを選ぶべきである。ここでも形は で、 は出発点の値、 はオイラーの定数である。今度は が減少の割合を決める負の定数である。指数的な減少のモデルは、半減期、すなわちある物質が指数的に減って元の量の半分になるのにかかる時間を計算するときに使える。半減期は放射性同位体を含む応用で使う。
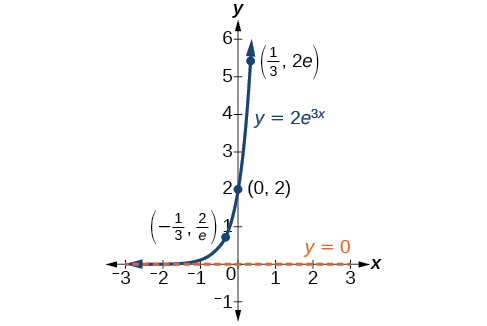
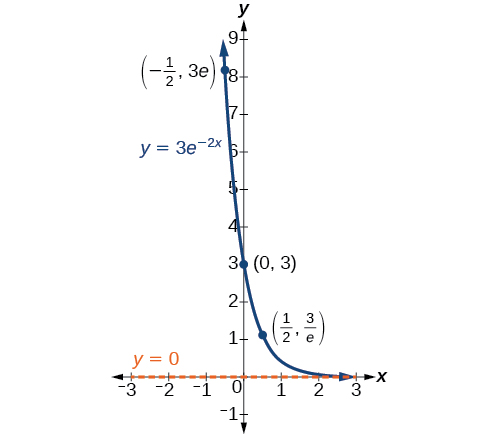
In our choice of a function to serve as a mathematical model, we often use data points gathered by careful observation and measurement to construct points on a graph and hope we can recognize the shape of the graph. Exponential growth and decay graphs have a distinctive shape, as we can see in Figure 2 and Figure 3. It is important to remember that, although parts of each of the two graphs seem to lie on the x-axis, they are really a tiny distance above the x-axis.
数学のモデルとして使う関数を選ぶとき、注意深い観察と測定で集めた資料の点をグラフに打ち、そのグラフの形が見分けられることを願うことが多い。図2と図3に見るとおり、指数的な増加と減少のグラフは際立った形をしている。二つのグラフのそれぞれの一部が x軸の上に乗っているように見えても、実際にはごくわずかに x軸より上にあることを忘れないのが大切である。
Exponential growth and decay often involve very large or very small numbers. To describe these numbers, we often use orders of magnitude. The order of magnitude is the power of ten, when the number is expressed in scientific notation, with one digit to the left of the decimal. For example, the distance to the nearest star, Proxima Centauri, measured in kilometers, is 40,113,497,200,000 kilometers. Expressed in scientific notation, this is So, we could describe this number as having order of magnitude
指数的な増加と減少は、しばしばとても大きな数やとても小さな数を伴う。こうした数を述べるのに、しばしば桁を使う。桁とは、小数点の左に一桁だけ置いて科学的記数法で表したときの、10の指数である。たとえば、最も近い恒星プロキシマ・ケンタウリまでの距離をキロメートルで測ると40,113,497,200,000キロメートルである。科学的記数法で表すと である。よって、この数は桁が であると述べられる。
Characteristics of the Exponential Function, 指数関数の特徴
Characteristics of the Exponential Function, 指数関数 の特徴
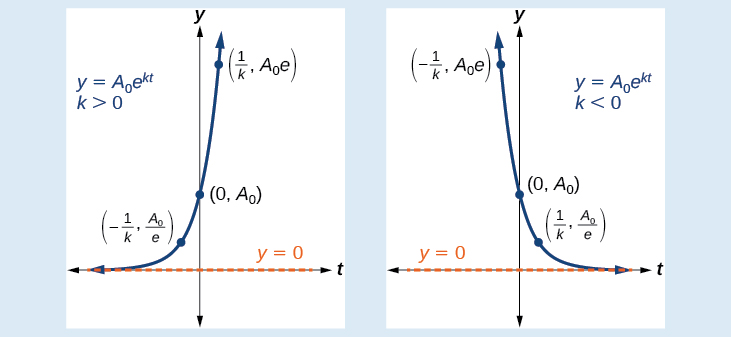
An exponential function with the form has the following characteristics:
の形の指数関数は、次の特徴を持つ。
• one-to-one function• horizontal asymptote: • domain: • range: • x intercept: none• y-intercept: • increasing if (see Figure 4)• decreasing if (see Figure 4)
・一対一の関数・水平漸近線: ・定義域: ・値域: ・x切片: 無し・y切片: ・ なら増加する(図4を見よ)・ なら減少する(図4を見よ)
Example 1例1
Graphing Exponential Growth指数的な増加のグラフを描く
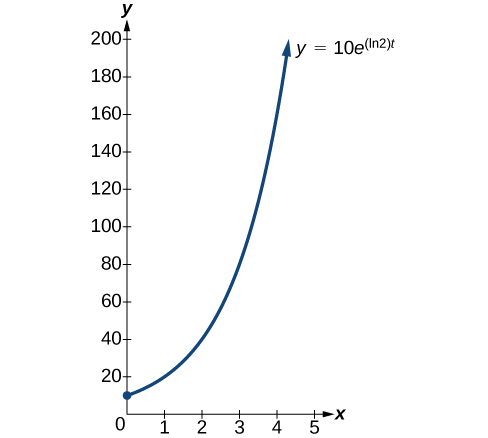
A population of bacteria doubles every hour. If the culture started with 10 bacteria, graph the population as a function of time.
ある細菌の個体数が1時間ごとに2倍になる。培養が細菌10個から始まったとして、個体数を時間の関数としてグラフに描け。
Solution 解答
When an amount grows at a fixed percent per unit time, the growth is exponential. To find we use the fact that is the amount at time zero, so To find use the fact that after one hour the population doubles from to The formula is derived as follows
ある量が単位時間あたり一定の百分率で増えるとき、その増加は指数的である。 を求めるには、 が時刻0での量であることを使って とする。 を求めるには、1時間後 に個体数が から へ2倍になることを使う。公式は次のように導かれる。
so Thus the equation we want to graph is The graph is shown in Figure 5.
よって である。したがって描きたい式は である。そのグラフを図5に示す。
Analysis 考察
The population of bacteria after ten hours is 10,240. We could describe this amount is being of the order of magnitude The population of bacteria after twenty hours is 10,485,760 which is of the order of magnitude so we could say that the population has increased by three orders of magnitude in ten hours.
10時間後の細菌の個体数は10,240である。この量は桁が であると述べられる。20時間後の細菌の個体数は10,485,760で、桁は である。よって、10時間で個体数が3桁増えたと言える。
Half-Life半減期
We now turn to exponential decay. One of the common terms associated with exponential decay, as stated above, is half-life, the length of time it takes an exponentially decaying quantity to decrease to half its original amount. Every radioactive isotope has a half-life, and the process describing the exponential decay of an isotope is called radioactive decay.
次は指数的な減少に移る。上で述べたとおり、指数的な減少に伴うよくある言葉の一つが半減期である。これは、指数的に減る量が元の量の半分に減るのにかかる時間の長さである。どの放射性同位体にも半減期があり、同位体の指数的な減少を述べる過程を放射性崩壊という。
To find the half-life of a function describing exponential decay, solve the following equation:
指数的な減少を述べる関数の半減期を求めるには、次の方程式を解く。
We find that the half-life depends only on the constant and not on the starting quantity
半減期は定数 だけに依り、出発点の量 には依らないと分かる。
The formula is derived as follows
公式は次のように導かれる。
Since the time, is positive, must, as expected, be negative. This gives us the half-life formula
時間 は正なので、見込みどおり は負でなければならない。これで半減期の公式が得られる。
How To 手順
Given the half-life, find the decay rate.
半減期が与えられたとき、崩壊の割合を求める。
1. Write 2. Replace by and replace by the given half-life.3. Solve to find Express as an exact value (do not round).
1. と書く。2. を に置き換え、 を与えられた半減期に置き換える。3. 解いて を求める。 は正確な値で表す(丸めない)。
Note: It is also possible to find the decay rate using
注意: を使っても崩壊の割合は求められる。
Example 2例2
Finding the Function that Describes Radioactive Decay放射性崩壊を述べる関数を求める
The half-life of carbon-14 is 5,730 years. Express the amount of carbon-14 remaining as a function of time,
炭素14の半減期は5,730年である。残る炭素14の量を時間 の関数として表せ。
Solution 解答
This formula is derived as follows.
この公式は次のように導かれる。
The function that describes this continuous decay is We observe that the coefficient of is negative, as expected in the case of exponential decay.
この連続の減少を述べる関数は である。指数的な減少の場合に見込まれるとおり、 の係数 が負であることに注目しよう。
Try It #1やってみよう1
The half-life of plutonium-244 is 80,000,000 years. Find a function that gives the amount of plutonium-244 remaining as a function of time, measured in years.
プルトニウム244の半減期は80,000,000年である。残るプルトニウム244の量を、年で測った時間の関数として与える関数を求めよ。
Radiocarbon Dating放射性炭素年代測定
The formula for radioactive decay is important in radiocarbon dating, which is used to calculate the approximate date a plant or animal died. Radiocarbon dating was discovered in 1949 by Willard Libby, who won a Nobel Prize for his discovery. It compares the difference between the ratio of two isotopes of carbon in an organic artifact or fossil to the ratio of those two isotopes in the air. It is believed to be accurate to within about 1% error for plants or animals that died within the last 60,000 years.
放射性崩壊の公式は放射性炭素年代測定で大切である。これは、植物や動物が死んだおおよその年代を計算するのに使われる。放射性炭素年代測定は1949年に Willard Libby が見いだし、彼はこの発見でノーベル賞を受けた。これは、有機物の遺物や化石の中の二つの炭素の同位体の比と、大気中のその二つの同位体の比との差を比べる。過去60,000年以内に死んだ植物や動物については、誤差およそ1%の範囲で正確だと考えられている。
Carbon-14 is a radioactive isotope of carbon that has a half-life of 5,730 years. It occurs in small quantities in the carbon dioxide in the air we breathe. Most of the carbon on Earth is carbon-12, which has an atomic weight of 12 and is not radioactive. Scientists have determined the ratio of carbon-14 to carbon-12 in the air for the last 60,000 years, using tree rings and other organic samples of known dates—although the ratio has changed slightly over the centuries.
炭素14は炭素の放射性同位体で、半減期は5,730年である。私たちが吸う空気の二酸化炭素の中に、わずかに含まれている。地球上の炭素のほとんどは炭素12で、原子量は12、放射性ではない。科学者は、年代の分かっている年輪やほかの有機物の試料を使って、過去60,000年の大気中の炭素14と炭素12の比を決めてきた。ただしこの比は、何世紀ものあいだにわずかに変わっている。
As long as a plant or animal is alive, the ratio of the two isotopes of carbon in its body is close to the ratio in the atmosphere. When it dies, the carbon-14 in its body decays and is not replaced. By comparing the ratio of carbon-14 to carbon-12 in a decaying sample to the known ratio in the atmosphere, the date the plant or animal died can be approximated.
植物や動物が生きているあいだは、その体の中の二つの炭素の同位体の比は大気中の比に近い。死ぬと、体の中の炭素14は崩壊し、補われない。崩壊しつつある試料の炭素14と炭素12の比を、大気中の分かっている比と比べれば、その植物や動物が死んだ年代をおおよそ求められる。
Since the half-life of carbon-14 is 5,730 years, the formula for the amount of carbon-14 remaining after years is
炭素14の半減期は5,730年なので、 年後に残る炭素14の量の公式は次のとおりである。
where
ここで
• is the amount of carbon-14 remaining• is the amount of carbon-14 when the plant or animal began decaying.
・ は残る炭素14の量、・ は植物や動物が崩壊し始めたときの炭素14の量である。
This formula is derived as follows:
この公式は次のように導かれる。
To find the age of an object, we solve this equation for
物の年代を求めるには、この方程式を について解く。
Out of necessity, we neglect here the many details that a scientist takes into consideration when doing carbon-14 dating, and we only look at the basic formula. The ratio of carbon-14 to carbon-12 in the atmosphere is approximately 0.0000000001%. Let be the ratio of carbon-14 to carbon-12 in the organic artifact or fossil to be dated, determined by a method called liquid scintillation. From the equation we know the ratio of the percentage of carbon-14 in the object we are dating to the initial amount of carbon-14 in the object when it was formed is We solve this equation for to get
やむを得ず、科学者が炭素14の年代測定をするときに勘定に入れる多くの細かい点はここでは省き、基本の公式だけを見る。大気中の炭素14と炭素12の比はおよそ0.0000000001%である。年代を測る有機物の遺物や化石の中の炭素14と炭素12の比を とする。これは液体シンチレーションと呼ばれる方法で決められる。式 から、年代を測る物の中の炭素14の割合と、その物ができたときの初めの炭素14の量との比が だと分かる。この方程式を について解くと、次が得られる。
How To 手順
Given the percentage of carbon-14 in an object, determine its age.
ある物の炭素14の割合が与えられたとき、その年代を決める。
1. Express the given percentage of carbon-14 as an equivalent decimal, 2. Substitute for k in the equation and solve for the age,
1. 与えられた炭素14の割合を、同値な小数 として表す。2. 式 の k に代入し、年代 について解く。
Example 3例3
Finding the Age of a Bone骨の年代を求める
A bone fragment is found that contains 20% of its original carbon-14. To the nearest year, how old is the bone?
元の炭素14の20%を含む骨の断片が見つかった。この骨は何年前のものか。年単位で答えよ。
Solution 解答
We substitute for in the equation and solve for
この式の に を代入し、 について解く。
The bone fragment is about 13,301 years old.
この骨の断片はおよそ13,301年前のものである。
Analysis 考察
The instruments that measure the percentage of carbon-14 are extremely sensitive and, as we mention above, a scientist will need to do much more work than we did in order to be satisfied. Even so, carbon dating is only accurate to about 1%, so this age should be given as
炭素14の割合を測る機器はきわめて敏感であり、上で述べたとおり、科学者が納得するにはここでしたよりずっと多くの仕事が要る。それでも、炭素年代測定の正確さはおよそ1%なので、この年代は として示すべきである。
Try It #2やってみよう2
Cesium-137 has a half-life of about 30 years. If we begin with 200 mg of cesium-137, will it take more or less than 230 years until only 1 milligram remains?
セシウム137の半減期はおよそ30年である。セシウム137が200mgから始まるとき、1ミリグラムだけになるまでにかかるのは230年より長いか、短いか。
Calculating Doubling Time倍加時間を計算する
For decaying quantities, we determined how long it took for half of a substance to decay. For growing quantities, we might want to find out how long it takes for a quantity to double. As we mentioned above, the time it takes for a quantity to double is called the doubling time.
減る量については、その物質の半分が崩壊するのにどれだけかかるかを決めた。増える量については、ある量が2倍になるのにどれだけかかるかを知りたくなるだろう。上で述べたとおり、ある量が2倍になるのにかかる時間を倍加時間という。
Given the basic exponential growth equation doubling time can be found by solving for when the original quantity has doubled, that is, by solving
基本の指数的な増加の式 が与えられたとき、倍加時間は、元の量が2倍になるときを解けば、すなわち を解けば求まる。
The formula is derived as follows:
公式は次のように導かれる。
Thus the doubling time is
したがって倍加時間は次のとおりである。
Example 4例4
Finding a Function That Describes Exponential Growth指数的な増加を述べる関数を求める
According to Moore’s Law, the doubling time for the number of transistors that can be put on a computer chip is approximately two years. Give a function that describes this behavior.
ムーアの法則によれば、コンピュータのチップに載せられるトランジスタの数の倍加時間はおよそ2年である。このふるまいを述べる関数を与えよ。
Solution 解答
The formula is derived as follows:
公式は次のように導かれる。
The function is
関数は である。
Try It #3やってみよう3
Recent data suggests that, as of 2013, the rate of growth predicted by Moore’s Law no longer holds. Growth has slowed to a doubling time of approximately three years. Find the new function that takes that longer doubling time into account.
最近の資料は、2013年の時点でムーアの法則が予測する増加の割合がもはや成り立たないことを示している。増加は緩み、倍加時間はおよそ3年になった。この長くなった倍加時間を勘定に入れた新しい関数を求めよ。
Using Newton’s Law of Coolingニュートンの冷却の法則を使う
Exponential decay can also be applied to temperature. When a hot object is left in surrounding air that is at a lower temperature, the object’s temperature will decrease exponentially, leveling off as it approaches the surrounding air temperature. On a graph of the temperature function, the leveling off will correspond to a horizontal asymptote at the temperature of the surrounding air. Unless the room temperature is zero, this will correspond to a vertical shift of the generic exponential decay function. This translation leads to Newton’s Law of Cooling, the scientific formula for temperature as a function of time as an object’s temperature is equalized with the ambient temperature
指数的な減少は温度にも当てはめられる。熱い物を、それより低い温度の空気の中に置いておくと、その物の温度は指数的に下がり、周りの空気の温度に近づくにつれて水平に落ち着く。温度の関数のグラフでは、この水平に落ち着くようすが、周りの空気の温度における水平漸近線に当たる。室温が0でない限り、これは一般の指数的な減少の関数を縦に移したものになる。この平行移動からニュートンの冷却の法則が導かれる。これは、物の温度が周りの温度と等しくなっていくときの、時間の関数としての温度を与える科学の公式である。
This formula is derived as follows:
この公式は次のように導かれる。
Newton’s Law of Cooling ニュートンの冷却の法則
The temperature of an object, in surrounding air with temperature will behave according to the formula
温度 の周りの空気の中にある物の温度 は、次の公式に従ってふるまう。
where
ここで
• is time• is the difference between the initial temperature of the object and the surroundings• is a constant, the continuous rate of cooling of the object
・ は時間、・ はその物の初めの温度と周りの温度の差、・ は定数で、その物の連続の冷却の割合である。
How To 手順
Given a set of conditions, apply Newton’s Law of Cooling.
一組の条件が与えられたとき、ニュートンの冷却の法則を当てはめる。
1. Set equal to the y-coordinate of the horizontal asymptote (usually the ambient temperature).2. Substitute the given values into the continuous growth formula to find the parameters and 3. Substitute in the desired time to find the temperature or the desired temperature to find the time.
1. を水平漸近線の y座標(ふつうは周りの温度)に等しくおく。2. 与えられた値を連続の増加の公式 に代入して、母数 と を求める。3. 温度を求めるなら知りたい時刻を、時刻を求めるなら知りたい温度を代入する。
Example 5例5
Using Newton’s Law of Coolingニュートンの冷却の法則を使う
A cheesecake is taken out of the oven with an ideal internal temperature of and is placed into a refrigerator. After 10 minutes, the cheesecake has cooled to If we must wait until the cheesecake has cooled to before we eat it, how long will we have to wait?
チーズケーキを、中心温度が理想の の状態でオーブンから取り出し、 の冷蔵庫に入れる。10分後、チーズケーキは まで冷めている。食べる前にチーズケーキが まで冷めるのを待たなければならないなら、どれだけ待つことになるか。
Solution 解答
Because the surrounding air temperature in the refrigerator is 35 degrees, the cheesecake’s temperature will decay exponentially toward 35, following the equation
冷蔵庫の中の周りの空気の温度は35度なので、チーズケーキの温度は次の式に従って35に向かって指数的に下がる。
We know the initial temperature was 165, so
初めの温度は165だったと分かっているので である。
We were given another data point, which we can use to solve for
資料の点がもう一つ 与えられているので、これを使って について解ける。
This gives us the equation for the cooling of the cheesecake:
これで、チーズケーキが冷める式 が得られる。
Now we can solve for the time it will take for the temperature to cool to 70 degrees.
これで、温度が70度まで冷めるのにかかる時間が解ける。
It will take about 107 minutes, or one hour and 47 minutes, for the cheesecake to cool to
チーズケーキが まで冷めるのに、およそ107分、すなわち1時間47分かかる。
Try It #4やってみよう4
A pitcher of water at 40 degrees Fahrenheit is placed into a 70 degree room. One hour later, the temperature has risen to 45 degrees. How long will it take for the temperature to rise to 60 degrees?
華氏40度の水差しを、70度の部屋に置く。1時間後、温度は45度に上がっている。温度が60度に上がるまでに、どれだけかかるか。
Using Logistic Growth Modelsロジスティック増加のモデルを使う
Exponential growth cannot continue forever. Exponential models, while they may be useful in the short term, tend to fall apart the longer they continue. Consider an aspiring writer who writes a single line on day one and plans to double the number of lines she writes each day for a month. By the end of the month, she must write over 17 billion lines, or one-half-billion pages. It is impractical, if not impossible, for anyone to write that much in such a short period of time. Eventually, an exponential model must begin to approach some limiting value, and then the growth is forced to slow. For this reason, it is often better to use a model with an upper bound instead of an exponential growth model, though the exponential growth model is still useful over a short term, before approaching the limiting value.
指数的な増加は永遠には続けられない。指数のモデルは短い期間では役立つが、続ければ続けるほど崩れがちである。初日に1行書き、1か月のあいだ毎日書く行数を2倍にしようと考える、作家志望の人を考えよう。その月の終わりまでに、彼女は170億行を超える、すなわち5億ページを書かなければならない。そんな短い期間にそれだけ書くのは、不可能でないにしても現実的でない。いずれ指数のモデルはある限りの値に近づき始め、増加は緩まざるを得ない。このため、指数的な増加のモデルより上限のあるモデルを使うほうが良いことが多い。ただし限りの値に近づく前の短い期間なら、指数的な増加のモデルもやはり役立つ。
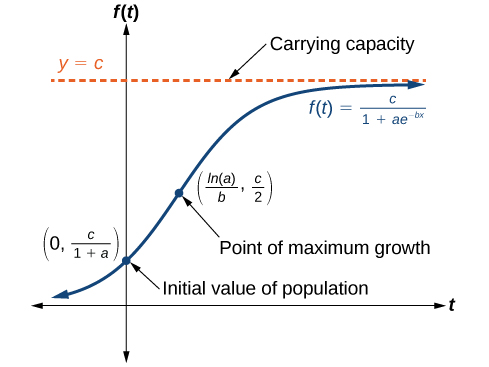
The logistic growth model is approximately exponential at first, but it has a reduced rate of growth as the output approaches the model’s upper bound, called the carrying capacity. For constants and the logistic growth of a population over time is represented by the model
ロジスティック増加のモデルは、初めのうちはほぼ指数的だが、出力がモデルの上限、すなわち環境収容力に近づくにつれて増加の割合が落ちる。定数 と について、時間 にわたる個体数のロジスティック増加は次のモデルで表される。
The graph in Figure 6 shows how the growth rate changes over time. The graph increases from left to right, but the growth rate only increases until it reaches its point of maximum growth rate, at which point the rate of increase decreases.
図6のグラフは、増加の割合が時間とともにどう変わるかを示している。グラフは左から右へ増えるが、増加の割合が増えるのは、増加の割合が最大になる点に達するまでで、そこから先は増える勢いが落ちる。
Logistic Growth ロジスティック成長
The logistic growth model is
ロジスティック増加のモデルは次のとおりである。
where
ここで
• is the initial value• is the carrying capacity, or limiting value• is a constant determined by the rate of growth.
・ は初期値、・ は環境収容力、すなわち限りの値、・ は増加の割合で決まる定数である。
Example 6例6
Using the Logistic-Growth Modelロジスティック増加のモデルを使う
An influenza epidemic spreads through a population rapidly, at a rate that depends on two factors: The more people who have the flu, the more rapidly it spreads, and also the more uninfected people there are, the more rapidly it spreads. These two factors make the logistic model a good one to study the spread of communicable diseases. And, clearly, there is a maximum value for the number of people infected: the entire population.
インフルエンザの流行は集団の中を急速に広がる。その速さは二つの要因に依る。インフルエンザにかかっている人が多いほど速く広がり、まだかかっていない人が多いほど速く広がる。この二つの要因のおかげで、ロジスティックのモデルは伝染病の広がりを調べるのに良いものになる。そして明らかに、感染する人の数には最大の値がある。集団全体である。
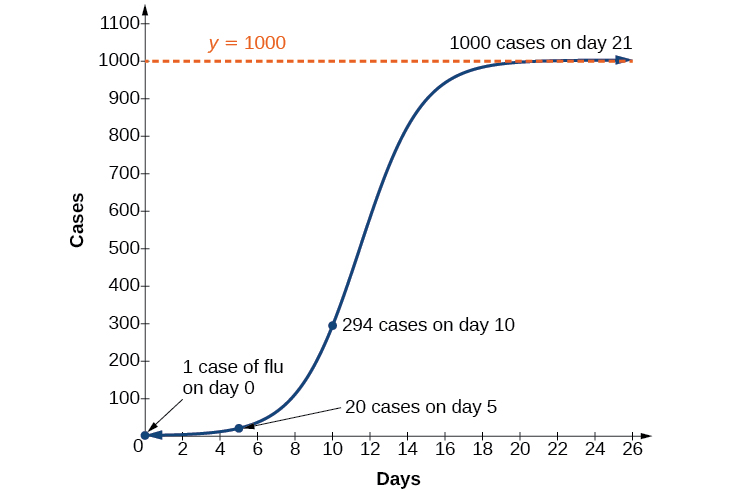
For example, at time there is one person in a community of 1,000 people who has the flu. So, in that community, at most 1,000 people can have the flu. Researchers find that for this particular strain of the flu, the logistic growth constant is Estimate the number of people in this community who will have had this flu after ten days. Predict how many people in this community will have had this flu after a long period of time has passed.
たとえば、時刻 に、1,000人の共同体の中でインフルエンザにかかっている人が1人いるとする。よってこの共同体では、インフルエンザにかかりうるのは多くて1,000人である。研究者は、このインフルエンザの株についてロジスティック増加の定数が だと見いだした。この共同体で10日後までにこのインフルエンザにかかったことのある人の数を見積もれ。長い時間が経った後、この共同体で何人がこのインフルエンザにかかったことになるかを予測せよ。
Solution 解答
We substitute the given data into the logistic growth model
与えられた資料をロジスティック増加のモデルに代入する。
Because at most 1,000 people, the entire population of the community, can get the flu, we know the limiting value is To find we use the formula that the number of cases at time is from which it follows that This model predicts that, after ten days, the number of people who have had the flu is Because the actual number must be a whole number (a person has either had the flu or not) we round to 294. In the long term, the number of people who will contract the flu is the limiting value,
インフルエンザにかかりうるのは多くて共同体の全人口1,000人なので、限りの値は だと分かる。 を求めるには、時刻 の患者の数が であるという式を使う。ここから が得られる。このモデルは、10日後にインフルエンザにかかったことのある人の数が だと予測する。実際の数は整数でなければならない(人はインフルエンザにかかったか、かかっていないかのどちらかである)ので、294に丸める。長い目で見れば、インフルエンザにかかる人の数は限りの値 である。
Analysis 考察
Remember that, because we are dealing with a virus, we cannot predict with certainty the number of people infected. The model only approximates the number of people infected and will not give us exact or actual values.
ウイルスを扱っているので、感染する人の数を確かに予測することはできないのを忘れないでほしい。このモデルは感染する人の数を近似するだけで、正確な値や実際の値を与えるものではない。
The graph in Figure 7 gives a good picture of how this model fits the data.
図7のグラフは、このモデルが資料にどう当てはまるかをよく示している。
Try It #5やってみよう5
Using the model in Example 6, estimate the number of cases of flu on day 15.
例6のモデルを使って、15日目のインフルエンザの患者数を見積もれ。
Choosing an Appropriate Model for Data資料にふさわしいモデルを選ぶ
Now that we have discussed various mathematical models, we need to learn how to choose the appropriate model for the raw data we have. Many factors influence the choice of a mathematical model, among which are experience, scientific laws, and patterns in the data itself. Not all data can be described by elementary functions. Sometimes, a function is chosen that approximates the data over a given interval. For instance, suppose data were gathered on the number of homes bought in the United States from the years 1960 to 2013. After plotting these data in a scatter plot, we notice that the shape of the data from the years 2000 to 2013 follow a logarithmic curve. We could restrict the interval from 2000 to 2010, apply regression analysis using a logarithmic model, and use it to predict the number of home buyers for the year 2015.
さまざまな数学のモデルを論じたので、手元の生の資料にふさわしいモデルをどう選ぶかを学ぶ必要がある。数学のモデルを選ぶには多くの要因が関わる。経験、科学の法則、そして資料そのものの傾向などである。すべての資料が初等的な関数で述べられるわけではない。ある区間で資料を近似する関数を選ぶこともある。たとえば、1960年から2013年までのアメリカ合衆国での住宅購入数の資料を集めたとしよう。この資料を散布図に打つと、2000年から2013年までの資料の形が対数の曲線に従っているのに気づく。区間を2000年から2010年に限り、対数のモデルで回帰分析を当てはめ、それを使って2015年の住宅購入者数を予測できる。
Three kinds of functions that are often useful in mathematical models are linear functions, exponential functions, and logarithmic functions. If the data lies on a straight line, or seems to lie approximately along a straight line, a linear model may be best. If the data is non-linear, we often consider an exponential or logarithmic model, though other models, such as quadratic models, may also be considered.
数学のモデルでしばしば役立つ関数の種類が三つある。一次関数、指数関数、対数関数である。資料が直線上にあるか、おおよそ直線に沿っているように見えるなら、一次のモデルが最も良いかもしれない。資料が一次でないなら、しばしば指数か対数のモデルを考えるが、二次のモデルなどほかのモデルも考えられる。
In choosing between an exponential model and a logarithmic model, we look at the way the data curves. This is called the concavity. If we draw a line between two data points, and all (or most) of the data between those two points lies above that line, we say the curve is concave down. We can think of it as a bowl that bends downward and therefore cannot hold water. If all (or most) of the data between those two points lies below the line, we say the curve is concave up. In this case, we can think of a bowl that bends upward and can therefore hold water. An exponential curve, whether rising or falling, whether representing growth or decay, is always concave up away from its horizontal asymptote. A logarithmic curve is always concave away from its vertical asymptote. In the case of positive data, which is the most common case, an exponential curve is always concave up, and a logarithmic curve always concave down.
指数のモデルと対数のモデルのどちらを選ぶかは、資料の曲がり方を見る。これを凹凸という。資料の点二つのあいだに直線を引き、その二点のあいだの資料のすべて(または大半)がその直線より上にあるなら、その曲線は上に凸だという。下に曲がっていて水を溜められない鉢と思えばよい。その二点のあいだの資料のすべて(または大半)が直線より下にあるなら、その曲線は下に凸だという。この場合は、上に曲がっていて水を溜められる鉢と思えばよい。指数の曲線は、上がっていても下がっていても、増加を表していても減少を表していても、つねに水平漸近線から離れる向きに下に凸である。対数の曲線は、つねに垂直漸近線から離れる向きに凸である。最もよくある正の資料の場合、指数の曲線はつねに下に凸、対数の曲線はつねに上に凸である。
A logistic curve changes concavity. It starts out concave up and then changes to concave down beyond a certain point, called a point of inflection.
ロジスティックの曲線は凹凸が変わる。初めは下に凸で、ある点、すなわち変曲点を過ぎると上に凸に変わる。
After using the graph to help us choose a type of function to use as a model, we substitute points, and solve to find the parameters. We reduce round-off error by choosing points as far apart as possible.
グラフを手がかりにモデルとして使う関数の種類を選んだら、点を代入して解き、母数を求める。できるだけ離れた点を選べば、丸めの誤差が減る。
Example 7例7
Choosing a Mathematical Model数学のモデルを選ぶ
Does a linear, exponential, logarithmic, or logistic model best fit the values listed in Table 1? Find the model, and use a graph to check your choice.
表1に挙げた値に最もよく当てはまるのは、一次・指数・対数・ロジスティックのどのモデルか。そのモデルを求め、グラフを使って選択を確かめよ。
| 1 | 2 | 3 | 4 | 5 | 6 | 7 | 8 | 9 | |
| 0 | 1.386 | 2.197 | 2.773 | 3.219 | 3.584 | 3.892 | 4.159 | 4.394 |
Solution 解答
First, plot the data on a graph as in Figure 8. For the purpose of graphing, round the data to two decimal places.
まず、図8のように資料をグラフに打つ。グラフを描くために、資料は小数第二位まで丸める。
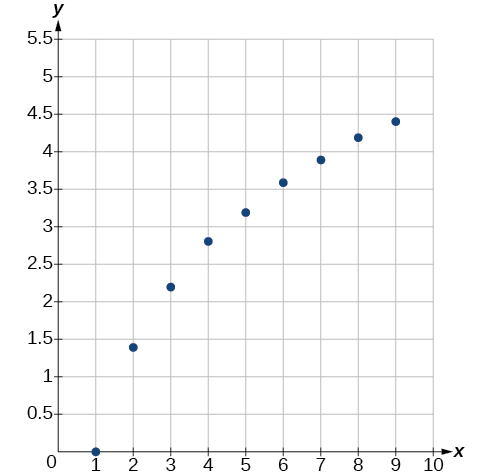
Clearly, the points do not lie on a straight line, so we reject a linear model. If we draw a line between any two of the points, most or all of the points between those two points lie above the line, so the graph is concave down, suggesting a logarithmic model. We can try Plugging in the first point, gives We reject the case that (if it were, all outputs would be 0), so we know Thus and Next we can use the point to solve for
明らかに、点は直線上に無いので一次のモデルは退ける。どの二点のあいだに直線を引いても、その二点のあいだの点の大半かすべてが直線より上にあるので、このグラフは上に凸であり、対数のモデルが見込まれる。 を試せる。最初の点 を入れると が得られる。 の場合は退ける(もしそうなら出力がすべて0になる)ので、 だと分かる。よって であり である。次に、点 を使って について解ける。
Because an appropriate model for the data is
なので、この資料にふさわしいモデルは である。
To check the accuracy of the model, we graph the function together with the given points as in Figure 9.
このモデルの正確さを確かめるために、図9のようにこの関数を与えられた点と一緒にグラフに描く。
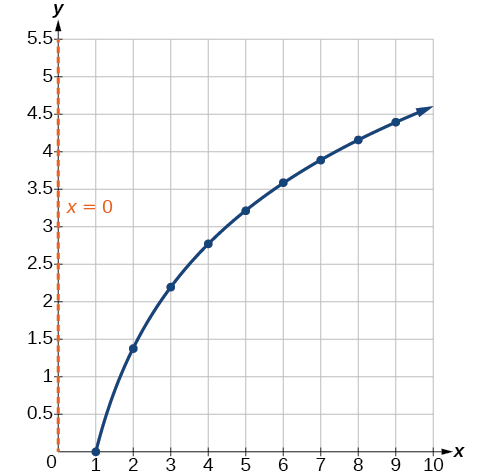
We can conclude that the model is a good fit to the data.
このモデルが資料によく当てはまると結論できる。
The graphs appear to be identical when A quick check confirms this conclusion: for
のとき、二つのグラフは同じに見える。手早く確かめればこの結論が裏づけられる: について である。
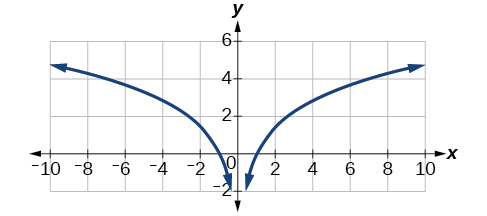
However, if the graph of includes a “extra” branch, as shown in Figure 11. This occurs because, while cannot have negative values in the domain (as such values would force the argument to be negative), the function can have negative domain values.
だが のとき、 のグラフには図11に示すような「余分な」枝が現れる。これは、 は定義域に負の値をとれない(そうすると真数が負になってしまう)のに対し、関数 は定義域に負の値をとれるからである。
Try It #6やってみよう6
Does a linear, exponential, or logarithmic model best fit the data in Table 2? Find the model.
表2の資料に最もよく当てはまるのは、一次・指数・対数のどのモデルか。そのモデルを求めよ。
| 1 | 2 | 3 | 4 | 5 | 6 | 7 | 8 | 9 | |
| 3.297 | 5.437 | 8.963 | 14.778 | 24.365 | 40.172 | 66.231 | 109.196 | 180.034 |
Expressing an Exponential Model in Base 指数のモデルを底 で表す
While powers and logarithms of any base can be used in modeling, the two most common bases are and In science and mathematics, the base is often preferred. We can use laws of exponents and laws of logarithms to change any base to base
モデル作りにはどんな底の累乗や対数も使えるが、最もよく使われる二つの底は と である。科学と数学では、しばしば底 が好まれる。指数の法則と対数の法則を使えば、どんな底も底 に変えられる。
How To 手順
Given a model with the form change it to the form
の形のモデルが与えられたとき、それを の形に変える。
1. Rewrite as 2. Use the power rule of logarithms to rewrite y as 3. Note that and in the equation
1. を と書き直す。2. 対数の累乗の法則を使って、y を と書き直す。3. 式 で かつ であることに注意せよ。
Example 8例8
Changing to base e底 e に変える
Change the function so that this same function is written in the form
関数 を、同じ関数が の形で書かれるように変えよ。
Solution 解答
The formula is derived as follows
公式は次のように導かれる。
Try It #7やってみよう7
Change the function to one having as the base.
関数 を、 を底とするものに変えよ。
Media 教材
Access these online resources for additional instruction and practice with exponential and logarithmic models.
指数・対数モデルについての説明と練習をさらに求めるなら、次のオンライン教材にあたるとよい。
• Logarithm Application – pH• Exponential Model – Age Using Half-Life• Newton’s Law of Cooling• Exponential Growth Given Doubling Time• Exponential Growth – Find Initial Amount Given Doubling Time
・対数の応用 — pH・指数のモデル — 半減期を使った年代・ニュートンの冷却の法則・倍加時間が与えられた指数的な増加・指数的な増加 — 倍加時間から初めの量を求める
Verbal言葉で答える問題
2. What is carbon dating? Why does it work? Give an example in which carbon dating would be useful.
2. 炭素年代測定とは何か。なぜそれが成り立つのか。炭素年代測定が役立つ例を一つ挙げよ。
4. Define Newton’s Law of Cooling. Then name at least three real-world situations where Newton’s Law of Cooling would be applied.
4. ニュートンの冷却の法則を述べよ。そして、ニュートンの冷却の法則が当てはまる現実の状況を少なくとも三つ挙げよ。
Numeric数値の問題
6. The temperature of an object in degrees Fahrenheit after t minutes is represented by the equation To the nearest degree, what is the temperature of the object after one and a half hours?
6. t 分後の物の温度(華氏)は、式 で表される。1時間半後のこの物の温度は、度単位でいくらか。
For the following exercises, use the logistic growth model
次の各問では、ロジスティック増加のモデル を使え。
8. Find and interpret Round to the nearest tenth.
8. を求めて読み解け。小数第一位まで丸めよ。
10. Graph the model.
10. このモデルのグラフを描け。
11. Determine whether the data from the table could best be represented as a function that is linear, exponential, or logarithmic. Then write a formula for a model that represents the data.
11. 表の資料が、一次・指数・対数のどの関数として最もよく表せるかを判定せよ。そして、その資料を表すモデルの式を書け。
| –2 | 0.694 |
| –1 | 0.833 |
| 0 | 1 |
| 1 | 1.2 |
| 2 | 1.44 |
| 3 | 1.728 |
| 4 | 2.074 |
| 5 | 2.488 |
12. Rewrite as an exponential equation with base to five decimal places.
12. を底 の指数の式として、小数第五位まで書き直せ。
Technology機器を使う問題
For the following exercises, enter the data from each table into a graphing calculator and graph the resulting scatter plots. Determine whether the data from the table could represent a function that is linear, exponential, or logarithmic.
次の各問について、各表の資料をグラフ電卓に入れ、できあがった散布図を描け。表の資料が一次・指数・対数のどの関数を表しうるかを判定せよ。
| 1 | 2 |
| 2 | 4.079 |
| 3 | 5.296 |
| 4 | 6.159 |
| 5 | 6.828 |
| 6 | 7.375 |
| 7 | 7.838 |
| 8 | 8.238 |
| 9 | 8.592 |
| 10 | 8.908 |
| 1 | 2.4 |
| 2 | 2.88 |
| 3 | 3.456 |
| 4 | 4.147 |
| 5 | 4.977 |
| 6 | 5.972 |
| 7 | 7.166 |
| 8 | 8.6 |
| 9 | 10.32 |
| 10 | 12.383 |
| 4 | 9.429 |
| 5 | 9.972 |
| 6 | 10.415 |
| 7 | 10.79 |
| 8 | 11.115 |
| 9 | 11.401 |
| 10 | 11.657 |
| 11 | 11.889 |
| 12 | 12.101 |
| 13 | 12.295 |
| 1.25 | 5.75 |
| 2.25 | 8.75 |
| 3.56 | 12.68 |
| 4.2 | 14.6 |
| 5.65 | 18.95 |
| 6.75 | 22.25 |
| 7.25 | 23.75 |
| 8.6 | 27.8 |
| 9.25 | 29.75 |
| 10.5 | 33.5 |
For the following exercises, use a graphing calculator and this scenario: the population of a fish farm in years is modeled by the equation
次の各問では、グラフ電卓と次の筋書きを使え。 年後の養魚場の魚の数は、式 でモデル化される。
18. What is the initial population of fish?
18. 魚の初めの数はいくらか。
20. To the nearest whole number, what will the fish population be after years?
20. 年後の魚の数は、整数でいくらになるか。
22. What is the carrying capacity for the fish population? Justify your answer using the graph of
22. 魚の数の環境収容力はいくらか。 のグラフを使って答えの根拠を示せ。
Extensions発展問題
23. A substance has a half-life of 2.045 minutes. If the initial amount of the substance was 132.8 grams, how many half-lives will have passed before the substance decays to 8.3 grams? What is the total time of decay?
23. ある物質の半減期は2.045分である。この物質の初めの量が132.8グラムだったとき、8.3グラムに減るまでに半減期は何回過ぎるか。崩壊にかかる時間は全部でいくらか。
24. The formula for an increasing population is given by where is the initial population and Derive a general formula for the time t it takes for the population to increase by a factor of M.
24. 増える個体数の公式は で与えられる。ここで は初めの個体数、 である。個体数が M 倍になるのにかかる時間 t の一般の公式を導け。
26. What is the y-intercept of the logistic growth model Show the steps for calculation. What does this point tell us about the population?
26. ロジスティック増加のモデル の y切片は何か。計算の手順を示せ。この点は個体数について何を教えているか。
Real-World Applications応用問題
For the following exercises, use this scenario: A doctor prescribes 125 milligrams of a therapeutic drug that decays by about 30% each hour.
次の各問では、次の筋書きを使え。ある医師が、1時間ごとにおよそ30%ずつ減る治療薬を125ミリグラム処方する。
28. To the nearest hour, what is the half-life of the drug?
28. この薬の半減期は、時間単位でいくらか。
29. Write an exponential model representing the amount of the drug remaining in the patient’s system after hours. Then use the formula to find the amount of the drug that would remain in the patient’s system after 3 hours. Round to the nearest milligram.
29. 時間後に患者の体内に残る薬の量を表す指数のモデルを書け。そしてその式を使って、3時間後に患者の体内に残る薬の量を求めよ。ミリグラム単位に丸めよ。
30. Using the model found in the previous exercise, find and interpret the result. Round to the nearest hundredth.
30. 前問で求めたモデルを使って を求め、その結果を読み解け。小数第二位まで丸めよ。
For the following exercises, use this scenario: A tumor is injected with grams of Iodine-125, which has a decay rate of per day.
次の各問では、次の筋書きを使え。ある腫瘍に、1日あたり の割合で減るヨウ素125を グラム注入する。
32. Write an exponential model representing the amount of Iodine-125 remaining in the tumor after days. Then use the formula to find the amount of Iodine-125 that would remain in the tumor after 60 days. Round to the nearest tenth of a gram.
32. 日後に腫瘍に残るヨウ素125の量を表す指数のモデルを書け。そしてその式を使って、60日後に腫瘍に残るヨウ素125の量を求めよ。グラムの小数第一位まで丸めよ。
33. A scientist begins with grams of a radioactive substance. After minutes, the sample has decayed to grams. Rounding to five decimal places, write an exponential equation representing this situation. To the nearest minute, what is the half-life of this substance?
33. ある科学者が、放射性物質 グラムから始める。 分後、その試料は グラムに減っている。小数第五位まで丸めて、この状況を表す指数の式を書け。この物質の半減期は、分単位でいくらか。
34. The half-life of Radium-226 is years. What is the annual decay rate? Express the decimal result to four decimal places and the percentage to two decimal places.
34. ラジウム226の半減期は 年である。年ごとの崩壊の割合はいくらか。小数の結果は小数第四位まで、百分率は小数第二位まで表せ。
36. A wooden artifact from an archeological dig contains 60 percent of the carbon-14 that is present in living trees. To the nearest year, about how many years old is the artifact? (The half-life of carbon-14 is years.)
36. 考古学の発掘で見つかった木の遺物には、生きている木にある炭素14の60%が含まれている。この遺物はおよそ何年前のものか。年単位で答えよ。(炭素14の半減期は 年である。)
37. A research student is working with a culture of bacteria that doubles in size every twenty minutes. The initial population count was bacteria. Rounding to five decimal places, write an exponential equation representing this situation. To the nearest whole number, what is the population size after hours?
37. ある研究生が、20分ごとに大きさが2倍になる細菌の培養を扱っている。初めの個体数は 個だった。小数第五位まで丸めて、この状況を表す指数の式を書け。 時間後の個体数は、整数でいくらか。
For the following exercises, use this scenario: A biologist recorded a count of bacteria present in a culture after 5 minutes and 1000 bacteria present after 20 minutes.
次の各問では、次の筋書きを使え。ある生物学者が、培養の中に5分後に 個、20分後に1000個の細菌がいると記録した。
38. To the nearest whole number, what was the initial population in the culture?
38. この培養の初めの個体数は、整数でいくらだったか。
For the following exercises, use this scenario: A pot of warm soup with an internal temperature of Fahrenheit was taken off the stove to cool in a room. After fifteen minutes, the internal temperature of the soup was
次の各問では、次の筋書きを使え。中心温度が華氏 度の温かいスープの鍋を、 度の部屋で冷ますためにこんろから下ろした。15分後、スープの中心温度は だった。
40. Use Newton’s Law of Cooling to write a formula that models this situation.
40. ニュートンの冷却の法則を使って、この状況のモデルとなる式を書け。
42. To the nearest degree, what will the temperature be after and a half hours?
42. 時間半後の温度は、度単位でいくらになるか。
For the following exercises, use this scenario: A turkey is taken out of the oven with an internal temperature of and is allowed to cool in a room. After half an hour, the internal temperature of the turkey is
次の各問では、次の筋書きを使え。中心温度が の七面鳥をオーブンから取り出し、 の部屋で冷ます。30分後、七面鳥の中心温度は である。
44. To the nearest degree, what will the temperature be after 50 minutes?
44. 50分後の温度は、度単位でいくらになるか。
For the following exercises, find the value of the number shown on each logarithmic scale. Round all answers to the nearest thousandth.
次の各問について、各対数の尺度に示された数の値を求めよ。答えはすべて小数第三位まで丸めよ。


48. Plot each set of approximate values of intensity of sounds on a logarithmic scale: Whisper: Vacuum: Jet:
48. 次の音の強さのおおよその値の組を、それぞれ対数の尺度に打て。ささやき: 、掃除機: 、ジェット機: 。
49. Recall the formula for calculating the magnitude of an earthquake, One earthquake has magnitude on the MMS scale. If a second earthquake has times as much energy as the first, find the magnitude of the second quake. Round to the nearest hundredth.
49. 地震の規模を計算する公式 を思い出そう。ある地震は MMS 尺度で規模 である。二つ目の地震が一つ目の 倍のエネルギーを持つとき、二つ目の地震の規模を求めよ。小数第二位まで丸めよ。
For the following exercises, use this scenario: The equation models the number of people in a town who have heard a rumor after t days.
次の各問では、次の筋書きを使え。式 は、t 日後に噂を聞いた町の人の数のモデルである。
50. How many people started the rumor?
50. 噂を始めたのは何人か。
52. As increases without bound, what value does approach? Interpret your answer.
52. が限りなく増えると、 はどんな値に近づくか。その答えを読み解け。
For the following exercise, choose the correct answer choice.
次の問について、正しい選択肢を選べ。
53. A doctor injects a patient with 13 milligrams of radioactive dye that decays exponentially. After 12 minutes, there are 4.75 milligrams of dye remaining in the patient’s system. Which is an appropriate model for this situation?
53. ある医師が、指数的に減る放射性の造影剤13ミリグラムを患者に注射する。12分後、患者の体内には造影剤が4.75ミリグラム残っている。この状況にふさわしいモデルはどれか。