第6章指数関数と対数関数Exponential and Logarithmic Functions
Graphing Transformations of Logarithmic Functions対数関数を変形したグラフを描く
As we mentioned in the beginning of the section, transformations of logarithmic graphs behave similarly to those of other parent functions. We can shift, stretch, compress, and reflect the parent function without loss of shape.
この節の初めに述べたとおり、対数のグラフの変形は、ほかの親関数のそれと同じようにふるまう。親関数 を、形を崩さずに移動・伸長・圧縮・折り返しできる。
Graphing a Horizontal Shift of f(x) = logb(x)f(x) = logb(x) を横に移したグラフを描く
When a constant is added to the input of the parent function the result is a horizontal shift units in the opposite direction of the sign on To visualize horizontal shifts, we can observe the general graph of the parent function and for alongside the shift left, and the shift right, See Figure 6.
親関数 の入力に定数 を足すと、 の符号と逆の向きに 単位の横の移動になる。横の移動を目で見るために、親関数 の一般のグラフと、 について、左への移動 と右への移動 を並べて見よう。図6を見よ。
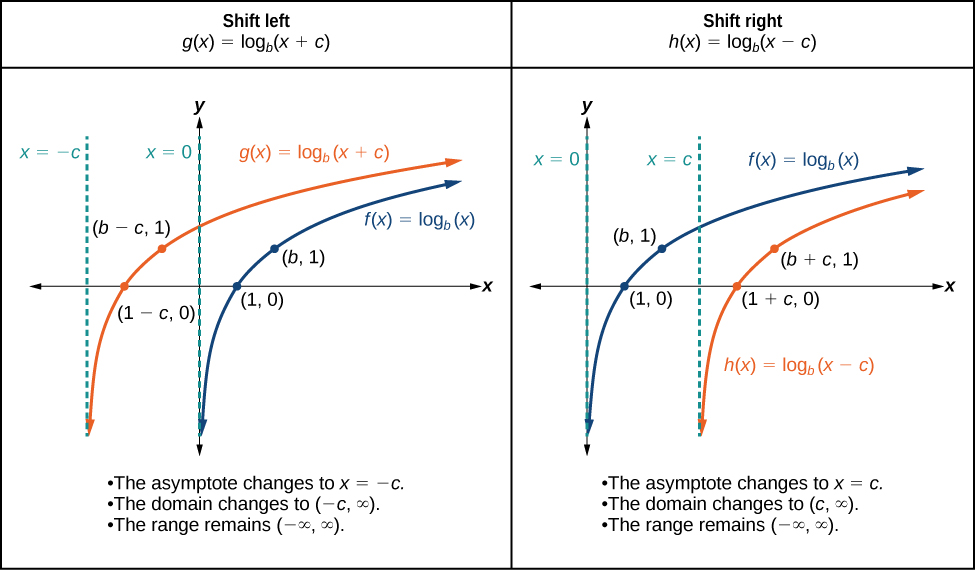
Horizontal Shifts of the Parent Function 基本となるグラフの左右への平行移動
Horizontal Shifts of the Parent Function 親関数 の横の移動
For any constant the function
任意の定数 について、関数 は次のとおりである。
• shifts the parent function left units if • shifts the parent function right units if • has the vertical asymptote • has domain • has range
・ なら、親関数 を左に 単位移す。・ なら、親関数 を右に 単位移す。・垂直漸近線 を持つ。・定義域 を持つ。・値域 を持つ。
How To 手順
Given a logarithmic function with the form graph the translation.
の形の対数関数が与えられたとき、その平行移動のグラフを描く。
1. Identify the horizontal shift: If shift the graph of left units. If shift the graph of right units.2. Draw the vertical asymptote 3. Identify three key points from the parent function. Find new coordinates for the shifted functions by subtracting from the coordinate.4. Label the three points.5. The Domain is the range is and the vertical asymptote is
1. 横の移動を見分ける。 なら のグラフを左に 単位移す。 なら のグラフを右に 単位移す。2. 垂直漸近線 を描く。3. 親関数の要点を三つ見分ける。 座標から を引いて、移した関数の新しい座標を求める。4. その三点に名前を付ける。5. 定義域は 、値域は 、垂直漸近線は である。
Example 4例4
Graphing a Horizontal Shift of the Parent Function y = logb(x)親関数 y = logb(x) を横に移したグラフを描く
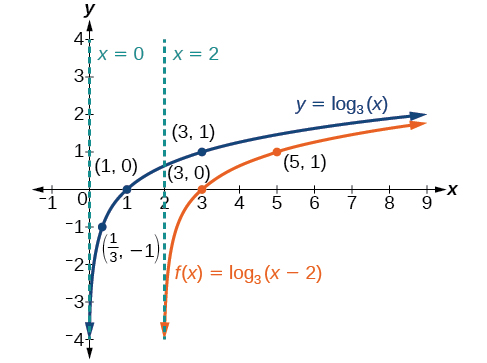
Sketch the horizontal shift alongside its parent function. Include the key points and asymptotes on the graph. State the domain, range, and asymptote.
横に移した の概形を、その親関数と並べて描け。グラフに要点と漸近線を入れよ。定義域、値域、漸近線を答えよ。
Solution 解答
Since the function is we notice
この関数は なので、 だと分かる。
Thus so This means we will shift the function right 2 units.
よって であり である。つまり関数 を右に2単位移す。
The vertical asymptote is or
垂直漸近線は 、すなわち である。
Consider the three key points from the parent function, and
親関数の三つの要点 、、 を考える。
The new coordinates are found by adding 2 to the coordinates.
座標に2を足せば、新しい座標が求まる。
Label the points and
点 、、 に名前を付ける。
The domain is the range is and the vertical asymptote is
定義域は 、値域は 、垂直漸近線は である。
Try It #4やってみよう4
Sketch a graph of alongside its parent function. Include the key points and asymptotes on the graph. State the domain, range, and asymptote.
のグラフの概形を、その親関数と並べて描け。グラフに要点と漸近線を入れよ。定義域、値域、漸近線を答えよ。
Graphing a Vertical Shift of f(x) = logb(x)f(x) = logb(x) を縦に移したグラフを描く
When a constant is added to the parent function the result is a vertical shift units in the direction of the sign on To visualize vertical shifts, we can observe the general graph of the parent function alongside the shift up, and the shift down, See Figure 8.
親関数 に定数 を足すと、 の符号の向きに 単位の縦の移動になる。縦の移動を目で見るために、親関数 の一般のグラフと、上への移動 、下への移動 を並べて見よう。図8を見よ。
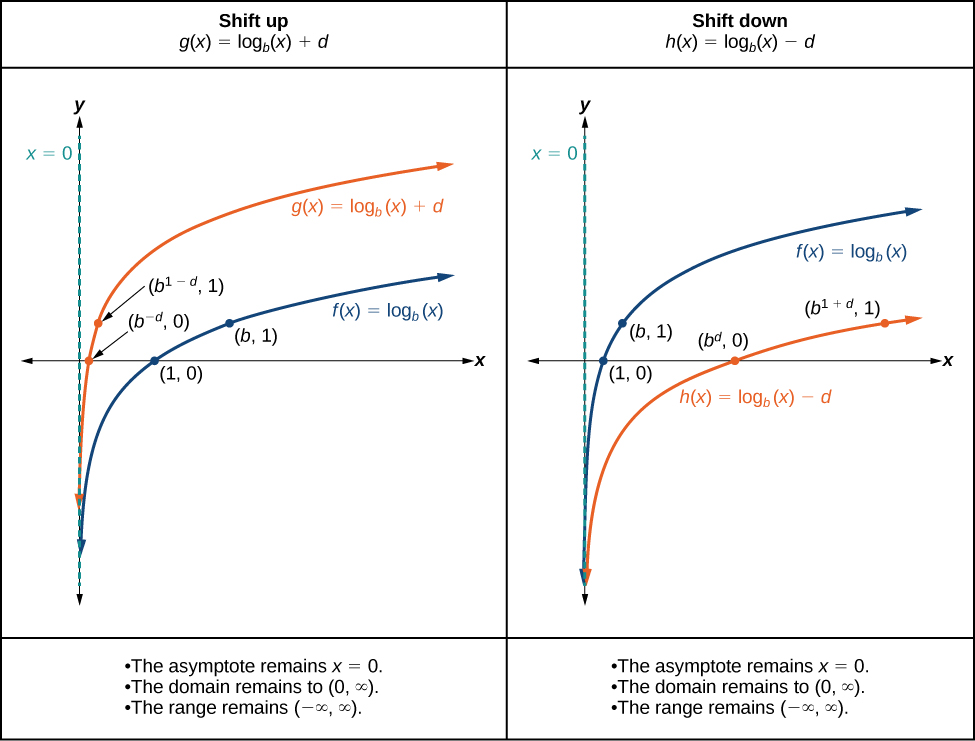
Vertical Shifts of the Parent Function 基本となるグラフの上下への平行移動
Vertical Shifts of the Parent Function 親関数 の縦の移動
For any constant the function
任意の定数 について、関数 は次のとおりである。
• shifts the parent function up units if • shifts the parent function down units if • has the vertical asymptote • has domain • has range
・ なら、親関数 を上に 単位移す。・ なら、親関数 を下に 単位移す。・垂直漸近線 を持つ。・定義域 を持つ。・値域 を持つ。
How To 手順
Given a logarithmic function with the form graph the translation.
の形の対数関数が与えられたとき、その平行移動のグラフを描く。
1. Identify the vertical shift: If shift the graph of up units. If shift the graph of down units.2. Draw the vertical asymptote 3. Identify three key points from the parent function. Find new coordinates for the shifted functions by adding to the coordinate.4. Label the three points.5. The domain is the range is and the vertical asymptote is
1. 縦の移動を見分ける。 なら のグラフを上に 単位移す。 なら のグラフを下に 単位移す。2. 垂直漸近線 を描く。3. 親関数の要点を三つ見分ける。 座標に を足して、移した関数の新しい座標を求める。4. その三点に名前を付ける。5. 定義域は 、値域は 、垂直漸近線は である。
Example 5例5
Graphing a Vertical Shift of the Parent Function f(x) = logb(x)親関数 f(x) = logb(x) を縦に移したグラフを描く
Sketch a graph of alongside its parent function. Include the key points and asymptote on the graph. State the domain, range, and asymptote.
のグラフの概形を、その親関数と並べて描け。グラフに要点と漸近線を入れよ。定義域、値域、漸近線を答えよ。
Solution 解答
Since the function is we will notice Thus
この関数は なので、 だと分かる。よって である。
This means we will shift the function down 2 units.
つまり関数 を下に2単位移す。
The vertical asymptote is
垂直漸近線は である。
Consider the three key points from the parent function, and
親関数の三つの要点 、、 を考える。
The new coordinates are found by subtracting 2 from the y coordinates.
y座標から2を引けば、新しい座標が求まる。
Label the points and
点 、、 に名前を付ける。
The domain is the range is and the vertical asymptote is
定義域は 、値域は 、垂直漸近線は である。
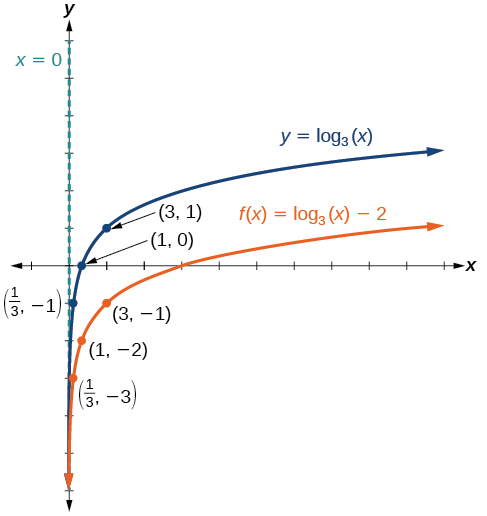
The domain is the range is and the vertical asymptote is
定義域は 、値域は 、垂直漸近線は である。
Try It #5やってみよう5
Sketch a graph of alongside its parent function. Include the key points and asymptote on the graph. State the domain, range, and asymptote.
のグラフの概形を、その親関数と並べて描け。グラフに要点と漸近線を入れよ。定義域、値域、漸近線を答えよ。
Graphing Stretches and Compressions of f(x) = logb(x)f(x) = logb(x) の伸長と圧縮のグラフを描く
When the parent function is multiplied by a constant the result is a vertical stretch or compression of the original graph. To visualize stretches and compressions, we set and observe the general graph of the parent function alongside the vertical stretch, and the vertical compression, See Figure 10.
親関数 に定数 を掛けると、元のグラフの縦の伸長または圧縮になる。伸長と圧縮を目で見るために、 とおいて、親関数 の一般のグラフと、縦の伸長 、縦の圧縮 を並べて見よう。図10を見よ。
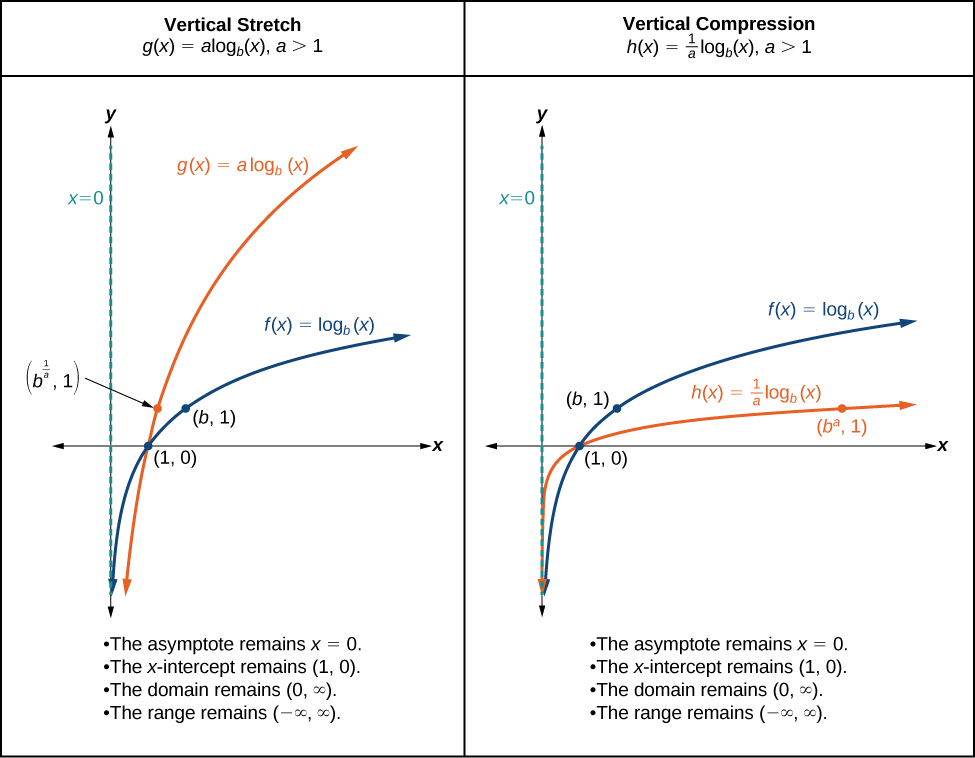
Vertical Stretches and Compressions of the Parent Function 基本となるグラフの縦方向の拡大・縮小
Vertical Stretches and Compressions of the Parent Function 親関数 の縦の伸長と圧縮
For any constant the function
任意の定数 について、関数 は次のとおりである。
• stretches the parent function vertically by a factor of if • compresses the parent function vertically by a factor of if • has the vertical asymptote • has the x-intercept • has domain • has range
・ なら、親関数 を縦に 倍に伸ばす。・ なら、親関数 を縦に 倍に縮める。・垂直漸近線 を持つ。・x切片 を持つ。・定義域 を持つ。・値域 を持つ。
How To 手順
Given a logarithmic function with the form graph the translation.
、 の形の対数関数が与えられたとき、その平行移動のグラフを描く。
1. Identify the vertical stretch or compressions: If the graph of is stretched by a factor of units. If the graph of is compressed by a factor of units.2. Draw the vertical asymptote 3. Identify three key points from the parent function. Find new coordinates for the shifted functions by multiplying the coordinates by 4. Label the three points.5. The domain is the range is and the vertical asymptote is
1. 縦の伸長か圧縮かを見分ける。 なら のグラフは 倍に伸ばされる。 なら のグラフは 倍に縮められる。2. 垂直漸近線 を描く。3. 親関数の要点を三つ見分ける。 座標に を掛けて、移した関数の新しい座標を求める。4. その三点に名前を付ける。5. 定義域は 、値域は 、垂直漸近線は である。
Example 6例6
Graphing a Stretch or Compression of the Parent Function f(x) = logb(x)親関数 f(x) = logb(x) の伸長または圧縮のグラフを描く
Sketch a graph of alongside its parent function. Include the key points and asymptote on the graph. State the domain, range, and asymptote.
のグラフの概形を、その親関数と並べて描け。グラフに要点と漸近線を入れよ。定義域、値域、漸近線を答えよ。
Solution 解答
Since the function is we will notice
この関数は なので、 だと分かる。
This means we will stretch the function by a factor of 2.
つまり関数 を2倍に伸ばす。
The vertical asymptote is
垂直漸近線は である。
Consider the three key points from the parent function, and
親関数の三つの要点 、、 を考える。
The new coordinates are found by multiplying the coordinates by 2.
座標に2を掛ければ、新しい座標が求まる。
Label the points and
点 、、 に名前を付ける。
The domain is the range is and the vertical asymptote is See Figure 11.
定義域は 、値域は 、垂直漸近線は である。図11を見よ。
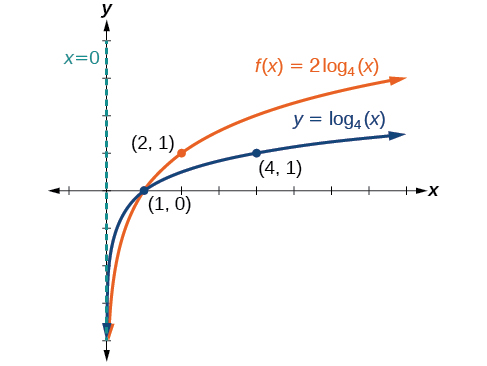
The domain is the range is and the vertical asymptote is
定義域は 、値域は 、垂直漸近線は である。
Try It #6やってみよう6
Sketch a graph of alongside its parent function. Include the key points and asymptote on the graph. State the domain, range, and asymptote.
のグラフの概形を、その親関数と並べて描け。グラフに要点と漸近線を入れよ。定義域、値域、漸近線を答えよ。
Example 7例7
Combining a Shift and a Stretch移動と伸長を組み合わせる
Sketch a graph of State the domain, range, and asymptote.
のグラフの概形を描け。定義域、値域、漸近線を答えよ。
Solution 解答
Remember: what happens inside parentheses happens first. First, we move the graph left 2 units, then stretch the function vertically by a factor of 5, as in Figure 12. The vertical asymptote will be shifted to The x-intercept will be The domain will be Two points will help give the shape of the graph: and We chose as the x-coordinate of one point to graph because when the base of the common logarithm.
覚えておこう。括弧の中で起こることが先である。まずグラフを左に2単位移し、次に図12のように関数を縦に5倍に伸ばす。垂直漸近線は に移る。x切片は になる。定義域は になる。グラフの形をつかむのに二点が役立つ。 と である。 のとき 、すなわち常用対数の底になるので、グラフに打つ点の一つの x座標に を選んだ。
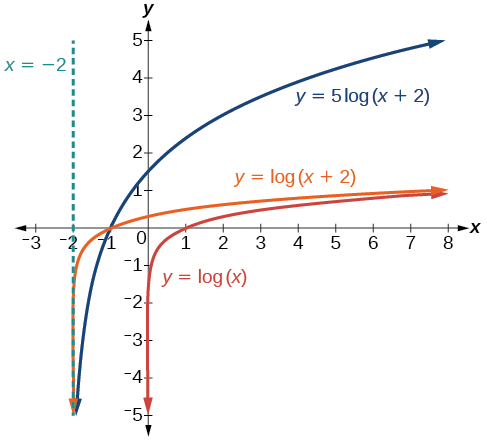
The domain is the range is and the vertical asymptote is
定義域は 、値域は 、垂直漸近線は である。
Try It #7やってみよう7
Sketch a graph of the function State the domain, range, and asymptote.
関数 のグラフの概形を描け。定義域、値域、漸近線を答えよ。
Graphing Reflections of f(x) = logb(x)f(x) = logb(x) の折り返しのグラフを描く
When the parent function is multiplied by the result is a reflection about the x-axis. When the input is multiplied by the result is a reflection about the y-axis. To visualize reflections, we restrict and observe the general graph of the parent function alongside the reflection about the x-axis, and the reflection about the y-axis,
親関数 に を掛けると、x軸に関する折り返しになる。入力に を掛けると、y軸に関する折り返しになる。折り返しを目で見るために、 に限って、親関数 の一般のグラフと、x軸に関する折り返し 、y軸に関する折り返し を並べて見よう。
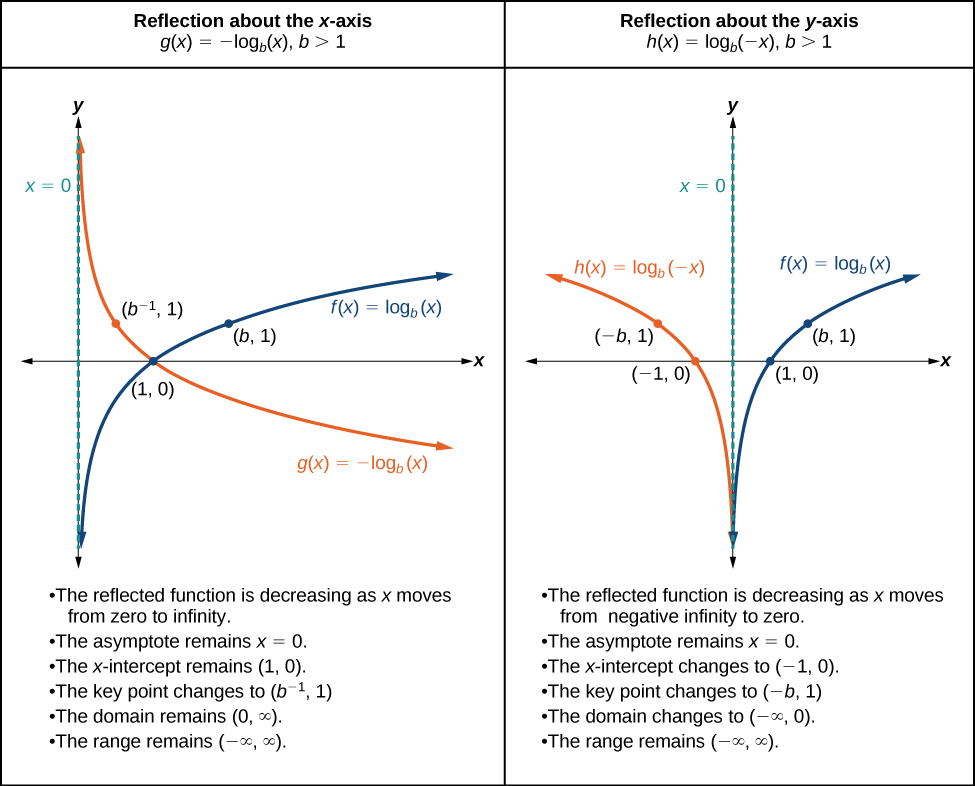
Reflections of the Parent Function 基本となるグラフの対称移動
Reflections of the Parent Function 親関数 の折り返し
The function
関数 は
• reflects the parent function about the x-axis.• has domain, range, and vertical asymptote, which are unchanged from the parent function.
・親関数 を x軸に関して折り返す。・定義域 、値域 、垂直漸近線 を持ち、これらは親関数から変わらない。
The function
関数 は
• reflects the parent function about the y-axis.• has domain • has range, and vertical asymptote, which are unchanged from the parent function.
・親関数 を y軸に関して折り返す。・定義域 を持つ。・値域 と垂直漸近線 を持ち、これらは親関数から変わらない。
How To 手順
Given a logarithmic function with the parent function graph a translation.
親関数が の対数関数が与えられたとき、その平行移動のグラフを描く。
| 1. Draw the vertical asymptote, 1. 垂直漸近線 を描く。 | 1. Draw the vertical asymptote, 1. 垂直漸近線 を描く。 |
| 2. Plot the x-intercept, 2. x切片 を打つ。 | 2. Plot the x-intercept, 2. x切片 を打つ。 |
| 3. Reflect the graph of the parent function about the x-axis.3. 親関数 のグラフを x軸に関して折り返す。 | 3. Reflect the graph of the parent function about the y-axis.3. 親関数 のグラフを y軸に関して折り返す。 |
| 4. Draw a smooth curve through the points.4. その点を通る滑らかな曲線を描く。 | 4. Draw a smooth curve through the points.4. その点を通る滑らかな曲線を描く。 |
| 5. State the domain, (0, ∞), the range, (−∞, ∞), and the vertical asymptote .5. 定義域 (0, ∞)、値域 (−∞, ∞)、垂直漸近線 を答える。 | 5. State the domain, (−∞, 0) the range, (−∞, ∞) and the vertical asymptote 5. 定義域 (−∞, 0)、値域 (−∞, ∞)、垂直漸近線 を答える。 |
Example 8例8
Graphing a Reflection of a Logarithmic Function対数関数の折り返しのグラフを描く
Sketch a graph of alongside its parent function. Include the key points and asymptote on the graph. State the domain, range, and asymptote.
のグラフの概形を、その親関数と並べて描け。グラフに要点と漸近線を入れよ。定義域、値域、漸近線を答えよ。
Solution 解答
Before graphing identify the behavior and key points for the graph.
のグラフを描く前に、ふるまいとグラフの要点を見分ける。
• Since is greater than one, we know that the parent function is increasing. Since the input value is multiplied by is a reflection of the parent graph about the y-axis. Thus, will be decreasing as moves from negative infinity to zero, and the right tail of the graph will approach the vertical asymptote • The x-intercept is • We draw and label the asymptote, plot and label the points, and draw a smooth curve through the points.
・ は1より大きいので、親関数は増加すると分かる。入力値に が掛かっているので、 は親のグラフを y軸に関して折り返したものである。したがって は、 が負の無限大から0へ動くにつれて減少し、グラフの右の裾は垂直漸近線 に近づく。・x切片は である。・漸近線を描いて名前を付け、点を打って名前を付け、その点を通る滑らかな曲線を描く。
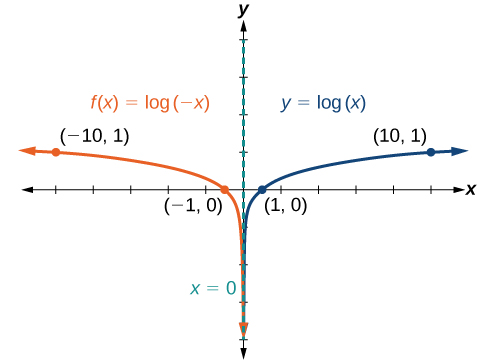
The domain is the range is and the vertical asymptote is
定義域は 、値域は 、垂直漸近線は である。
Try It #8やってみよう8
Graph State the domain, range, and asymptote.
のグラフを描け。定義域、値域、漸近線を答えよ。
How To 手順
Given a logarithmic equation, use a graphing calculator to approximate solutions.
対数の方程式が与えられたとき、グラフ電卓を使って解を近似する。
1. Press [Y=]. Enter the given logarithm equation or equations as Y1= and, if needed, Y2=.2. Press [GRAPH] to observe the graphs of the curves and use [WINDOW] to find an appropriate view of the graphs, including their point(s) of intersection.3. To find the value of we compute the point of intersection. Press [2ND] then [CALC]. Select “intersect” and press [ENTER] three times. The point of intersection gives the value of for the point(s) of intersection.
1. [Y=] を押す。与えられた対数の式を Y1=、必要なら Y2= として入れる。2. [GRAPH] を押して曲線のグラフを見る。[WINDOW] を使って、交点を含む適切な見え方になるよう調える。3. の値を求めるために、交点を計算する。[2ND] を押してから [CALC] を押す。「intersect」を選び、[ENTER] を3回押す。交点が、その交点における の値を与える。
Example 9例9
Approximating the Solution of a Logarithmic Equation対数の方程式の解を近似する
Solve graphically. Round to the nearest thousandth.
をグラフで解け。小数第三位まで丸めよ。
Solution 解答
Press [Y=] and enter next to Y1=. Then enter next to Y2=. For a window, use the values 0 to 5 for and –10 to 10 for Press [GRAPH]. The graphs should intersect somewhere a little to right of
[Y=] を押し、Y1= の隣に を入れる。次に Y2= の隣に を入れる。表示範囲は、 に0から5、 に–10から10を使う。[GRAPH] を押す。二つのグラフは の少し右のどこかで交わるはずである。
For a better approximation, press [2ND] then [CALC]. Select [5: intersect] and press [ENTER] three times. The x-coordinate of the point of intersection is displayed as 1.3385297. (Your answer may be different if you use a different window or use a different value for Guess?) So, to the nearest thousandth,
より良い近似を得るには、[2ND] を押してから [CALC] を押す。[5: intersect] を選び、[ENTER] を3回押す。交点の x座標が1.3385297と表示される。(違う表示範囲を使ったり、Guess? に違う値を使ったりすると、答えが違うことがある。)よって小数第三位まで求めると である。
Try It #9やってみよう9
Solve graphically. Round to the nearest thousandth.
をグラフで解け。小数第三位まで丸めよ。
Summarizing Translations of the Logarithmic Function対数関数の平行移動をまとめる
Now that we have worked with each type of translation for the logarithmic function, we can summarize each in Table 4 to arrive at the general equation for translating exponential functions.
対数関数の平行移動の種類をひととおり扱ったので、表4にまとめて、指数関数を平行移動する一般の式にたどりつこう。
| Transformations of the Parent Function 親関数 の変形 | |
|---|---|
| Transformation変形 | Form形 |
| Shift Horizontally units to the left Vertically units up移動 横に左へ 単位 縦に上へ 単位 | |
| Stretch and Compress Stretch if Compression if 伸長と圧縮 なら伸長 なら圧縮 | |
| Reflect about the x-axisx軸に関する折り返し | |
| Reflect about the y-axisy軸に関する折り返し | |
| General equation for all translationsすべての平行移動をまとめた一般の式 | |
Transformations of Logarithmic Functions 対数関数のグラフの変換
All transformations of the parent logarithmic function, have the form
親の対数関数 の変形はすべて、次の形をとる。
where the parent function, is
ここで親関数 は
• shifted vertically up units.• shifted horizontally to the left units.• stretched vertically by a factor of if • compressed vertically by a factor of if • reflected about the x-axis when
・縦に上へ 単位移される。・横に左へ 単位移される。・ なら縦に 倍に伸ばされる。・ なら縦に 倍に縮められる。・ のとき x軸に関して折り返される。
For the graph of the parent function is reflected about the y-axis.
のとき、親関数のグラフは y軸に関して折り返される。
Example 10例10
Finding the Vertical Asymptote of a Logarithm Graph対数のグラフの垂直漸近線を求める
What is the vertical asymptote of
の垂直漸近線は何か。
Solution 解答
The vertical asymptote is at
垂直漸近線は にある。
Analysis 考察
The coefficient, the base, and the upward translation do not affect the asymptote. The shift of the curve 4 units to the left shifts the vertical asymptote to
係数、底、上への平行移動は漸近線に影響しない。曲線を左に4単位移すと、垂直漸近線は に移る。
Try It #10やってみよう10
What is the vertical asymptote of
の垂直漸近線は何か。
Example 11例11
Finding the Equation from a Graphグラフから式を求める
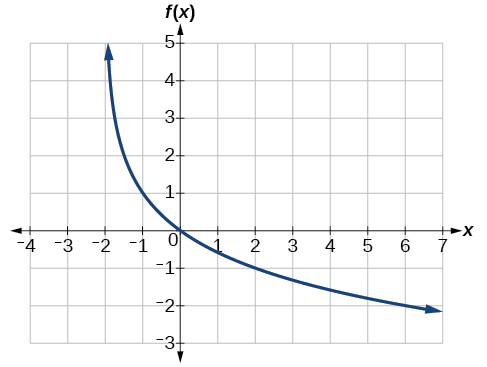
Find a possible equation for the common logarithmic function graphed in Figure 15.
図15にグラフを描いた常用対数の関数について、ありうる式を一つ求めよ。
Solution 解答
This graph has a vertical asymptote at and has been vertically reflected. We do not know yet the vertical shift or the vertical stretch. We know so far that the equation will have form:
このグラフは に垂直漸近線を持ち、縦に折り返されている。縦の移動と縦の伸長はまだ分からない。ここまでで、式が次の形になることは分かる。
It appears the graph passes through the points and Substituting
グラフは点 と を通るように見える。 を代入すると、次のようになる。
Next, substituting in ,
次に を代入すると、
This gives us the equation
これで式 が得られる。
Try It #11やってみよう11
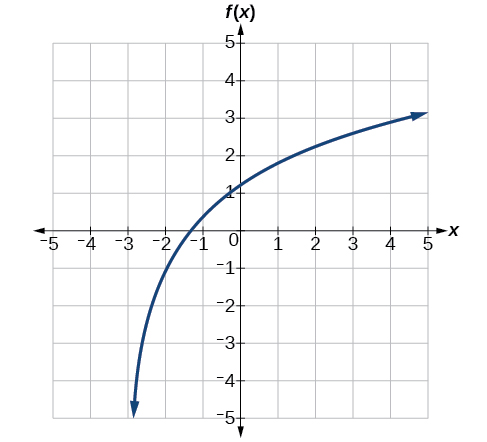
Give the equation of the natural logarithm graphed in Figure 16.
図16にグラフを描いた自然対数の式を答えよ。
Q&A 疑問と答え
Is it possible to tell the domain and range and describe the end behavior of a function just by looking at the graph?
グラフを見るだけで、関数の定義域と値域を言い当て、端のふるまいを述べられるか。
Yes, if we know the function is a general logarithmic function. For example, look at the graph in Figure 16. The graph approaches (or thereabouts) more and more closely, so is, or is very close to, the vertical asymptote. It approaches from the right, so the domain is all points to the right, The range, as with all general logarithmic functions, is all real numbers. And we can see the end behavior because the graph goes down as it goes left and up as it goes right. The end behavior is that as and as
その関数が一般の対数関数だと分かっているなら、できる。たとえば図16のグラフを見よ。グラフは (あるいはその近く)にどんどん近づいているので、 が垂直漸近線であるか、それにきわめて近い。右から近づいているので、定義域は右側の点すべて である。値域は、すべての一般の対数関数と同じく実数全体である。そして、グラフが左へ行くと下がり、右へ行くと上がるので、端のふるまいも見てとれる。端のふるまいは、 となり、 となることである。
Media 教材
Access these online resources for additional instruction and practice with graphing logarithms.
対数のグラフを描くことについての説明と練習をさらに求めるなら、次のオンライン教材にあたるとよい。
• Graph an Exponential Function and Logarithmic Function• Match Graphs with Exponential and Logarithmic Functions• Find the Domain of Logarithmic Functions
・指数関数と対数関数のグラフを描く・グラフを指数関数・対数関数に対応させる・対数関数の定義域を求める
Verbal言葉で答える問題
2. What type(s) of translation(s), if any, affect the range of a logarithmic function?
2. 対数関数の値域に影響する平行移動の種類があるとすれば、それはどれか。
4. Consider the general logarithmic function Why can’t be zero?
4. 一般の対数関数 を考えよ。 が0になれないのはなぜか。
Algebraic代数の問題
For the following exercises, state the domain and range of the function.
次の各問について、その関数の定義域と値域を答えよ。
For the following exercises, state the domain and the vertical asymptote of the function.
次の各問について、その関数の定義域と垂直漸近線を答えよ。
For the following exercises, state the domain, vertical asymptote, and end behavior of the function.
次の各問について、その関数の定義域、垂直漸近線、端のふるまいを答えよ。
For the following exercises, state the domain, range, and x- and y-intercepts, if they exist. If they do not exist, write DNE.
次の各問について、定義域、値域、そして x切片と y切片があればそれを答えよ。無ければ DNE と書け。
Graphicalグラフの問題
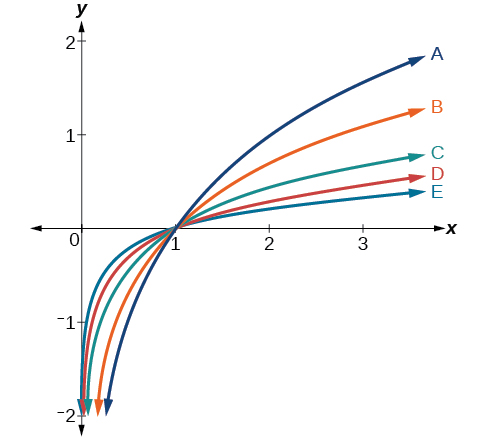
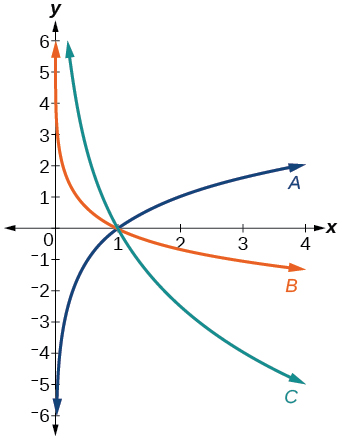
For the following exercises, match each function in Figure 17 with the letter corresponding to its graph.
次の各問について、図17の各関数を、そのグラフに対応する記号に結びつけよ。
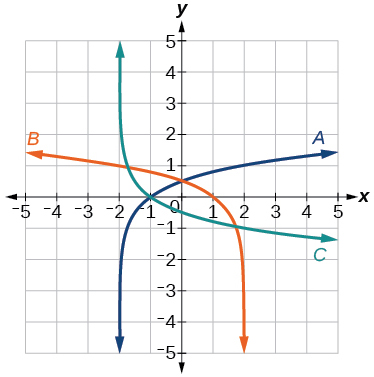
For the following exercises, match each function in Figure 18 with the letter corresponding to its graph.
次の各問について、図18の各関数を、そのグラフに対応する記号に結びつけよ。
For the following exercises, sketch the graphs of each pair of functions on the same axis.
次の各問について、各組の関数のグラフの概形を同じ座標軸に描け。
34. and
34. と
36. and
36. と
For the following exercises, match each function in Figure 19 with the letter corresponding to its graph.
次の各問について、図19の各関数を、そのグラフに対応する記号に結びつけよ。
For the following exercises, sketch the graph of the indicated function.
次の各問について、指定された関数のグラフの概形を描け。
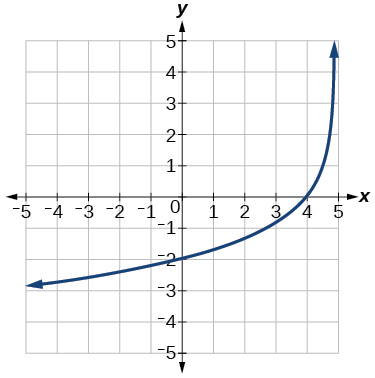
For the following exercises, write a logarithmic equation corresponding to the graph shown.
次の各問について、示されたグラフに対応する対数の式を書け。
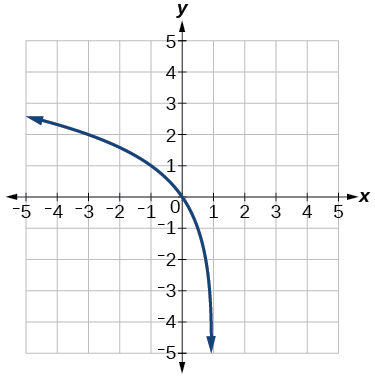
48. Use as the parent function.
48. を親関数とせよ。
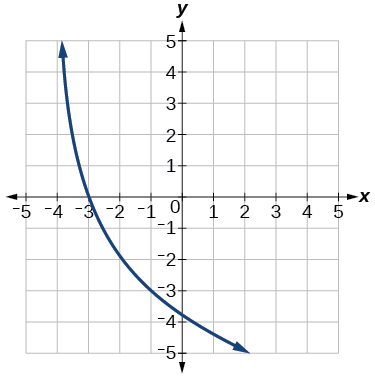
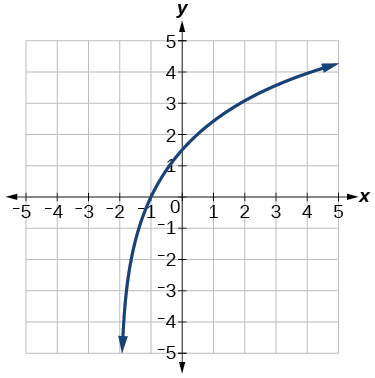
50. Use as the parent function.
50. を親関数とせよ。
Technology機器を使う問題
For the following exercises, use a graphing calculator to find approximate solutions to each equation.
次の各問について、グラフ電卓を使って各方程式の近似の解を求めよ。
Extensions発展問題
56. Let be any positive real number such that What must be equal to? Verify the result.
56. を満たす任意の正の実数を とする。 は何に等しくなければならないか。結果を確かめよ。
58. Prove the conjecture made in the previous exercise.
58. 前問で立てた予想を証明せよ。
60. Use properties of exponents to find the x-intercepts of the function algebraically. Show the steps for solving, and then verify the result by graphing the function.
60. 指数の性質を使って、関数 の x切片を代数的に求めよ。解く手順を示し、それからその関数のグラフを描いて結果を確かめよ。