第6章指数関数と対数関数Exponential and Logarithmic Functions
Graphing Exponential Functions指数関数のグラフを描く
Before we begin graphing, it is helpful to review the behavior of exponential growth. Recall the table of values for a function of the form whose base is greater than one. We’ll use the function Observe how the output values in Table 1 change as the input increases by
グラフを描き始める前に、指数的な増加のふるまいを振り返っておくと役立つ。底が1より大きい の形の関数の値の表を思い出そう。関数 を使う。入力が ずつ増えるとき、表1の出力値がどう変わるかに注目しよう。
Each output value is the product of the previous output and the base, We call the base the constant ratio. In fact, for any exponential function with the form is the constant ratio of the function. This means that as the input increases by 1, the output value will be the product of the base and the previous output, regardless of the value of
どの出力値も、前の出力と底 の積である。底 を一定の比と呼ぶ。実際、 の形のどの指数関数でも、 がその関数の一定の比である。つまり、 の値がいくつであろうと、入力が1増えると出力値は底と前の出力の積になる。
Notice from the table that
この表から、次のことに注目しよう。
• the output values are positive for all values of • as increases, the output values increase without bound; and• as decreases, the output values grow smaller, approaching zero.
・ のどの値についても出力値は正である。・ が増えると、出力値は限りなく大きくなる。・ が減ると、出力値は小さくなり、0に近づく。
Figure 1 shows the exponential growth function
図1は指数的な増加の関数 を示している。
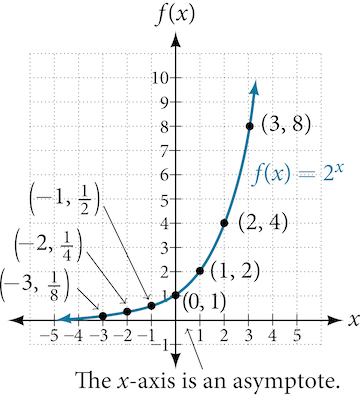
The domain of is all real numbers, the range is and the horizontal asymptote is
の定義域は実数全体、値域は 、水平漸近線は である。
To get a sense of the behavior of exponential decay, we can create a table of values for a function of the form whose base is between zero and one. We’ll use the function Observe how the output values in Table 2 change as the input increases by
指数的な減少のふるまいをつかむために、底が0と1のあいだにある の形の関数の値の表を作れる。関数 を使う。入力が ずつ増えるとき、表2の出力値がどう変わるかに注目しよう。
Again, because the input is increasing by 1, each output value is the product of the previous output and the base, or constant ratio
ここでも入力が1ずつ増えるので、どの出力値も前の出力と底、すなわち一定の比 の積である。
Notice from the table that
この表から、次のことに注目しよう。
• the output values are positive for all values of • as increases, the output values grow smaller, approaching zero; and• as decreases, the output values grow without bound.
・ のどの値についても出力値は正である。・ が増えると、出力値は小さくなり、0に近づく。・ が減ると、出力値は限りなく大きくなる。
Figure 2 shows the exponential decay function,
図2は指数的な減少の関数 を示している。
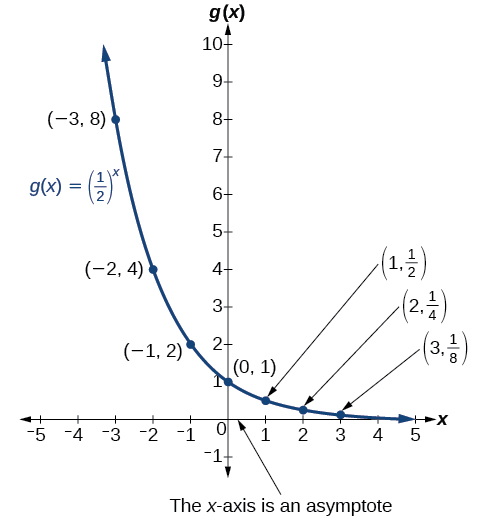
The domain of is all real numbers, the range is and the horizontal asymptote is
の定義域は実数全体、値域は 、水平漸近線は である。
Characteristics of the Graph of the Parent Function 基本となる関数のグラフの特徴
Characteristics of the Graph of the Parent Function 親関数 のグラフの特徴
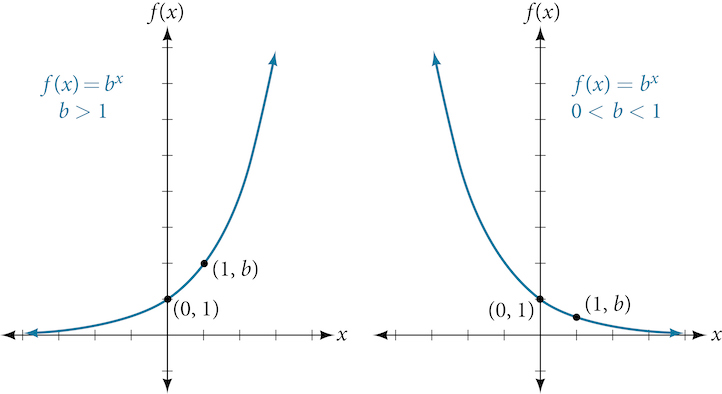
An exponential function with the form has these characteristics:
、、 の形の指数関数は、次の特徴を持つ。
• one-to-one function• horizontal asymptote: • domain: • range: • x-intercept: none• y-intercept: • increasing if • decreasing if
・一対一の関数・水平漸近線: ・定義域: ・値域: ・x切片: 無し・y切片: ・ なら増加する・ なら減少する
Figure 3 compares the graphs of exponential growth and decay functions.
図3は、指数的な増加の関数と減少の関数のグラフを比べている。
How To 手順
Given an exponential function of the form graph the function.
の形の指数関数が与えられたとき、その関数のグラフを描く。
1. Create a table of points.2. Plot at least point from the table, including the y-intercept 3. Draw a smooth curve through the points.4. State the domain, the range, and the horizontal asymptote,
1. 点の表を作る。2. y切片 を含めて、表から少なくとも 点を打つ。3. その点を通る滑らかな曲線を描く。4. 定義域 、値域 、水平漸近線 を答える。
Example 1例1
Sketching the Graph of an Exponential Function of the Form f(x) = bxf(x) = bx の形の指数関数のグラフの概形を描く
Sketch a graph of State the domain, range, and asymptote.
のグラフの概形を描け。定義域、値域、漸近線を答えよ。
Solution 解答
Before graphing, identify the behavior and create a table of points for the graph.
グラフを描く前に、ふるまいを見分け、グラフのための点の表を作る。
• Since is between zero and one, we know the function is decreasing. The left tail of the graph will increase without bound, and the right tail will approach the asymptote • Create a table of points as in Table 3. Table 3• Plot the y-intercept, along with two other points. We can use and
・ は0と1のあいだなので、この関数は減少すると分かる。グラフの左の裾は限りなく増え、右の裾は漸近線 に近づく。・表3のように点の表を作る。 表3・y切片 と、ほかに二点を打つ。 と が使える。
Draw a smooth curve connecting the points as in Figure 4.
図4のように、その点をつなぐ滑らかな曲線を描く。
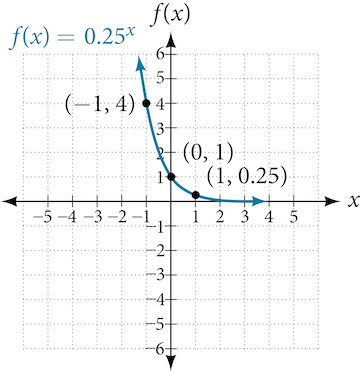
The domain is the range is the horizontal asymptote is
定義域は 、値域は 、水平漸近線は である。
Try It #1やってみよう1
Sketch the graph of State the domain, range, and asymptote.
のグラフの概形を描け。定義域、値域、漸近線を答えよ。