第7章思考と知能
The Bell Curveベル曲線
The results of intelligence tests follow the bell curve, a graph in the general shape of a bell. When the bell curve is used in psychological testing, the graph demonstrates a normal distribution of a trait, in this case, intelligence, in the human population. Many human traits naturally follow the bell curve. For example, if you lined up all your female schoolmates according to height, it is likely that a large cluster of them would be the average height for an American woman: 5’4”–5’6”. This cluster would fall in the center of the bell curve, representing the average height for American women (Figure 7.14). There would be fewer women who stand closer to 4’11”. The same would be true for women of above-average height: those who stand closer to 5’11”. The trick to finding a bell curve in nature is to use a large sample size. Without a large sample size, it is less likely that the bell curve will represent the wider population. A representative sample is a subset of the population that accurately represents the general population. If, for example, you measured the height of the women in your classroom only, you might not actually have a representative sample. Perhaps the women’s basketball team wanted to take this course together, and they are all in your class. Because basketball players tend to be taller than average, the women in your class may not be a good representative sample of the population of American women. But if your sample included all the women at your school, it is likely that their heights would form a natural bell curve.
英語のヒント
知能検査の結果はベル曲線に従う。ベル曲線とは、全体としてベル(釣り鐘)のような形をしたグラフである。ベル曲線を心理検査で用いるとき、そのグラフは、人間の母集団におけるある特性、この場合は知能の正規分布を示す。人間の特性の多くは、自然にベル曲線に従う。たとえば、学校の女子の同級生全員を身長順に並べたとすると、その多くがアメリカ人女性の平均身長である5フィート4インチ〜5フィート6インチに集まる可能性が高い。この集まりはベル曲線の中央に位置し、アメリカ人女性の平均身長を表すことになる(図7.14)。4フィート11インチに近い女性は、それより少ないだろう。平均より背の高い女性、つまり5フィート11インチに近い女性についても同じことが言える。自然界でベル曲線を見つけるこつは、大きな標本サイズを用いることである。標本サイズが大きくなければ、ベル曲線がより広い母集団を表す可能性は低くなる。代表標本とは、一般の母集団を正確に代表する、母集団の部分集合である。たとえば、自分の教室の女性の身長だけを測ったとしたら、実際には代表標本になっていないかもしれない。もしかすると、女子バスケットボール部がそろってこの授業を取りたがり、全員があなたのクラスにいるのかもしれない。バスケットボール選手は平均より背が高い傾向があるので、あなたのクラスの女性は、アメリカ人女性という母集団のよい代表標本にならないかもしれない。しかし、標本に学校の女性全員を含めれば、その身長は自然なベル曲線を描く可能性が高い。
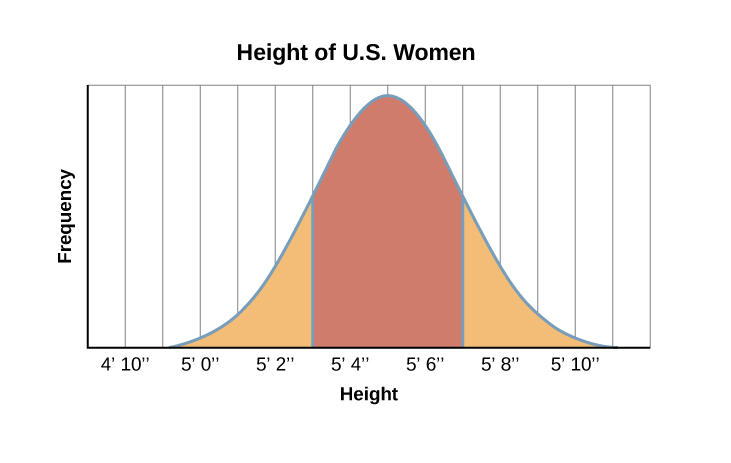
Figure 7.14図 7.14
Are you of below-average, average, or above-average height?
あなたの身長は平均より低いか、平均的か、それとも平均より高いか。
The same principles apply to intelligence tests scores. Individuals earn a score called an intelligence quotient (IQ). Over the years, different types of IQ tests have evolved, but the way scores are interpreted remains the same. On most IQ tests, the average (or mean) IQ score is 100. Standard deviations describe how data are dispersed in a population and give context to large data sets. The bell curve uses the standard deviation to show how all scores are dispersed from the average score (Figure 7.15). In modern IQ testing, one standard deviation is 15 points. So a score of 85 would be described as “one standard deviation below the mean.” How would you describe a score of 115 and a score of 70? Any IQ score that falls within one standard deviation above and below the mean (between 85 and 115) is considered average, and 68% of the population has IQ scores in this range. An IQ score of 130 or above is considered a superior level.
英語のヒント
同じ原理が知能検査の得点にも当てはまる。個人は、知能指数(IQ)と呼ばれる得点を得る。長年のうちにさまざまな種類のIQテストが生まれてきたが、得点の解釈の仕方は変わっていない。ほとんどのIQテストでは、IQ得点の平均(平均値)は100である。標準偏差は、母集団の中でデータがどのように散らばっているかを表し、大きなデータの集まりを読み取る手がかりを与える。ベル曲線は標準偏差を用いて、すべての得点が平均得点からどのように散らばっているかを示す(図7.15)。現代のIQテストでは、1標準偏差は15点である。したがって、85点は「平均値より1標準偏差下」と表される。では、115点と70点はどう表せばよいだろうか。平均値の上下1標準偏差の範囲(85〜115)に入るIQ得点はすべて平均的とみなされ、母集団の68%がこの範囲のIQ得点を持つ。IQ得点が130以上であれば、優れた水準とみなされる。
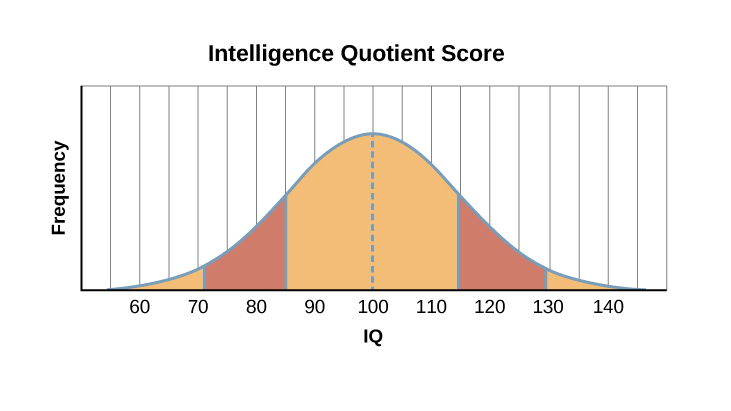


Figure 7.15図 7.15
The majority of people have an IQ score between 85 and 115.
大多数の人のIQ得点は85から115のあいだにある。
Only 2.2% of the population has an IQ score below 70 (American Psychiatric Association [APA], 2013). If a person earns a score approximately two standard deviations below the mean on an intelligence test, (about 70 on a test with a mean of 100), has major deficits in adaptive functioning, and these cognitive and adaptive deficits were present before the age of 18, they could be diagnosed as having an intellectual disability (ID). Formerly known as mental retardation, the accepted term now is intellectual disability, and it has four subtypes: mild, moderate, severe, and profound (Table 7.4). The Diagnostic and Statistical Manual of Psychological Disorders lists criteria for each subgroup (APA, 2013).
英語のヒント
IQ得点が70未満の人は、母集団のわずか2.2%である(American Psychiatric Association [APA], 2013)。ある人が知能検査で平均値よりおよそ2標準偏差低い得点(平均値が100の検査ではおよそ70)を取り、適応機能に大きな欠陥があり、しかもこうした認知と適応の欠陥が18歳より前から存在していた場合、その人は知的障害(ID)があると診断されうる。以前は精神遅滞として知られていたが、現在受け入れられている用語は知的障害であり、軽度、中等度、重度、最重度の四つの下位分類がある(表7.4)。『精神疾患の診断・統計マニュアル』は、それぞれの下位分類の基準を挙げている(APA, 2013)。
Characteristics of Cognitive Disorders 認知障害の特徴 |
||
|---|---|---|
Intellectual Disability Subtype 知的障害の下位分類 |
Percentage of Subtype within Population of Individuals with Intellectual Disabilities 知的障害のある人全体に占める下位分類の割合 |
Description 説明 |
Mild 軽度 |
85% |
3rd- to 6th-grade skill level in reading, writing, and math; may be employed and live independently 読み・書き・算数の技能が小学3〜6年生の水準。就労し、自立して生活できる場合もある |
Moderate 中等度 |
10% |
Basic reading and writing skills; functional self-care skills; requires some oversight 基本的な読み書きの技能。身の回りのことを自分でする実用的な技能。ある程度の見守りを要する |
Severe 重度 |
5% |
Functional self-care skills; requires oversight of daily environment and activities 身の回りのことを自分でする実用的な技能。日常の環境と活動に見守りを要する |
Profound 最重度 |
<1% |
May be able to communicate verbally or nonverbally; requires intensive oversight 言葉で、または言葉以外の手段で意思を伝えられる場合がある。手厚い見守りを要する |
On the other end of the intelligence spectrum are those individuals whose IQs fall into the highest ranges. Consistent with the bell curve, about 2% of the population falls into this category. People are considered to have a higher aptitude for learning (and may be classified as "gifted" within educational systems) if they have an IQ score of 130 or higher, or superior intelligence in a particular area. Long ago, popular belief suggested that people of high intelligence were maladjusted. This idea was disproven through a groundbreaking study of these children. In 1921, Lewis Terman began a longitudinal study of over 1500 children with IQs over 135 (Terman, 1925). His findings showed that these children became well-educated, successful adults who were, in fact, well-adjusted (Terman & Oden, 1947). Additionally, Terman’s study showed that the subjects were above average in physical build and attractiveness, dispelling an earlier popular notion that highly intelligent people were “weaklings.” Some people with very high IQs elect to join Mensa, an organization dedicated to identifying, researching, and fostering intelligence. Members must have an IQ score in the top 2% of the population, and they may be required to pass other exams in their application to join the group.
英語のヒント
知能の分布のもう一方の端には、IQが最も高い範囲に入る人々がいる。ベル曲線のとおり、母集団のおよそ2%がこの区分に入る。IQ得点が130以上であるか、特定の領域で優れた知能を持っている場合、その人は学習への適性が高いとみなされる(教育制度の中では「ギフテッド」に分類されることもある)。かつては、知能の高い人は不適応を起こしている、と世間一般に信じられていた。この考えは、こうした子どもたちについての画期的な研究によって誤りだと証明された。1921年、ルイス・ターマンは、IQが135を超える1500人以上の子どもを対象とした縦断的研究を始めた(Terman, 1925)。その結果、これらの子どもたちは十分な教育を受けて成功した大人になり、実際によく適応していたことが示された(Terman & Oden, 1947)。さらにターマンの研究では、対象者たちが体格と魅力の点で平均を上回っていたことも示され、知能の高い人は「ひ弱」だという以前からの通念が払拭された。非常に高いIQを持つ人の中には、知能を見いだし、研究し、育むことを目的とする団体メンサに入ることを選ぶ人もいる。会員は母集団の上位2%に入るIQ得点を持っていなければならず、入会を申し込む際には、ほかの試験に合格するよう求められることもある。