第1章物理学とは何かWhat is Physics?原書 p.5–54
Accuracy, Precision and Significant Figures正確さ、精密さ、有効数字
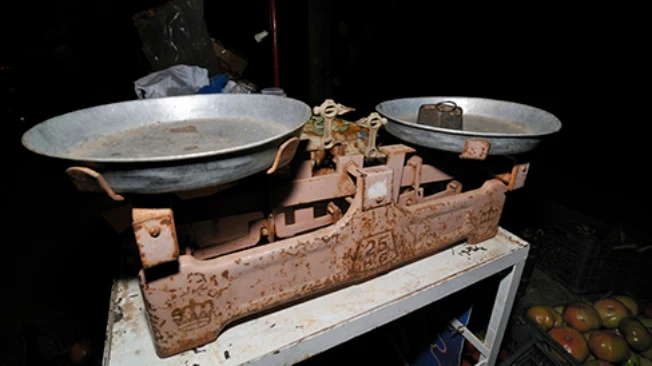
27Science is based on experimentation that requires good measurements. The validity of a measurement can be described in terms of its accuracy and its precision (see Figure 1.19 and Figure 1.20). Accuracy is how close a measurement is to the correct value for that measurement. For example, let us say that you are measuring the length of standard piece of printer paper. The packaging in which you purchased the paper states that it is 11 inches long, and suppose this stated value is correct. You measure the length of the paper three times and obtain the following measurements: 11.1 inches, 11.2 inches, and 10.9 inches. These measurements are quite accurate because they are very close to the correct value of 11.0 inches. In contrast, if you had obtained a measurement of 12 inches, your measurement would not be very accurate. This is why measuring instruments are calibrated based on a known measurement. If the instrument consistently returns the correct value of the known measurement, it is safe for use in finding unknown values.
科学は、よい測定を必要とする実験の上に立っている。測定の確からしさは、正確さと精密さによって述べられる(図1.19と図1.20を見よ)。正確さとは、測定値が正しい値にどれだけ近いかである。たとえば、標準的なプリンタ用紙の長さを測っているとしよう。買ったときの包装には長さ11インチと書いてあり、この表示値は正しいとする。あなたが紙の長さを3回測って、11.1インチ、11.2インチ、10.9インチという測定値を得たとする。これらの測定は、正しい値11.0インチにとても近いので、かなり正確である。これに対して12インチという測定値を得ていたら、その測定はあまり正確ではないことになる。測定器を既知の測定値にもとづいて校正するのはこのためである。既知の量に対してその器械が正しい値をいつも返すなら、未知の値を求めるのに使って安全だといえる。
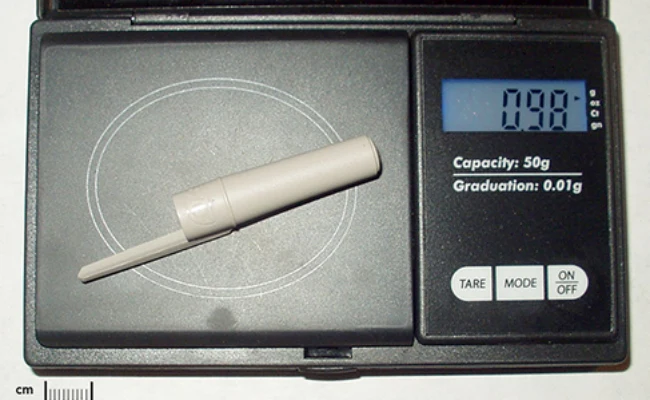
Precision states how well repeated measurements of something generate the same or similar results. Therefore, the precision of measurements refers to how close together the measurements are when you measure the same thing several times. One way to analyze the precision of measurements would be to determine the range, or difference between the lowest and the highest measured values. In the case of the printer paper measurements, the lowest value was 10.9 inches and the highest value was 11.2 inches. Thus, the measured values deviated from each other by, at most, 0.3 inches. These measurements were reasonably precise because they varied by only a fraction of an inch. However, if the measured values had been 10.9 inches, 11.1 inches, and 11.9 inches, then the measurements would not be very precise because there is a lot of variation from one measurement to another.
精密さとは、同じものを繰り返し測ったときに、どれだけ同じような結果が出るかを表す。したがって測定の精密さとは、同じものを何度か測ったときに測定値どうしがどれだけ近いか、ということである。測定の精密さを分析する一つの方法は、範囲、すなわち最小の測定値と最大の測定値の差を求めることである。プリンタ用紙の測定では、最小値が10.9インチ、最大値が11.2インチだった。したがって測定値どうしの食い違いは最大でも0.3インチである。1インチのごく一部しかばらついていないので、これらの測定はそれなりに精密だった。しかし測定値が10.9インチ、11.1インチ、11.9インチだったなら、測定ごとのばらつきが大きいので、あまり精密ではないことになる。
The measurements in the paper example are both accurate and precise, but in some cases, measurements are accurate but not precise, or they are precise but not accurate. Let us consider a GPS system that is attempting to locate the position of a restaurant in a city. Think of the restaurant location as existing at the center of a bull’s-eye target. Then think of each GPS attempt to locate the restaurant as a black dot on the bull’s eye.
紙の例の測定は正確でも精密でもあるが、正確だが精密でない場合や、精密だが正確でない場合もある。ある町でレストランの位置を突き止めようとしているGPSを考えよう。レストランの位置を的の中心にあるものと思ってほしい。そしてGPSがレストランを突き止めようとする試みの一つ一つを、的の上の黒い点だと考える。
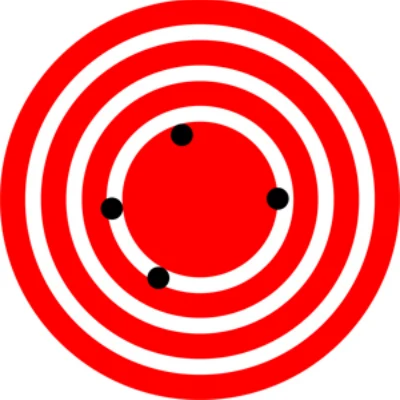
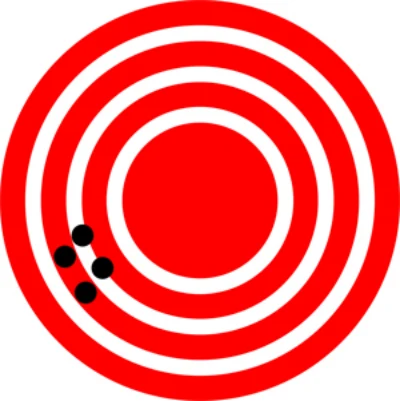
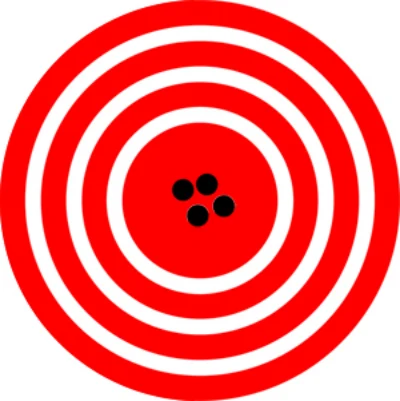
In Figure 1.21, you can see that the GPS measurements are spread far apart from each other, but they are all relatively close to the actual location of the restaurant at the center of the target. This indicates a low precision, high accuracy measuring system. However, in Figure 1.22, the GPS measurements are concentrated quite closely to one another, but they are far away from the target location. This indicates a high precision, low accuracy measuring system. Finally, in Figure 1.23, the GPS is both precise and accurate, allowing the restaurant to be located.
図1.21では、GPSの測定値どうしは大きく散らばっているが、どれも的の中心にあるレストランの実際の位置に比較的近い。これは精密さが低く正確さが高い測定系を示している。一方、図1.22ではGPSの測定値どうしはかなり密集しているが、的の位置からは遠く離れている。これは精密さが高く正確さが低い測定系を示している。最後に図1.23では、GPSは精密でも正確でもあり、レストランを突き止められている。
Uncertainty The accuracy and precision of a measuring system determine the uncertainty of its measurements. Uncertainty is a way to describe your confidence in your measured value, or the range of values that would be consistent with the data. If your measurements are not very accurate or precise, then the uncertainty of your values will be very high. In more general terms, uncertainty can be thought of as a disclaimer for your measured values. For example, if someone asked you to provide the mileage on your car, you might say that it is 45,000 miles, plus or minus 500 miles. The plus or minus amount is the uncertainty in your value. That is, you are indicating that the actual mileage of your car might be as low as 44,500 miles or as high as 45,500 miles, or anywhere in between. All measurements contain some amount of uncertainty. In our example of measuring the length of the paper, we might say that the length of the paper is 11 inches plus or minus 0.2 inches or 11.0 ± 0.2 inches. The uncertainty in a measurement, A, is often denoted as δA ("delta A"). The actual value of the object may not be within the range given by the measurement and its uncertainty. In our paper length example above, a new set of measurements might produce a length of 14.0 ± 0.2 inches, with the uncertainty based on the accuracy or our reading or repeated measurements. We would also, however, conclude that either one of our measurement sets is incorrect due to an offset in the measurement process in that set, or our measurement correctly identifies that we are measuring different papers. In the former case, the discrepancy between the measured value and the actual value is called a systematic error.
不確かさ 測定系の正確さと精密さが、その測定の不確かさを決める。不確かさとは、測定値に対する自信の度合い、言い換えればデータと矛盾しない値の範囲を表す言い方である。測定があまり正確でも精密でもなければ、値の不確かさはとても大きくなる。もっと一般的に言えば、不確かさは測定値に付ける但し書きだと考えればよい。たとえば車の走行距離を尋ねられたら、45,000マイル、プラスマイナス500マイル、と答えるかもしれない。このプラスマイナスの量が、値の不確かさである。つまり、車の実際の走行距離は44,500マイルほど少ないかもしれないし、45,500マイルほど多いかもしれないし、その間のどこかかもしれない、と言っているのだ。あらゆる測定には何らかの不確かさが含まれている。紙の長さを測った例なら、紙の長さは11インチプラスマイナス0.2インチ、すなわち11.0 ± 0.2インチである、と言える。測定値Aの不確かさは、しばしばδA(「デルタA」)と書かれる。対象の実際の値が、測定値とその不確かさが与える範囲に入っていないこともある。上の紙の長さの例で、新しく測り直すと14.0 ± 0.2インチという長さが出るかもしれない。ここでの不確かさは、読み取りの正確さや繰り返し測定にもとづく。しかしその場合は、どちらか一方の測定の組が、その組での測定手続きのずれのせいで誤っているか、あるいは私たちの測定は違う紙を測っていることを正しく示しているか、のどちらかだと結論することになる。前者の場合、測定値と実際の値との食い違いを系統誤差と呼ぶ。
The factors contributing to uncertainty in a measurement include the following:
測定の不確かさに寄与する要因には、次のようなものがある。
1. Limitations of the measuring device2. The skill of the person making the measurement3. Irregularities in the object being measured4. Any other factors that affect the outcome (highly dependent on the situation)
1. 測定器の限界2. 測定する人の熟練度3. 測定される対象の不揃い4. 結果に影響する他のあらゆる要因(状況によって大きく異なる)
In the printer paper example uncertainty could be caused by: the fact that the smallest division on the ruler is 0.1 inches, the person using the ruler has bad eyesight, or uncertainty caused by the paper cutting machine (e.g., one side of the paper is slightly longer than the other.) It is good practice to carefully consider all possible sources of uncertainty in a measurement and reduce or eliminate them.
プリンタ用紙の例では、不確かさの原因はこうなりうる。ものさしの最小目盛りが0.1インチであること、ものさしを使う人の視力が悪いこと、あるいは紙の裁断機による不確かさ(たとえば紙の一辺が反対側よりわずかに長い)など。測定における不確かさの原因をすべて注意深く考え、減らすか取り除くのがよい習慣である。
Percent Uncertainty One method of expressing uncertainty is as a percent of the measured value. If a measurement, A, is expressed with uncertainty, δA, the percent uncertainty is
百分率で表した不確かさ 不確かさを表す一つの方法は、測定値に対する百分率で表すことである。測定値Aが不確かさδAを伴って表されているとき、百分率で表した不確かさは次のようになる。
Calculating Percent Uncertainty: A Bag of Apples A grocery store sells 5-lb bags of apples. You purchase four bags over the course of a month and weigh the apples each time. You obtain the following measurements:
百分率の不確かさを計算する:リンゴ一袋 ある食料品店で5ポンド入りのリンゴの袋を売っている。1か月のあいだに4袋買い、そのつどリンゴの重さを量った。次の測定値を得た。
• Week 1 weight: • Week 2 weight: • Week 3 weight: • Week 4 weight: You determine that the expected weight of a 5 lb bag has an uncertainty of ±0.4 lb. What is the percent uncertainty of the bag’s weight? Strategy
・第1週の重さ:・第2週の重さ:・第3週の重さ:・第4週の重さ: 5ポンド入りの袋の期待される重さには±0.4ポンドの不確かさがあると判断した。この袋の重さの百分率の不確かさはいくらか。 方針
First, observe that the expected value of the bag’s weight, , is 5 lb. The uncertainty in this value, , is 0.4 lb. We can use the following equation to determine the percent uncertainty of the weight
まず、袋の重さの期待値が5ポンドであることに注目する。この値の不確かさは0.4ポンドである。重さの百分率の不確かさを求めるには、次の式が使える。
Solution解答
Plug the known values into the equation
既知の値を式に代入する。
Discussion考察
We can conclude that the weight of the apple bag is 5 lb ± 8 percent. Consider how this percent uncertainty would change if the bag of apples were half as heavy, but the uncertainty in the weight remained the same. Hint for future calculations: when calculating percent uncertainty, always remember that you must multiply the fraction by 100 percent. If you do not do this, you will have a decimal quantity, not a percent value.
リンゴの袋の重さは5ポンド±8パーセントである、と結論できる。もしリンゴの袋の重さが半分で、重さの不確かさは同じままだったら、この百分率の不確かさはどう変わるかを考えてみよう。今後の計算のためのヒント。百分率の不確かさを計算するときは、分数に100パーセントを掛けねばならないことを必ず思い出すこと。これを忘れると、百分率ではなく小数の量になってしまう。
Uncertainty in Calculations There is an uncertainty in anything calculated from measured quantities. For example, the area of a floor calculated from measurements of its length and width has an uncertainty because the both the length and width have uncertainties. How big is the uncertainty in something you calculate by multiplication or division? If the measurements in the calculation have small uncertainties (a few percent or less), then the method of adding percents can be used. This method says that the percent uncertainty in a quantity calculated by multiplication or division is the sum of the percent uncertainties in the items used to make the calculation. For example, if a floor has a length of 4.00 m and a width of 3.00 m, with uncertainties of 2 percent and 1 percent, respectively, then the area of the floor is 12.0 m2 and has an uncertainty of 3 percent (expressed as an area this is 0.36 m2, which we round to 0.4 m2 since the area of the floor is given to a tenth of a square meter).
計算における不確かさ 測定した量から計算されたものには、すべて不確かさがある。たとえば床の面積を縦と横の測定値から計算すると、縦にも横にも不確かさがあるので、面積にも不確かさが生じる。掛け算や割り算で計算したものの不確かさは、どれくらいの大きさになるのか。計算に使う測定値の不確かさが小さければ(数パーセント以下)、百分率を足し合わせる方法が使える。この方法によれば、掛け算や割り算で計算された量の百分率の不確かさは、計算に使った各項の百分率の不確かさの和になる。たとえば床の縦が4.00 m、横が3.00 mで、不確かさがそれぞれ2パーセント、1パーセントなら、床の面積は12.0 m2で、その不確かさは3パーセントである(面積で表すと0.36 m2だが、床の面積が0.1平方メートルの位まで与えられているので0.4 m2に丸める)。
For more information on the accuracy, precision, and uncertainty of measurements based upon the units of measurement, visit this website (https://openstax.org/l/28precision).
測定単位にもとづく測定の正確さ・精密さ・不確かさについてさらに知りたければ、このウェブサイト(https://openstax.org/l/28precision)を見よ。
Precision of Measuring Tools and Significant Figures An important factor in the accuracy and precision of measurements is the precision of the measuring tool. In general, a precise measuring tool is one that can measure values in very small increments. For example, consider measuring the thickness of a coin. A standard ruler can measure thickness to the nearest millimeter, while a micrometer can measure the thickness to the nearest 0.005 millimeter. The micrometer is a more precise measuring tool because it can measure extremely small differences in thickness. The more precise the measuring tool, the more precise and accurate the measurements can be.
測定器の精密さと有効数字 測定の正確さと精密さを左右する重要な要因が、測定器の精密さである。一般に精密な測定器とは、ごく小さな刻みで値を測れるもののことである。たとえばコインの厚さを測ることを考えよう。ふつうのものさしは1ミリメートル単位までしか測れないが、マイクロメータなら0.005ミリメートル単位まで測れる。ごく小さな厚さの違いを測れるので、マイクロメータのほうが精密な測定器である。測定器が精密であるほど、測定はより精密で正確になりうる。
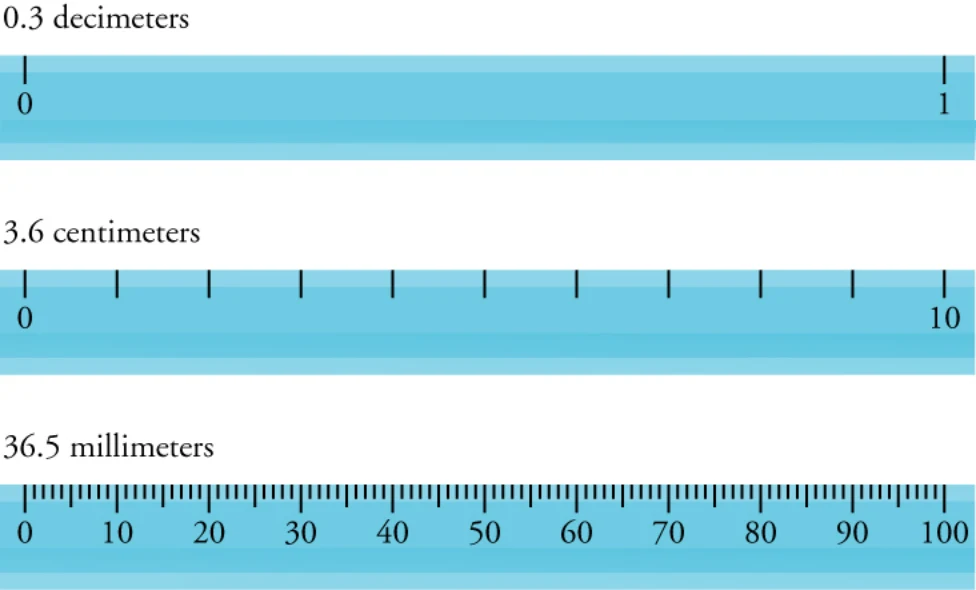
When we express measured values, we can only list as many digits as we initially measured with our measuring tool (such as the rulers shown in Figure 1.24). For example, if you use a standard ruler to measure the length of a stick, you may measure it with a decimeter ruler as 3.6 cm. You could not express this value as 3.65 cm because your measuring tool was not precise enough to measure a hundredth of a centimeter. It should be noted that the last digit in a measured value has been estimated in some way by the person performing the measurement. For example, the person measuring the length of a stick with a ruler notices that the stick length seems to be somewhere in between 36 mm and 37 mm. He or she must estimate the value of the last digit. The rule is that the last digit written down in a measurement is the first digit with some uncertainty. For example, the last measured value 36.5 mm has three digits, or three significant figures. The number of significant figures in a measurement indicates the precision of the measuring tool. The more precise a measuring tool is, the greater the number of significant figures it can report.
測定値を表すとき、私たちは測定器で実際に測れた桁数までしか書けない(図1.24に示したものさしのように)。たとえばふつうのものさしで棒の長さを測ると、デシメートル刻みのものさしでは3.6 cmと測れるかもしれない。この値を3.65 cmと書くことはできない。測定器がセンチメートルの100分の1まで測れるほど精密ではないからである。なお、測定値の最後の桁は、測定した人が何らかの形で目分量で決めたものである。たとえばものさしで棒の長さを測る人は、棒の長さが36 mmと37 mmの間のどこかにあるように見える、と気づく。その人は最後の桁の値を目分量で決めねばならない。規則は、測定値として書き下される最後の桁が、いくらかの不確かさを含む最初の桁である、というものだ。たとえば測定値36.5 mmは3桁、すなわち有効数字3桁である。測定値の有効数字の桁数は、測定器の精密さを示している。測定器が精密であるほど、報告できる有効数字の桁数は多くなる。
Zeros Special consideration is given to zeros when counting significant figures. For example, the zeros in 0.053 are not significant because they are only placeholders that locate the decimal point. There are two significant figures in
ゼロ 有効数字を数えるとき、ゼロには特別な注意が要る。たとえば0.053のゼロは有効数字ではない。小数点の位置を示す位取りにすぎないからである。この数の有効数字は2桁である。
0.053—the 5 and the 3. However, if the zero occurs between other significant figures, the zeros are significant. For example, both zeros in 10.053 are significant, as these zeros were actually measured. Therefore, the 10.053 placeholder has five significant figures. The zeros in 1300 may or may not be significant, depending on the style of writing numbers. They could mean the number is known to the last zero, or the zeros could be placeholders. So 1300 could have two, three, or four significant figures. To avoid this ambiguity, write 1300 in scientific notation as 1.3 × 10³. Only significant figures are given in the x factor for a number in scientific notation (in the form ). Therefore, we know that 1 and 3 are the only significant digits in this number. In summary, zeros are significant except when they serve only as placeholders. Table 1.4 provides examples of the number of significant figures in various numbers.
すなわち5と3である。ただしゼロが他の有効数字の間にあるとき、そのゼロは有効である。たとえば10.053の二つのゼロはどちらも有効で、これらは実際に測定されたものだからである。したがって10.053は有効数字5桁である。1300のゼロは、数の書き方によって有効かもしれないし、有効でないかもしれない。最後のゼロの位まで分かっているという意味かもしれないし、ゼロが単なる位取りかもしれない。だから1300は有効数字2桁とも3桁とも4桁ともとれる。この曖昧さを避けるには、1300を科学的記数法で1.3 × 10³と書けばよい。科学的記数法(の形)では、xの因子には有効数字だけが書かれる。したがってこの数の有効な桁は1と3だけだとわかる。まとめると、ゼロは単なる位取りとして働いている場合を除いて有効である。さまざまな数の有効数字の桁数の例を表1.4に示す。
Significant Figures in Calculations When combining measurements with different degrees of accuracy and precision, the number of significant digits in the final answer can be no greater than the number of significant digits in the least precise measured value. There are two different rules, one for multiplication and division and another rule for addition and subtraction, as discussed below.
計算における有効数字 正確さと精密さの度合いが異なる測定値を組み合わせるとき、最終的な答えの有効数字の桁数は、最も精密でない測定値の有効数字の桁数を超えてはならない。規則は二つあり、一つは掛け算と割り算、もう一つは足し算と引き算のためのもので、以下に述べる。
1. For multiplication and division: The answer should have the same number of significant figures as the starting value with the fewest significant figures. For example, the area of a circle can be calculated from its radius using . Let us see how many significant figures the area will have if the radius has only two significant figures, for example, r = 2.0 m. Then, using a calculator that keeps eight significant figures, you would get
1. 掛け算と割り算の場合。答えの有効数字の桁数は、もとの値のうち有効数字がいちばん少ないものと同じにする。たとえば円の面積は半径からで計算できる。半径の有効数字が2桁しかない場合、たとえばr = 2.0 mのとき、面積の有効数字が何桁になるかを見てみよう。有効数字8桁を保持する電卓で計算すると、次が得られる。
But because the radius has only two significant figures, the area calculated is meaningful only to two significant figures or
しかし半径の有効数字は2桁しかないので、計算された面積も2桁までしか意味を持たない。すなわち、
even though the value of is meaningful to at least eight digits.
の値が少なくとも8桁まで意味を持つとしても、である。
2. For addition and subtraction: The answer should have the same number places (e.g. tens place, ones place, tenths place, etc.) as the least-precise starting value. Suppose that you buy 7.56 kg of potatoes in a grocery store as measured with a scale having a precision of 0.01 kg. Then you drop off 6.052 kg of potatoes at your laboratory as measured by a scale with a precision of 0.001 kg. Finally, you go home and add 13.7 kg of potatoes as measured by a bathroom scale with a precision of 0.1 kg. How many kilograms of potatoes do you now have, and how many significant figures are appropriate in the answer? The mass is found by simple addition and subtraction:
2. 足し算と引き算の場合。答えの位取り(十の位、一の位、小数第1位など)は、もとの値のうち最も精密でないものと同じにする。ある食料品店で、0.01 kgの精度をもつ秤で量った7.56 kgのジャガイモを買ったとしよう。次に、0.001 kgの精度の秤で量った6.052 kgのジャガイモを研究室に置いてくる。最後に家へ帰り、0.1 kgの精度の体重計で量った13.7 kgのジャガイモを加える。今あなたは何キログラムのジャガイモを持っていて、答えには何桁の有効数字がふさわしいか。質量は単純な足し算と引き算で求まる。
The least precise measurement is 13.7 kg. This measurement is expressed to the 0.1 decimal place, so our final answer must also be expressed to the 0.1 decimal place. Thus, the answer should be rounded to the tenths place, giving 15.2 kg. The same is true for non-decimal numbers. For example,
最も精密でない測定値は13.7 kgである。この測定値は小数第1位まで表されているので、最終的な答えも小数第1位まで表さねばならない。したがって答えは小数第1位に丸めて15.2 kgとする。小数でない数についても同じことがいえる。たとえば、
We cannot report the decimal places in the answer because 2 has no decimal places that would be significant. Therefore, we can only report to the ones place.
2には有効な小数位がないので、答えに小数位を書くことはできない。したがって一の位までしか報告できない。
It is a good idea to keep extra significant figures while calculating, and to round off to the correct number of significant figures only in the final answers. The reason is that small errors from rounding while calculating can sometimes produce significant errors in the final answer. As an example, try calculating to obtain a final answer to only two significant figures. Keeping all significant during the calculation gives 48. Rounding to two significant figures in the middle of the calculation changes it to which is way off. You would similarly avoid rounding in the middle of the calculation in counting and in doing accounting, where many small numbers need to be added and subtracted accurately to give possibly much larger final numbers.
計算の途中では有効数字を余分に残しておき、最終的な答えのところで正しい桁数に丸めるのがよい。理由は、計算の途中で丸めた小さな誤差が、最終的な答えでは大きな誤差を生むことがあるからである。例としてを計算し、有効数字2桁の答えを出してみよう。計算の間ずっと桁を保てば48になる。計算の途中で2桁に丸めるととなり、大きく外れる。同じように、多くの小さな数を正確に足し引きして、はるかに大きな最終値を出すような数え上げや経理の作業でも、途中で丸めるのは避けるべきである。
Significant Figures in this Text In this textbook, most numbers are assumed to have three significant figures. Furthermore, consistent numbers of significant figures are used in all worked examples. You will note that an answer given to three digits is based on input good to at least three digits. If the input has fewer significant figures, the answer will also have fewer significant figures. Care is also taken that the number of significant figures is reasonable for the situation posed. In some topics, such as optics, more than three significant figures will be used. Finally, if a number is exact, such as the 2 in the formula, , it does not affect the number of significant figures in a calculation.
本書における有効数字 本書ではほとんどの数を有効数字3桁とみなす。さらに、すべての計算例で有効数字の桁数を揃えている。3桁で与えられた答えは、少なくとも3桁の確かさをもつ入力にもとづいていることに気づくだろう。入力の有効数字が少なければ、答えの有効数字も少なくなる。有効数字の桁数がその場面にとって妥当であるようにも注意している。光学など一部の話題では、3桁を超える桁数を使う。最後に、式の中の2のように厳密な数は、計算の有効数字の桁数に影響しない。
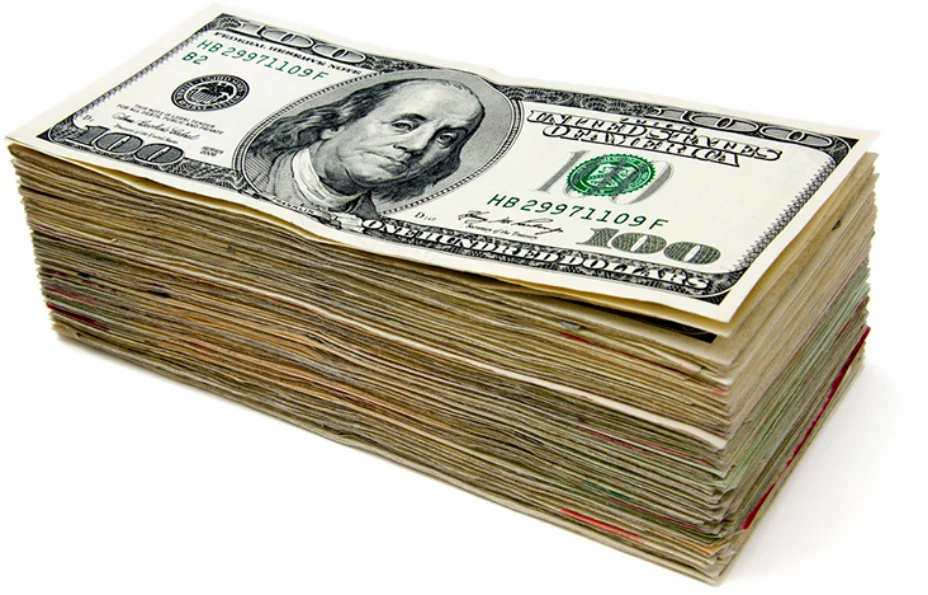
Approximating Vast Numbers: a Trillion Dollars The U.S. federal deficit in the 2008 fiscal year was a little greater than $10 trillion. Most of us do not have any concept of how much even one trillion actually is. Suppose that you were given a trillion dollars in $100 bills. If you made 100-bill stacks, like that shown in Figure 1.25, and used them to evenly cover a football field (between the end zones), make an approximation of how high the money pile would become. (We will use feet/inches rather than meters here because football fields are measured in yards.) One of your friends says 3 in., while another says 10 ft. What do you think?
とてつもない数を見積もる:1兆ドル 2008会計年度のアメリカ連邦政府の赤字は、10兆ドルを少し超えていた。私たちのほとんどは、1兆がどれくらいなのかという感覚すら持っていない。100ドル札で1兆ドルを渡されたとしよう。図1.25のように100枚の束にして、それをフットボール場(エンドゾーンの間)に均一に敷き詰めたら、札の山はどれくらいの高さになるか、概算せよ。(フットボール場はヤードで測るので、ここではメートルではなくフィートとインチを使う。)友人の一人は3インチと言い、もう一人は10フィートと言う。あなたはどう思うか。
Strategy方針
When you imagine the situation, you probably envision thousands of small stacks of 100 wrapped $100 bills, such as you might see in movies or at a bank. Since this is an easy-to-approximate quantity, let us start there. We can find the volume of a stack of 100 bills, find out how many stacks make up one trillion dollars, and then set this volume equal to the area of the football field multiplied by the unknown height.
この状況を思い浮かべるとき、あなたはおそらく、映画や銀行で見かけるような、100ドル札を100枚ずつ帯で束ねた小さな束が何千もある光景を思い描くだろう。これは見積もりやすい量なので、そこから始めよう。100枚の札束の体積を求め、1兆ドルが何束になるかを調べ、その体積を、フットボール場の面積に未知の高さを掛けたものと等しいと置けばよい。
Solution解答
1. Calculate the volume of a stack of 100 bills. The dimensions of a single bill are approximately 3 in. by 6 in. A stack of 100 of these is about 0.5 in. thick. So the total volume of a stack of 100 bills is
1. 100枚の札束の体積を計算する。1枚の札の寸法はおよそ3インチ×6インチである。これを100枚重ねると厚さは約0.5インチになる。したがって100枚の札束の全体積は次のようになる。
2. Calculate the number of stacks. Note that a trillion dollars is equal to , and a stack of one-hundred bills is equal to or . The number of stacks you will have is
2. 束の数を計算する。1兆ドルはであり、100枚の札の束は、すなわちに等しいことに注意する。したがって必要な束の数は次のようになる。
3. Calculate the area of a football field in square inches. The area of a football field is , which gives . Because we are working in inches, we need to convert square yards to square inches
3. フットボール場の面積を平方インチで計算する。フットボール場の面積はであり、となる。インチで計算しているので、平方ヤードを平方インチに換算する必要がある。
This conversion gives us for the area of the field. (Note that we are using only one significant figure in these calculations.)
この換算から、場の面積はと求まる。(この計算では有効数字を1桁しか使っていないことに注意。)
4. Calculate the total volume of the bills. The volume of all the $100-bill stacks is
4. 札全体の体積を計算する。100ドル札の束すべての体積は次のようになる。
5. Calculate the height. To determine the height of the bills, use the following equation
5. 高さを計算する。札束の高さを求めるには、次の式を使う。
Since the area is actually a little larger than 6 × 10², the height is a little less than 150, so round down to 100 inches rather than up to 200 inches.
実際の面積は6 × 10²より少し大きいので、高さは150より少し小さくなる。したがって200インチに切り上げるのではなく、100インチに切り下げる。
The height of the money will be about 100 in. high. Converting this value to feet gives
札束の高さはおよそ100インチになる。この値をフィートに換算すると次のようになる。
Discussion考察
The final approximate value is much higher than the early estimate of 3 in., but the other early estimate of 10 ft (120 in.) was roughly correct. How did the approximation measure up to your first guess? What can this exercise tell you in terms of rough guesstimates versus carefully calculated approximations?
最終的な概算値は、最初の見積もりである3インチよりはるかに大きいが、もう一つの見積もりである10フィート(120インチ)はおおむね正しかった。この概算は、あなたの最初の推測とくらべてどうだっただろうか。大まかな当て推量と、注意深く計算した概算とを比べて、この練習から何が言えるだろうか。
In the example above, the final approximate value is much higher than the first friend’s early estimate of 3 in. However, the other friend’s early estimate of 10 ft. (120 in.) was roughly correct. How did the approximation measure up to your first guess? What can this exercise suggest about the value of rough guesstimates versus carefully calculated approximations?
上の例では、最終的な概算値は、最初の友人の見積もりである3インチよりはるかに大きい。しかしもう一人の友人の見積もりである10フィート(120インチ)はおおむね正しかった。この概算は、あなたの最初の推測とくらべてどうだっただろうか。大まかな当て推量と、注意深く計算した概算との価値について、この練習から何が言えるだろうか。