第8章周期関数Periodic Functions
Answer Key解答
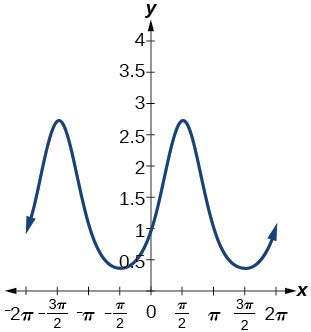
![A graph of -0.8cos(2x). Graph has range of [-0.8, 0.8], period of pi, amplitude of 0.8, and is reflected about the x-axis compared to it's parent function cos(x).](img/d432f5a8040ebb4fdfbb73186bf9ff05e849f0c0.jpg)
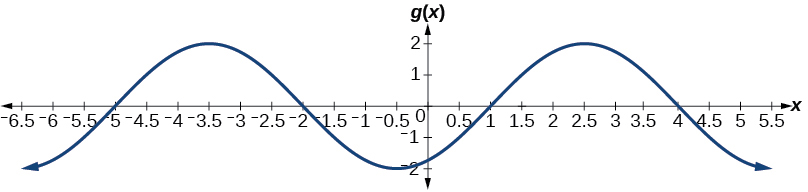
![A graph of 7cos(x). Graph has amplitude of 7, period of 2pi, and range of [-7,7].](img/86fa9e0048d285fece900015363ed3c8cc09e941.jpg)
![A cosine graph with range [-1,-7]. Period is 2 pi. Local maximums at (0,-1), (2pi,-1), and (4pi, -1). Local minimums at (pi,-7) and (3pi, -7).](img/73020a0f5f556222edf2367508f3a63c84c69abc.jpg)
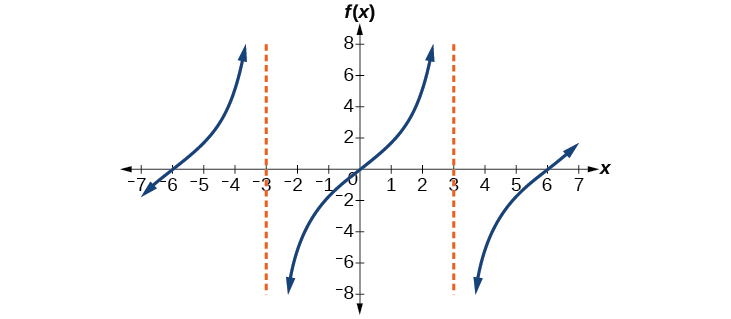
It would be reflected across the line becoming an increasing function.
直線 に関して折り返され、増加する関数になる。
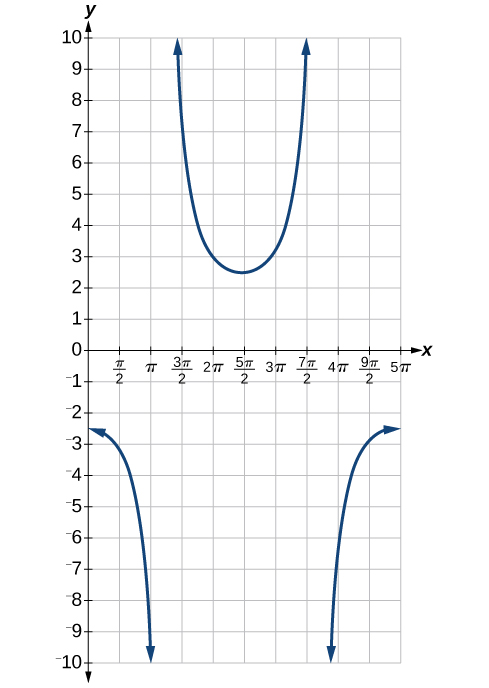
This is a vertical reflection of the preceding graph because is negative.
が負なので、これは前のグラフを縦に折り返したものである。
8.1 Section Exercises8.1 節末問題
The sine and cosine functions have the property that for a certain This means that the function values repeat for every units on the x-axis.
正弦関数と余弦関数は、ある について という性質を持つ。つまり、x軸上で 単位ごとに関数の値が繰り返す。
The absolute value of the constant (amplitude) increases the total range and the constant (vertical shift) shifts the graph vertically.
定数 の絶対値(振幅)が値域の幅を広げ、定数 (縦の移動)がグラフを縦に移す。
At the point where the terminal side of intersects the unit circle, you can determine that the equals the y-coordinate of the point.
の動径が単位円と交わる点で、 がその点の y座標に等しいと決められる。
![A graph of (2/3)cos(x). Graph has amplitude of 2/3, period of 2pi, and range of [-2/3, 2/3].](img/19f369f5e4c271b465f79dda895c664626949600.jpg)
amplitude: period: midline: maximum: occurs at minimum: occurs at for one period, the graph starts at 0 and ends at
振幅: 、周期: 、中央線: 、最大値: ( で生じる)、最小値: ( で生じる)。1周期分のグラフは0から始まり で終わる。
![A graph of 4sin(x). Graph has amplitude of 4, period of 2pi, and range of [-4, 4].](img/79cbb14b3d85efbd9022a246bc67562a683c1422.jpg)
amplitude: 4; period: midline: maximum occurs at minimum: occurs at one full period occurs from to
振幅: 4、周期: 、中央線: 、最大値: ( で生じる)、最小値: ( で生じる)。1周期は から まで。
![A graph of cos(2x). Graph has amplitude of 1, period of pi, and range of [-1,1].](img/31a99a29c1a8c555ca4bf76788159ef0f1547b6f.jpg)
amplitude: 1; period: midline: maximum: occurs at minimum: occurs at one full period is graphed from to
振幅: 1、周期: 、中央線: 、最大値: ( で生じる)、最小値: ( で生じる)。1周期分は から まで描かれる。
![A graph of 4cos(pi*x). Grpah has amplitude of 4, period of 2, and range of [-4, 4].](img/57ec54f1387846a3210c62cd89b6c8b93acbd11d.jpg)
amplitude: 4; period: 2; midline: maximum: occurs at minimum: occurs at
振幅: 4、周期: 2、中央線: 、最大値: ( で生じる)、最小値: ( で生じる)。
![A graph of 3sin(8(x+4))+5. Graph has amplitude of 3, range of [2, 8], and period of pi/4.](img/84a6e2fc82686dd7b26513bdf9e4a489d0098dc3.jpg)
amplitude: 3; period: midline: maximum: occurs at minimum: occurs at horizontal shift: vertical translation 5; one period occurs from to
振幅: 3、周期: 、中央線: 、最大値: ( で生じる)、最小値: ( で生じる)、横の移動: 、縦の平行移動: 5。1周期は から まで。
![A graph of 5sin(5x+20)-2. Graph has an amplitude of 5, period of 2pi/5, and range of [-7,3].](img/80ae4900cf88dce5a750e4cb7c19f7aa7c180c85.jpg)
amplitude: 5; period: midline: maximum: occurs at minimum: occurs at phase shift: vertical translation: one full period can be graphed on to
振幅: 5、周期: 、中央線: 、最大値: ( で生じる)、最小値: ( で生じる)、位相のずれ: 、縦の平行移動: 。1周期分は から まで描ける。
![A graph of -cos(t+pi/3)+1. Graph has amplitude of 1, period of 2pi, and range of [0,2]. Phase shifted pi/3 to the left.](img/f29d9536af571b0e08019aa260bd7f7c5bdc0d9f.jpg)
amplitude: 1 ; period: midline: maximum: occurs at minimum: occurs at phase shift: vertical translation: 1; one full period is from to
振幅: 1、周期: 、中央線: 、最大値: ( で生じる)、最小値: ( で生じる)、位相のずれ: 、縦の平行移動: 1。1周期分は から まで。
![A graph of -sin((1/2)*t + 5pi/3). Graph has amplitude of 1, range of [-1,1], period of 4pi, and a phase shift of -10pi/3.](img/c9fe01d00b510cd774e5e03f195cdccada5e39e2.jpg)
amplitude: 1; period: midline: maximum: occurs at minimum: occurs at phase shift: vertical shift: 0
振幅: 1、周期: 、中央線: 、最大値: ( で生じる)、最小値: ( で生じる)、位相のずれ: 、縦の移動: 0。
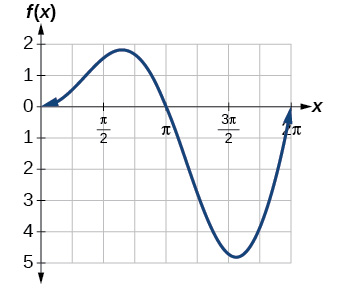
A linear function is added to a periodic sine function. The graph does not have an amplitude because as the linear function increases without bound the combined function will increase without bound as well. The graph is bounded between the graphs of and because sine oscillates between −1 and 1.
一次関数が周期を持つ正弦関数に足されている。一次関数が限りなく増えると、合わせた関数 も限りなく増えるので、このグラフに振幅は無い。正弦が−1と1のあいだで振れるので、このグラフは と のグラフのあいだに挟まれる。
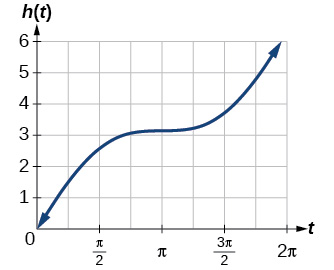
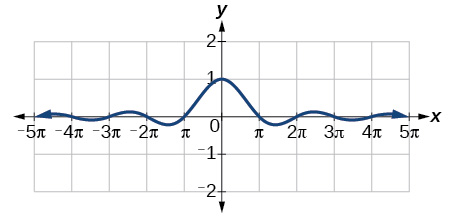
The graph is symmetric with respect to the y-axis and there is no amplitude because the function’s bounds decrease as grows. There appears to be a horizontal asymptote at .
このグラフは y軸に関して対称であり、 が大きくなるにつれてこの関数の上下の限りが小さくなるので、振幅は無い。 に水平漸近線があるように見える。
8.2 Section Exercises8.2 節末問題
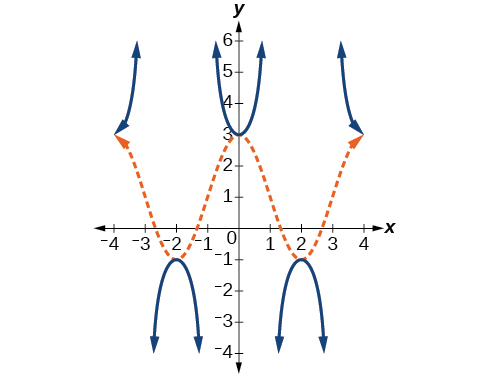
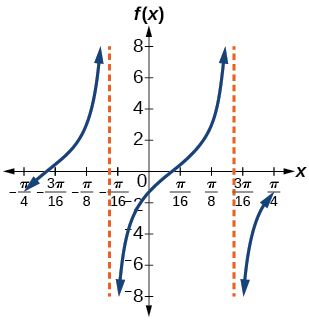
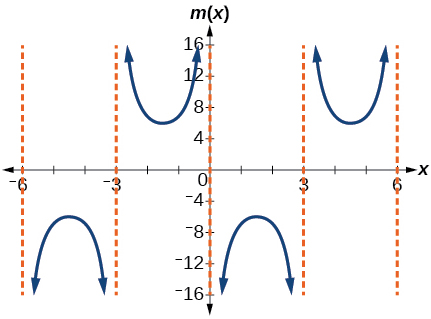
Since is the reciprocal function of you can plot the reciprocal of the coordinates on the graph of to obtain the y-coordinates of The x-intercepts of the graph are the vertical asymptotes for the graph of
は の逆数の関数なので、 のグラフ上の座標の逆数を打てば の y座標が得られる。グラフ の x切片が、 のグラフの垂直漸近線である。
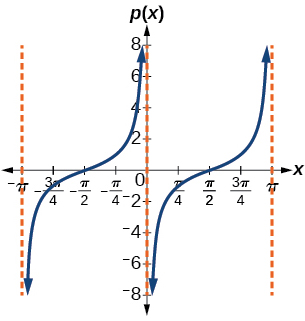
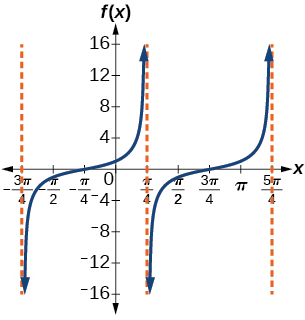
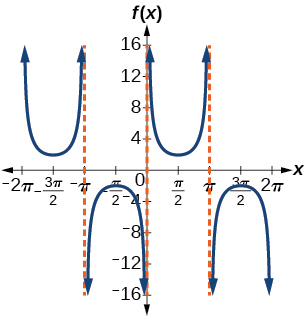
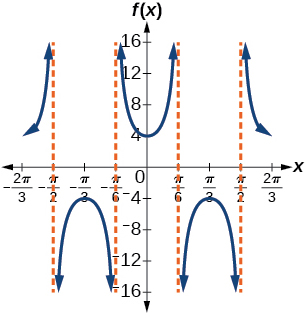
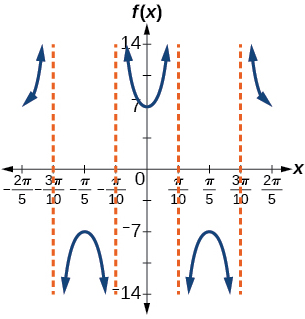
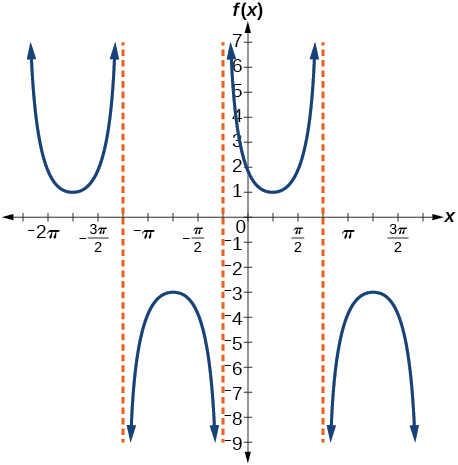
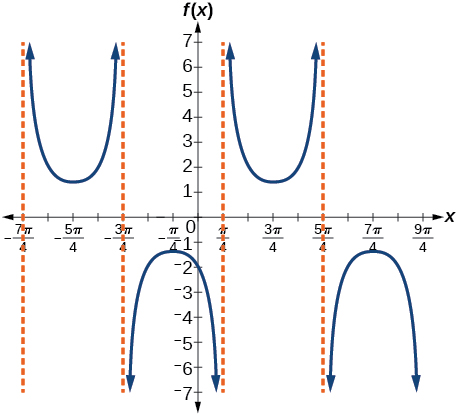
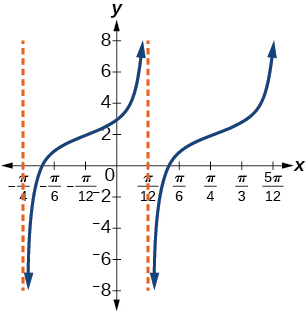
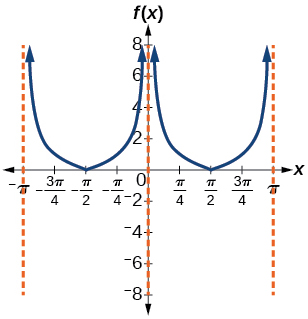
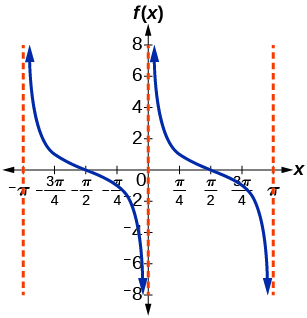
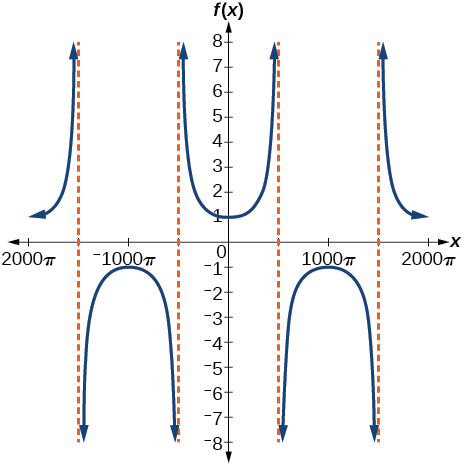
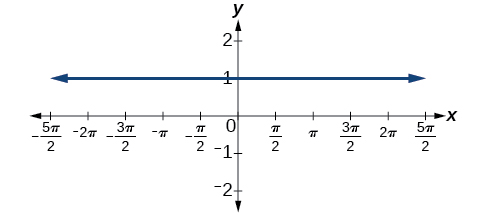
ⓐⓑ ⓒ and the distance grows without bound as approaches —i.e., at right angles to the line representing due north, the boat would be so far away, the fisherman could not see it;ⓓ3; when the boat is 3 km away;ⓔ1.73; when the boat is about 1.73 km away;ⓕ1.5 km; when
ⓒ と 。 が に近づくにつれて距離は限りなく大きくなる。すなわち、真北を表す線と直角の向きでは、船はあまりに遠く、釣り人には見えないだろう。ⓓ3。 のとき、船は3km離れている。ⓔ1.73。 のとき、船はおよそ1.73km離れている。ⓕ1.5km。 のとき。
ⓐⓑ ⓒ after 0 seconds, the rocket is 0 mi above the ground; after 30 seconds, the rockets is 2 mi high;ⓓAs approaches 60 seconds, the values of grow increasingly large. The distance to the rocket is growing so large that the camera can no longer track it.
ⓒ。0秒後、ロケットは地上0マイルにある。。30秒後、ロケットは2マイルの高さにある。ⓓ が60秒に近づくにつれて、 の値はどんどん大きくなる。ロケットまでの距離があまりに大きくなり、カメラはもう追えなくなる。
8.3 Section Exercises8.3 節末問題
The function is one-to-one on thus, this interval is the range of the inverse function of The function is one-to-one on thus, this interval is the range of the inverse function of
関数 は で一対一である。よってこの区間が の逆関数の値域になる。関数 は で一対一である。よってこの区間が の逆関数の値域になる。
is the radian measure of an angle between and whose sine is 0.5.
は、正弦が0.5である と のあいだの角の、ラジアンでの大きさである。
In order for any function to have an inverse, the function must be one-to-one and must pass the horizontal line test. The regular sine function is not one-to-one unless its domain is restricted in some way. Mathematicians have agreed to restrict the sine function to the interval so that it is one-to-one and possesses an inverse.
どんな関数も逆関数を持つには、一対一であり、横の直線の判定に通らなければならない。ふつうの正弦関数は、定義域を何らかのしかたで制限しない限り一対一でない。数学者は、正弦関数が一対一になって逆関数を持つよう、定義域を区間 に制限することで合意している。
True . The angle, that equals , , will be a second quadrant angle with reference angle, , where equals , . Since is the reference angle for , and = -
正しい。、 に等しい角 は、基準角 を持つ第2象限の角になる。ここで は 、 に等しい。 は の基準角なので、 であり = である。
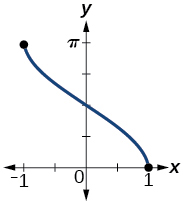
No. The angle the ladder makes with the horizontal is 60 degrees.
いいえ。梯子が水平線となす角は60度である。
Review Exercises復習問題
![A graph of two periods of a function with a cosine parent function. The graph has a range of [0,6] graphed over -2pi to 2pi. Maximums as -pi and pi.](img/e29a287d84cfb9c6aedd85cec75567159cabadb7.jpg)
![A graph of four periods of a function with a cosine parent function. Graphed from -4pi to 4pi. Range is [-3,3].](img/beda7239741b31ac783dc272f9bdbfa0e43df871.jpg)
![A graph of two periods of a sinusoidal function. Range is [-7,-1]. Maximums at -5pi/4 and 3pi/4.](img/32b5d0813a5a57db581cadf60343d2f8d5930a46.jpg)
![A sinusoidal graph over two periods. Range is [-7,5], amplitude is 6, and period is 2pi/3.](img/a12ab6875439922121449edfce9eb4e59e8eec59.jpg)
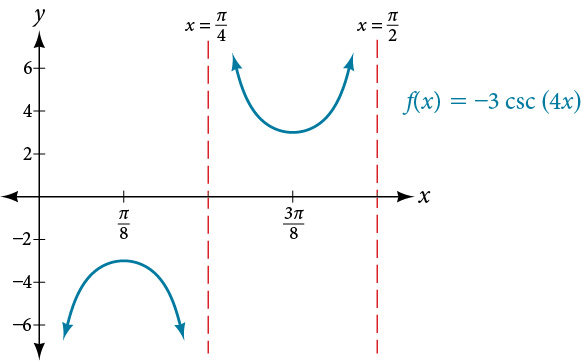
stretching factor: none; period: midline: asymptotes: where is an integer
伸びの倍率: 無し、周期: 、中央線: 、漸近線: を整数として
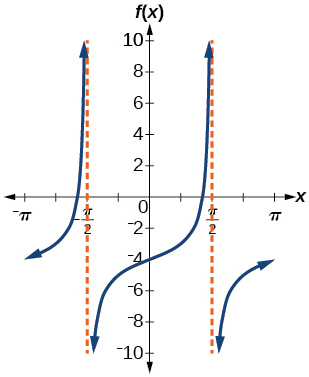
stretching factor: 3; period: midline: asymptotes: where is an integer
伸びの倍率: 3、周期: 、中央線: 、漸近線: を整数として
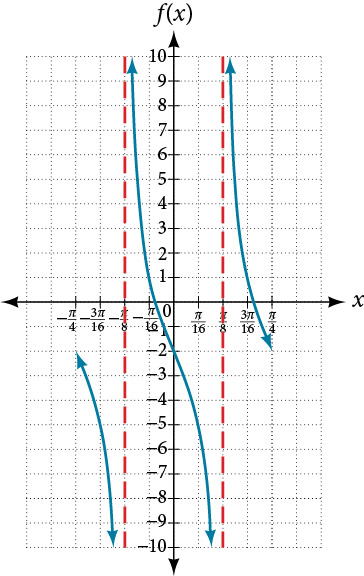
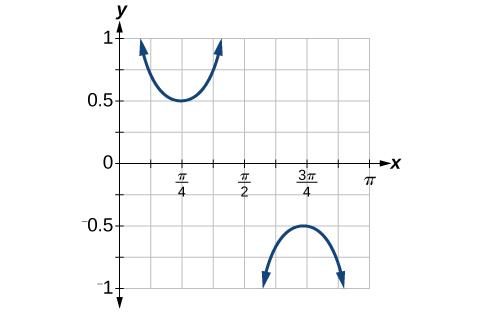
amplitude: none; period: no phase shift; asymptotes: where is an odd integer
振幅: 無し、周期: 、位相のずれは無い、漸近線: を奇数として
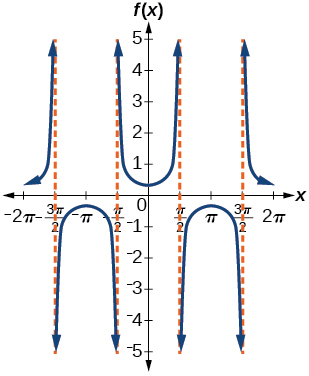
amplitude: none; period: no phase shift; asymptotes: where is an integer
振幅: 無し、周期: 、位相のずれは無い、漸近線: を整数として
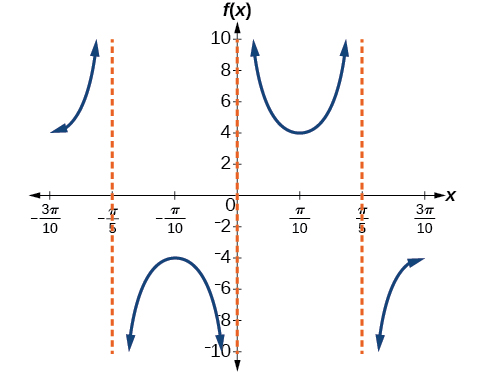
amplitude: none; period: no phase shift; asymptotes: where is an integer
振幅: 無し、周期: 、位相のずれは無い、漸近線: を整数として
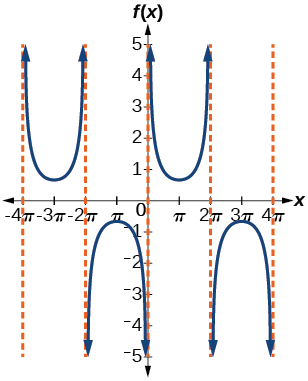
In 2007, the predicted population is 4,413. In 2010, the population will be 11,924.
2007年の人口の予測は4,413である。2010年の人口は11,924になる。
The graphs are not symmetrical with respect to the line They are symmetrical with respect to the -axis.
このグラフは直線 に関して対称でない。 軸に関して対称である。
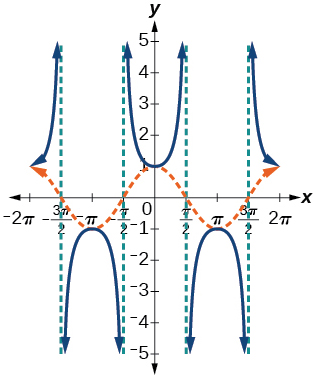
![Two graphs of two identical functions on the interval [-1 to 1]. Both graphs appear sinusoidal.](img/172753f93f3c07629c82541bca0e55fd2c3b8e44.jpg)
Practice Test実力テスト
![A graph of two periods of a sinusoidal function, graphed over -2pi to 2pi. The range is [-0.5,0.5]. X-intercepts at multiples of pi.](img/63c1e5ce2406995c6db1daf69383f63e9a3c5fe7.jpg)
![Two periods of a sine function, graphed over -2pi to 2pi. The range is [-5,5], amplitude of 5, period of 2pi.](img/20765b265001d39c39b963a805c81a2b8d7a3e23.jpg)
![A graph of two periods of a cosine function, graphed over -7pi/3 to 5pi/3. Range is [0,2], Period is 2pi, amplitude is1.](img/0845828831160e5002c90b84cd8c43649e3417ab.jpg)
![A graph of two periods of a cosine function, over -7pi/2 to 17pi/2. The range is [-3,3], period is 6pi, and amplitude is 3.](img/38f0636c673a8324b790d4eb1378919e66c0e295.jpg)
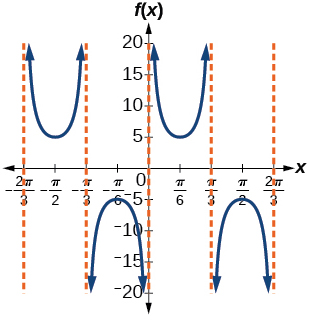
amplitude: none; period: midline: asymptotes: where is an integer
振幅: 無し、周期: 、中央線: 、漸近線: を整数として
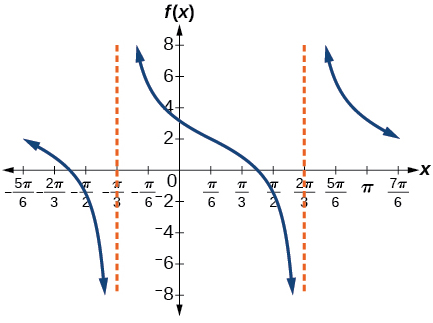
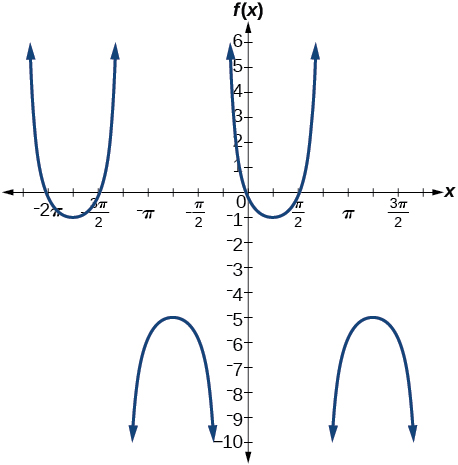
amplitude: none; period: midline: asymptotes: where is an integer
振幅: 無し、周期: 、中央線: 、漸近線: を整数として
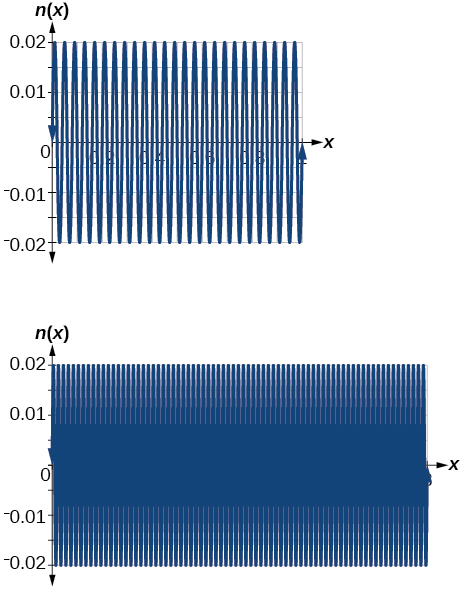
The views are different because the period of the wave is Over a bigger domain, there will be more cycles of the graph.
この波の周期が なので、見え方が違う。定義域が広いほど、グラフの周期の数が増える。
![A graph of one period of a cosine function, graphed over -pi/4 to 0. Range is [1,5], period is pi/6.](img/dc1548551d077f2601aadea17623176b42aab508.jpg)