第8章周期関数Periodic Functions
Graphing Variations of y = sec x and y= csc xy = sec x と y= csc x を変形したもののグラフを描く
For shifted, compressed, and/or stretched versions of the secant and cosecant functions, we can follow similar methods to those we used for tangent and cotangent. That is, we locate the vertical asymptotes and also evaluate the functions for a few points (specifically the local extrema). If we want to graph only a single period, we can choose the interval for the period in more than one way. The procedure for secant is very similar, because the cofunction identity means that the secant graph is the same as the cosecant graph shifted half a period to the left. Vertical and phase shifts may be applied to the cosecant function in the same way as for the secant and other functions.The equations become the following.
正割関数と余割関数を移したり縮めたり伸ばしたりしたものには、正接や余接で使ったのと同じような方法が使える。すなわち、垂直漸近線の場所を決め、いくつかの点(とくに局所の極値)で関数の値を求める。1周期分だけを描きたいなら、周期の区間の選び方は一つではない。正割の手順もよく似ている。余関数の等式により、正割のグラフは余割のグラフを半周期だけ左に移したものだからである。余割関数にも、正割やほかの関数と同じように縦の移動と位相のずれを当てはめられる。式は次のようになる。
Note重要事項
Features of the Graph of y = Asec(Bx−C)+Dy = Asec(Bx−C)+D のグラフの特徴
• The stretching factor is • The period is • The domain is where is an odd integer.• The range is • The vertical asymptotes occur at where is an odd integer.• There is no amplitude.• is an even function because cosine is an even function.
・伸びの倍率は である。・周期は である。・定義域は、 を奇数として である。・値域は である。・垂直漸近線は、 を奇数として に現れる。・振幅は無い。・余弦が偶関数なので、 は偶関数である。
Note重要事項
Features of the Graph of y = Acsc(Bx−C)+Dy = Acsc(Bx−C)+D のグラフの特徴
• The stretching factor is • The period is • The domain is where is an integer.• The range is • The vertical asymptotes occur at where is an integer.• There is no amplitude.• is an odd function because sine is an odd function.
・伸びの倍率は である。・周期は である。・定義域は、 を整数として である。・値域は である。・垂直漸近線は、 を整数として に現れる。・振幅は無い。・正弦が奇関数なので、 は奇関数である。
How To手順
Given a function of the form graph one period.
の形の関数が与えられたとき、1周期分のグラフを描く。
1. Express the function given in the form 2. Identify the stretching/compressing factor, 3. Identify and determine the period, 4. Sketch the graph of 5. Use the reciprocal relationship between and to draw the graph of 6. Sketch the asymptotes.7. Plot any two reference points and draw the graph through these points.
1. 与えられた関数を の形で表す。2. 伸縮の倍率 を見分ける。3. を見分け、周期 を決める。4. のグラフの概形を描く。5. と の逆数の関係を使って、 のグラフを描く。6. 漸近線の概形を描く。7. 目印の点を二つ打ち、その点を通るグラフを描く。
Example 4例4
Graphing a Variation of the Secant Function正割関数を変形したもののグラフを描く
Graph one period of
の1周期分のグラフを描け。
Solution 解答
• Step 1. The given function is already written in the general form, • Step 2. so the stretching factor is • Step 3. so The period is units.• Step 4. Sketch the graph of the function • Step 5. Use the reciprocal relationship of the cosine and secant functions to draw the cosecant function.• Steps 6–7. Sketch two asymptotes at and We can use two reference points, the local minimum at and the local maximum at Figure 8 shows the graph. Figure 8
・手順1。与えられた関数はすでに一般形 で書かれている。・手順2。 なので、伸びの倍率は である。・手順3。 なので である。周期は 単位である。・手順4。関数 のグラフの概形を描く。・手順5。余弦関数と正割関数の逆数の関係を使って、余割関数を描く。・手順6〜7。 と に二本の漸近線の概形を描く。目印の点として、 の局所の最小値と の局所の最大値の二つが使える。図8にグラフを示す。図8
Try IT Feature #4確認問題 4
Graph one period of
の1周期分のグラフを描け。
QA疑問と答え
Do the vertical shift and stretch/compression affect the secant’s range?
縦の移動と伸縮は、正割の値域に影響するか。
Yes. The range of is
する。 の値域は である。
How To手順
Given a function of the form graph one period.
の形の関数が与えられたとき、1周期分のグラフを描く。
1. Express the function given in the form 2. Identify the stretching/compressing factor, 3. Identify and determine the period, 4. Identify and determine the phase shift, 5. Draw the graph of , but shift it to the right by and up by 6. Sketch the vertical asymptotes, which occur at where is an odd integer.
1. 与えられた関数を の形で表す。2. 伸縮の倍率 を見分ける。3. を見分け、周期 を決める。4. を見分け、位相のずれ を決める。5. のグラフを描き、右に 、上に 移す。6. 垂直漸近線の概形を描く。これは を奇数として に現れる。
Example 5例5
Graphing a Variation of the Secant Function正割関数を変形したもののグラフを描く
Graph one period of
の1周期分のグラフを描け。
Solution 解答
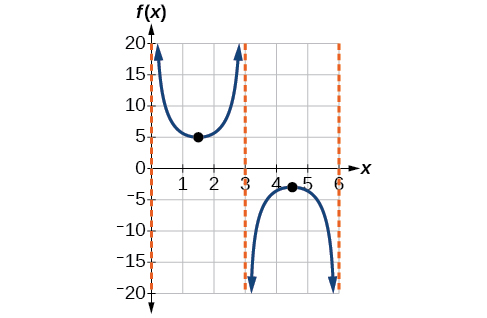
• Step 1. Express the function given in the form • Step 2. The stretching/compressing factor is • Step 3. The period is • Step 4. The phase shift is • Step 5. Draw the graph of but shift it to the right by and up by • Step 6. Sketch the vertical asymptotes, which occur at and There is a local minimum at and a local maximum at Figure 9 shows the graph.
・手順1。与えられた関数を の形で表す。・手順2。伸縮の倍率は である。・手順3。周期は である。・手順4。位相のずれは である。・手順5。 のグラフを描き、右に 、上に 移す。・手順6。垂直漸近線の概形を描く。これは と に現れる。 に局所の最小値、 に局所の最大値がある。図9にグラフを示す。
Try IT Feature #5確認問題 5
Graph one period of
の1周期分のグラフを描け。
QA疑問と答え
The domain of was given to be all such that for any integer Would the domain of
の定義域は、任意の整数 について となるものを除いた 全体だった。 の定義域はどうなるか。
Yes. The excluded points of the domain follow the vertical asymptotes. Their locations show the horizontal shift and compression or expansion implied by the transformation to the original function’s input.
なる。定義域から除かれる点は垂直漸近線に従う。その位置が、元の関数の入力への変形が意味する横の移動と、縮みや広がりを示している。
How To手順
Given a function of the form graph one period.
の形の関数が与えられたとき、1周期分のグラフを描く。
1. Express the function given in the form 2. 3. Identify and determine the period, 4. Draw the graph of 5. Use the reciprocal relationship between and to draw the graph of 6. Sketch the asymptotes.7. Plot any two reference points and draw the graph through these points.
1. 与えられた関数を の形で表す。3. を見分け、周期 を決める。4. のグラフを描く。5. と の逆数の関係を使って、 のグラフを描く。6. 漸近線の概形を描く。7. 目印の点を二つ打ち、その点を通るグラフを描く。
Example 6例6
Graphing a Variation of the Cosecant Function余割関数を変形したもののグラフを描く
Graph one period of
の1周期分のグラフを描け。
Solution 解答
• Step 1. The given function is already written in the general form, • Step 2. so the stretching factor is 3.• Step 3. so The period is units.• Step 4. Sketch the graph of the function • Step 5. Use the reciprocal relationship of the sine and cosecant functions to draw the cosecant function.• Steps 6–7. Sketch three asymptotes at and We can use two reference points, the local maximum at and the local minimum at Figure 10 shows the graph. Figure 10
・手順1。与えられた関数はすでに一般形 で書かれている。・手順2。 なので、伸びの倍率は3である。・手順3。 なので である。周期は 単位である。・手順4。関数 のグラフの概形を描く。・手順5。正弦関数と余割関数の逆数の関係を使って、余割関数を描く。・手順6〜7。 と に三本の漸近線の概形を描く。目印の点として、 の局所の最大値と の局所の最小値の二つが使える。図10にグラフを示す。図10
try it feature #6確認問題 6
Graph one period of
の1周期分のグラフを描け。
How To手順
Given a function of the form graph one period.
の形の関数が与えられたとき、1周期分のグラフを描く。
1. Express the function given in the form 2. Identify the stretching/compressing factor, 3. Identify and determine the period, 4. Identify and determine the phase shift, 5. Draw the graph of but shift it to the right by and up by 6. Sketch the vertical asymptotes, which occur at where is an integer.
1. 与えられた関数を の形で表す。2. 伸縮の倍率 を見分ける。3. を見分け、周期 を決める。4. を見分け、位相のずれ を決める。5. のグラフを描き、右に 、上に 移す。6. 垂直漸近線の概形を描く。これは を整数として に現れる。
Example 7例7
Graphing a Vertically Stretched, Horizontally Compressed, and Vertically Shifted Cosecant縦に伸ばし、横に縮め、縦に移した余割のグラフを描く
Sketch a graph of What are the domain and range of this function?
のグラフの概形を描け。この関数の定義域と値域は何か。
Solution 解答
• Step 1. Express the function given in the form • Step 2. Identify the stretching/compressing factor, • Step 3. The period is • Step 4. The phase shift is • Step 5. Draw the graph of but shift it up • Step 6. Sketch the vertical asymptotes, which occur at
・手順1。与えられた関数を の形で表す。・手順2。伸縮の倍率 を見分ける。・手順3。周期は である。・手順4。位相のずれは である。・手順5。 のグラフを描き、上に 移す。・手順6。垂直漸近線の概形を描く。これは に現れる。
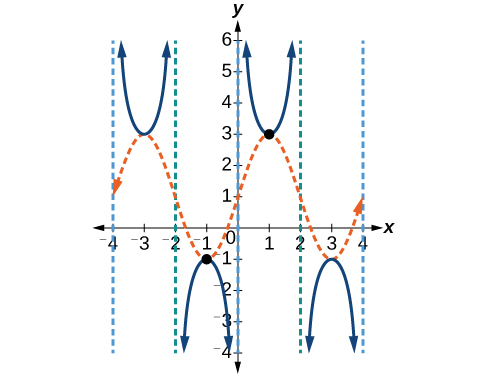
The graph for this function is shown in Figure 11.
この関数のグラフを図11に示す。
Analysis 考察
The vertical asymptotes shown on the graph mark off one period of the function, and the local extrema in this interval are shown by dots. Notice how the graph of the transformed cosecant relates to the graph of shown as the orange dashed wave.
グラフに示した垂直漸近線がこの関数の1周期を区切っており、この区間の局所の極値を点で示してある。変形した余割のグラフが、橙色の破線の波で示した のグラフとどう関わるかに注目しよう。
try it feature #7確認問題 7
Given the graph of shown in Figure 12, sketch the graph of on the same axes.
図12に示した のグラフが与えられたとき、同じ座標軸に のグラフの概形を描け。
![A graph of two periods of a modified cosine function. Range is [-1,3], graphed from x=-4 to x=4.](img/29f60bd3935e7391994c7a2abf5c2df844de532a.jpg)