第8章周期関数Periodic Functions
Analyzing Graphs of Variations of y = sin x and y = cos xy = sin x と y = cos x を変形したもののグラフを調べる
Now that we understand how and relate to the general form equation for the sine and cosine functions, we will explore the variables and Recall the general form:
と が正弦関数と余弦関数の一般形の式とどう関わるかが分かったので、変数 と を調べよう。一般形を思い出そう。
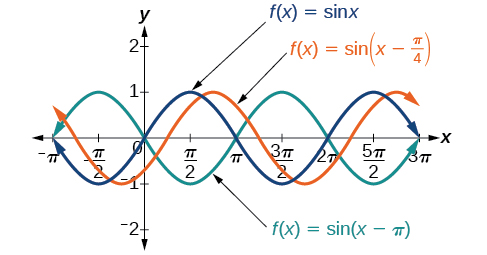
The value for a sinusoidal function is called the phase shift, or the horizontal displacement of the basic sine or cosine function. If the graph shifts to the right. If the graph shifts to the left. The greater the value of the more the graph is shifted. Figure 11 shows that the graph of shifts to the right by units, which is more than we see in the graph of which shifts to the right by units.
正弦曲線状の関数の値 を位相のずれ、すなわち基本の正弦関数や余弦関数の横の変位という。 ならグラフは右に移る。 ならグラフは左に移る。 の値が大きいほど、グラフは大きく移る。図11は、 のグラフが右に 単位移り、これは右に 単位移る のグラフより大きいことを示している。
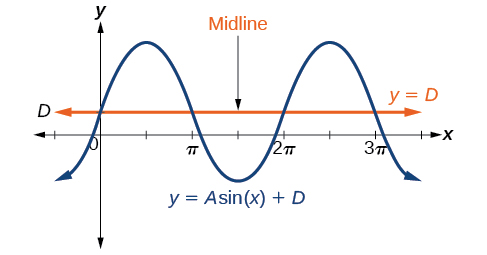
While relates to the horizontal shift, indicates the vertical shift from the midline in the general formula for a sinusoidal function. See Figure 12. The function has its midline at
が横の移動に関わるのに対し、 は正弦曲線状の関数の一般の公式で中央線からの縦の移動を示す。図12を見よ。関数 の中央線は にある。
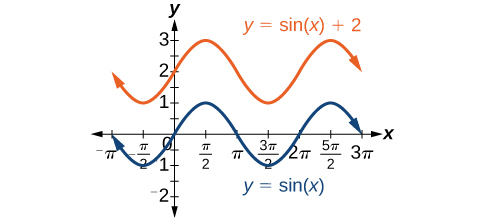
Any value of other than zero shifts the graph up or down. Figure 13 compares with which is shifted 2 units up on a graph.
が0でなければ、その値だけグラフが上下に移る。図13は と、グラフ上で2単位上に移った を比べている。
Note重要事項
Variations of Sine and Cosine Functions正弦関数と余弦関数を変形したもの
Given an equation in the form or is the phase shift and is the vertical shift.
または の形の式が与えられたとき、 が位相のずれ、 が縦の移動である。
Example 3例3
Identifying the Phase Shift of a Function関数の位相のずれを見分ける
Determine the direction and magnitude of the phase shift for
の位相のずれの向きと大きさを決めよ。
Solution 解答
Let’s begin by comparing the equation to the general form
まず、この式を一般形 と比べよう。
In the given equation, notice that and So the phase shift is
与えられた式では かつ であることに注目しよう。よって位相のずれは次のとおりである。
or units to the left.
すなわち左に 単位である。
Analysis 考察
We must pay attention to the sign in the equation for the general form of a sinusoidal function. The equation shows a minus sign before Therefore can be rewritten as If the value of is negative, the shift is to the left.
正弦曲線状の関数の一般形の式では、符号に気をつけなければならない。この式では の前に負号がある。したがって は と書き直せる。 の値が負なら、ずれは左向きである。
Try IT Feature #3確認問題 3
Determine the direction and magnitude of the phase shift for
の位相のずれの向きと大きさを決めよ。
Example 4例4
Identifying the Vertical Shift of a Function関数の縦の移動を見分ける
Determine the direction and magnitude of the vertical shift for
の縦の移動の向きと大きさを決めよ。
Solution 解答
Let’s begin by comparing the equation to the general form
まず、この式を一般形 と比べよう。
In the given equation, so the shift is 3 units downward.
与えられた式では なので、移動は下に3単位である。
Try IT Feature #4確認問題 4
Determine the direction and magnitude of the vertical shift for
の縦の移動の向きと大きさを決めよ。
How To手順
Given a sinusoidal function in the form identify the midline, amplitude, period, and phase shift.
の形の正弦曲線状の関数が与えられたとき、中央線・振幅・周期・位相のずれを見分ける。
1. Determine the amplitude as 2. Determine the period as 3. Determine the phase shift as 4. Determine the midline as
1. 振幅を と決める。2. 周期を と決める。3. 位相のずれを と決める。4. 中央線を と決める。
Example 5例5
Identifying the Variations of a Sinusoidal Function from an Equation式から正弦曲線状の関数の変形を見分ける
Determine the midline, amplitude, period, and phase shift of the function
関数 の中央線・振幅・周期・位相のずれを決めよ。
Solution 解答
Let’s begin by comparing the equation to the general form
まず、この式を一般形 と比べよう。
so the amplitude is
なので、振幅は である。
Next, so the period is
次に なので、周期は である。
There is no added constant inside the parentheses, so and the phase shift is
括弧の中に足された定数が無いので であり、位相のずれは である。
Finally, so the midline is
最後に なので、中央線は である。
Analysis 考察
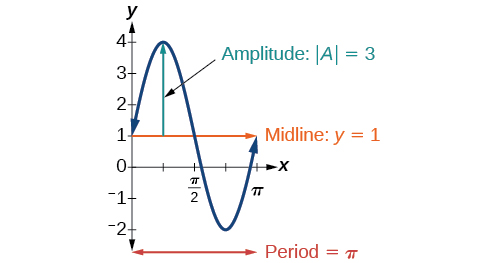
Inspecting the graph, we can determine that the period is the midline is and the amplitude is 3. See Figure 14.
グラフを見れば、周期が 、中央線が 、振幅が3だと決められる。図14を見よ。
Try IT Feature #5確認問題 5
Determine the midline, amplitude, period, and phase shift of the function
関数 の中央線・振幅・周期・位相のずれを決めよ。
Example 6例6
Identifying the Equation for a Sinusoidal Function from a Graphグラフから正弦曲線状の関数の式を見分ける
Determine the formula for the cosine function in Figure 15.
図15の余弦関数の式を決めよ。
![A graph of -0.5cos(x)+0.5. The graph has an amplitude of 0.5. The graph has a period of 2pi. The graph has a range of [0, 1]. The graph is also reflected about the x-axis from the parent function cos(x).](img/173438509d37703060e3c76d5934b9bc38ac45ba.jpg)
Solution 解答
To determine the equation, we need to identify each value in the general form of a sinusoidal function.
この式を決めるには、正弦曲線状の関数の一般形の各値を見分ける必要がある。
The graph could represent either a sine or a cosine function that is shifted and/or reflected. When the graph has an extreme point, Since the cosine function has an extreme point for let us write our equation in terms of a cosine function.
このグラフは、移されたり折り返されたりした正弦関数か余弦関数を表しうる。 のとき、グラフは極値の点 を持つ。余弦関数は で極値の点を持つので、式を余弦関数で書くことにしよう。
Let’s start with the midline. We can see that the graph rises and falls an equal distance above and below This value, which is the midline, is in the equation, so
まず中央線から始めよう。グラフが の上下に同じだけ上がり下がりしているのが見てとれる。この値が中央線であり、式では にあたるので である。
The greatest distance above and below the midline is the amplitude. The maxima are 0.5 units above the midline and the minima are 0.5 units below the midline. So Another way we could have determined the amplitude is by recognizing that the difference between the height of local maxima and minima is 1, so Also, the graph is reflected about the x-axis so that
中央線の上下への最大の距離が振幅である。最大値は中央線より0.5単位上、最小値は中央線より0.5単位下にある。よって である。振幅を決める別のやり方として、局所の最大値と最小値の高さの差が1であることに気づけば となる。またグラフは x軸に関して折り返されているので である。
The graph is not horizontally stretched or compressed, so and the graph is not shifted horizontally, so
グラフは横に伸びても縮んでもいないので であり、横に移ってもいないので である。
Putting this all together,
これをすべて合わせると、
Try IT Feature #6確認問題 6
Determine the formula for the sine function in Figure 16.
図16の正弦関数の式を決めよ。
![A graph of sin(x)+2. Period of 2pi, amplitude of 1, and range of [1, 3].](img/0ab22215a4fdfda2447029a9f774d71ff3f9d997.jpg)
Example 7例7
Identifying the Equation for a Sinusoidal Function from a Graphグラフから正弦曲線状の関数の式を見分ける
Determine the equation for the sinusoidal function in Figure 17.
図17の正弦曲線状の関数の式を決めよ。
![A graph of 3cos(pi/3x-pi/3)-2. Graph has amplitude of 3, period of 6, range of [-5,1].](img/d479854de253440c6939b3a87eaa77135eded08f.jpg)
Solution 解答
With the highest value at 1 and the lowest value at the midline will be halfway between at So
最大の値が1、最小の値が なので、中央線はその中間の になる。よって である。
The distance from the midline to the highest or lowest value gives an amplitude of
中央線から最大の値または最小の値までの距離から、振幅は である。
The period of the graph is 6, which can be measured from the peak at to the next peak at or from the distance between the lowest points. Therefore, Using the positive value for we find that
このグラフの周期は6で、 の山から次の の山まで、あるいは最も低い点どうしの距離から測れる。したがって である。 に正の値を使うと、次が求まる。
So far, our equation is either or For the shape and shift, we have more than one option. We could write this as any one of the following:
ここまでで、式は か のどちらかである。形とずれについては選び方が一つではない。次のどれとしても書ける。
• a cosine shifted to the right• a negative cosine shifted to the left• a sine shifted to the left• a negative sine shifted to the right
・右に移した余弦・左に移した負の余弦・左に移した正弦・右に移した負の正弦
Choosing to use the cosine function, we observe that the peak, which would normally be at , is at , and given the horizontal compression factor of , we get .
余弦関数を使うことにすると、ふつう にある山が にあり、横の縮みの倍率が なので が得られる。
While any of these would be correct, the cosine shifts are easier to work with than the sine shifts in this case because they involve integer values. So our function becomes
どれも正しいが、この場合は余弦のずれのほうが整数の値になるので、正弦のずれより扱いやすい。よってこの関数は次のようになる。
Again, these functions are equivalent, so both yield the same graph.
ここでもこの関数は同値なので、どちらも同じグラフになる。
Try IT Feature #7確認問題 7
Write a formula for the function graphed in Figure 18.
図18にグラフを描いた関数の式を書け。
![A graph of 4sin((pi/5)x-pi/5)+4. Graph has period of 10, amplitude of 4, range of [0,8].](img/0a72e61383d20d28157fe7cf55c26a0af832c086.jpg)